A simple and ef
fi
cient method for
poly-3-hydroxybutyrate quanti
fi
cation in diazotrophic
bacteria within 5 minutes using
fl
ow cytometry
L.P.S. Alves
1, A.T. Almeida
1, L.M. Cruz
1, F.O. Pedrosa
1, E.M. de Souza
1, L.S. Chubatsu
1,
M. Müller-Santos
1and G. Valdameri
1,21
Departamento de Bioquímica e Biologia Molecular, Universidade Federal do Paraná, Curitiba, PR, Brasil 2Departamento de Análises Clínicas, Universidade Federal do Paraná, Curitiba, PR, Brasil
Abstract
The conventional method for quantification of polyhydroxyalkanoates based on whole-cell methanolysis and gas chromatog-raphy (GC) is laborious and time-consuming. In this work, a method based onflow cytometry of Nile red stained bacterial cells was established to quantify poly-3-hydroxybutyrate (PHB) production by the diazotrophic and plant-associated bacteria,
Herbaspirillum seropedicaeandAzospirillum brasilense. The method consists of three steps: i) cell permeabilization, ii) Nile red staining, and iii) analysis byflow cytometry. The method was optimized step-by-step and can be carried out in less than 5 min. Thefinal results indicated a high correlation coefficient (R2=0.99) compared to a standard method based on methanolysis and GC. This method was successfully applied to the quantification of PHB in epiphytic bacteria isolated from rice roots. Key words: Flow cytometry; Nile red; Poly-3-hydroxybutyrate;Herbaspirillum seropedicae;Azospirillum brasilense
Introduction
Polyhydroxyalkanoates (PHAs) are biodegradable poly-mers that can provide an environmentally friendly alternative to replace petroleum-based plastics (1). Poly-3-hydroxybutyrate (PHB) is the most abundant naturally-occurring polyester produced by bacteria in response to carbon oversupply and other nutrient limitations, such as low nitrogen levels (2). PHB is stored as cytoplasmic granules with a diameter ranging from 0.2 to 0.5mm, and can provide carbon and energy for the bacteria under certain conditions (3).
The initial studies concerning PHAs detection were based on gravimetric and infrared spectroscopy methods, and the earliest research in PHB quantification was per-formed using gas chromatography (GC) (3). Although several methods have been described for this purpose, such as HPLC (4),fluorescent dyes (5), ionic chromatog-raphy, and enzymatic methods (6), GC is still the pre-ferred standard method for PHB quantification, showing high sensitivity, accuracy, and reproducibility. However, there are three major drawbacks associated with GC-based methods: i) the use of hazardous solvents at high temperature, ii) a long time requirement for sample processing, and iii) the need for large amounts of bacterial cells. Thus, there is a need for alternatives to GC for PHB quantification.
In the early 1980’s, Nile red [9-diethylamino-5H-benzo (a)phenoxazine-5-one] was described as a promisingfl uo-rescent dye for detection of intracellular lipid droplets by
flow cytometry in aortic smooth muscle cells and on cul-tured peritoneal macrophages (7). In the 1990’s, a method based on Nile red (NR) staining was applied for the detection of PHB production inAlcaligenes eutrophus(8) andRalstonia eutrophaH16 (5). To date, several protocols established for NR staining and PHB quantification byflow cytometry inSaccharomyces cerevisae,Cupriavidus necator(9),
Synechocystis sp. strain PCC6803,Escherichia coli(10), and threePseudomonas sp.(11) have been reported. The optimization of aflow cytometry protocol for the quantifi ca-tion of PHB requires the determinaca-tion of condica-tions for efficient cell permeabilization and optimal NR concentra-tion, parameters that are dependent on cell type, membrane properties and bacterium size.
Herbaspirillum seropedicaeandAzospirillum brasilense
are plant growthpromoting diazotrophic bacteria (12,13). While there are several indications that PHB plays impor-tant roles in nitrogenfixation and plant-bacteria interactions (14–17), the real significance of PHB for bacteria during
plant-colonization remains unknown. The development of techniques allowing PHB quantification in small volumes
Correspondence: G. Valdameri:<[email protected]>| M. Müller-Santos:<[email protected]>
and low cell numbers will allow data collection in restric-tive conditions–such as in bacteria colonizing roots and
other plant tissues–and will contribute to the
determina-tion of the true role of PHB in plant-bacteria associadetermina-tion. In this study, we describe the optimization and valida-tion of a simple, fast and accurate method for the quan-tification of PHB production in H. seropedicae and
A. brasilense, based on NR staining andflow cytometry.
Material and Methods
Reagents and buffers
Phosphate-buffered saline (PBS) containing 137 mM NaCl, 2.7 mM KCl, 8 mM Na2HPO4and 1.4 mM KH2PO4
at pH 7.2 NR (Sigma Aldrich, USA) was dissolved in DMSO to afinal concentration of 3.14 mM (1 mg/mL) and kept in the dark. NR was further diluted in different buffers as indicated in the Figure legends. TBAC buffer [PBS containing 1 mM EDTA and 0.01% (v/v) Tween 20] was used to avoid the formation of bacterial aggregates that could potentially perturb light-scattering andfluorescence signals in flow cytometric analysis. TSE buffer contains 10 mM Tris-HCl pH 7.5, 20% (wt/vol) sucrose and 2.5 mM EDTA. All other reagents were commercial products of the highest purity grade available.
Bacterial strains and growth conditions
H. seropedicaestrain SmR1 (wild type) (18) and strain
DphaC1, an SmR1 mutant deficient in PHB synthesis, previously described asDphbC1 (19), were cultivated in NFbHP-malate medium containing 0.5% of DL-malic acid and 20 or 5 mM of NH4Cl. A. brasilensestrain FP2 (20)
and A. brasilense Sp7 mutant strain phbC (21) were cultivated in NFbHP-lactate medium containing 0.5% of DL-lactic acid and 20 or 5 mM of NH4Cl.A. brasilenseFP2
is a spontaneous mutant strain from A. brasilense Sp7 resistant to nalidixic acid and streptomycin (20). Antibiotics were added to the growth media in the following con-centrations: streptomycin (80mg/mL) forH. seropedicae, streptomycin (80mg/mL) and nalidixic acid (10mg/mL) for
A. brasilensestrain FP2, and kanamycin (100mg/mL) for
A. brasilenseSp7 mutant strainphbC.
PHB quantification by gas chromatography
The bacterial PHB amount was determined by acid methanolysis followed by GC coupled to aflame-ionization detector as previously described (22). Methanolysis was performed with 5–10 mg of lyophilized bacteria in
2 mL of chloroform and 2 mL of methanol containing 15% sulphuric acid in borosilicate glass tubes with screw caps. For each reaction, 0.5 mg of benzoic acid was added as internal standard. Reaction mixtures were incubated at 100°C for 3.5 h in a dry-heating block. After cooling, 1 mL of distilled water was added and the tubes were vortexed for 60 s. The upper aqueous phase was removed and the lower organic phase containing the resulting 3-hydroxybutyric
methyl ester (Me-3-HB) was dried with Na2SO4 and
analyzed by GC in a 450 GC chromatograph (Varian, Netherlands) equipped with a CP-Sil-5 CB column (10 m
0.53 mm ID). Argon was used as carrier gas at 0.9 mL/min. The injector was set at 250°C and the detector at 275°C. The oven temperature program was: initial temperature 50°C for 2 min, then from 50°C up to 110°C at a rate of 20°C/min and finally up to 250°C at a rate of 20°C/min. The PHB amount in each sample was normalized by the weight of the lyophilized bacteria and expressed as a percentage of PHB/cell dry weight.
PHB quantification byflow cytometry
Flow cytometry experiments were performed in a BD Accuri C5sFlow Cytometer (USA) equipped with a 488-nm laser forfluorescence excitation. For each sample, 100,000 events were acquired, and the medianfluorescence inten-sities were obtained from histograms of FL2-H 585/40 nm channel. Flow cytometry calibration was performed using spherothech 8-peak beads (BD Accurit, USA) according to the manufacturer’s recommendations and instructions.
Optimization of theflow cytometric protocol for PHB
quantification
For all steps of the optimization process, an aliquot of 100mL (B106–10
7
cells/mL) of the cell culture was centri-fuged for 1 min at 13,400 g at room temperature, the supernatant solution was discarded and the cell pellet was treated according to each specific condition. For all conditions, after staining with NR, the cells were collected by centrifugation for 1 min at 13,400gand resuspended in TBAC buffer for analysis by flow cytometry. During the optimization process the following steps were carried out in order of description:
1) Cell permeabilization conditions: the cell pellet was resuspended in 1 mL of each of the evaluated mem-brane permeabilization solutions (TBAC containing 30% of ethanol, TBAC containing 0.1% of Triton X-100 and TSE buffer). The bacterial suspensions were stained with NR (9.42 mM) for 5 min and analyzed by flow cytometry.
2) Optimization of the ethanol concentration for cell permeabilization: the cell pellet was resuspended in 1 mL of TBAC buffer containing increasing concen-trations of ethanol (up to 70%). After 5 min of ethanol exposure, cells were stained with NR (9.42mM) for 5 min.
3) Bacterial cell permeabilization time: the cell pellet was resuspended in 1 mL of TBAC buffer containing 50% of ethanol and incubated up to 30 min. After ethanol exposure, cells were stained with NR (9.42 mM) for 5 min.
5) Determination of the optimal NR concentration: the cell pellet was resuspended in 1 mL of TBAC buffer contain-ing 50% of ethanol for 1 min. After ethanol exposure, cells were stained with NR (0 to 500mM) for 1 min. 6) Fluorescence stability: the cell pellet was resuspended
in 1 mL of TBAC buffer containing 50% of ethanol for 1 min. Cells were subsequently stained with NR (31.25mM) for 1 min, centrifuged (1 min at 13,400g), and resuspended in TBAC buffer for analysis byflow cytometry. The NRfluorescence was monitored during 90 min by flow cytometry. In addition, samples were stored at 4°C in permeabilization solution (TBAC buffer containing 50% of EtOH), until analysis.
PHB quantification byflow cytometry using NR
fluorescence
The optimized protocol for the quantification of PHB by flow cytometry is described as follows: an aliquot of 100mL (B106–107cells/mL) of a bacterial culture is centrifuged
for 1 min at 13,400 g. The supernatant solution is dis-carded and the cell pellet is resuspended in 1 mL of TBAC containing 50% of ethanol. After 1 min of incubation, samples are stained with 31.25mM of NR for 1 min in the dark, centrifuged 1 min at 13,400 g, and the superna-tant solution discarded. The pellet is then resuspended in 1 mL of TBAC solution and immediately analyzed byflow cytometry.
PHB staining forfluorescence microscopy
The same optimized protocol to prepare bacterial cells stained with NR for flow cytometry was applied to pre-pare cells forfluorescence microscopy. The non-optimized protocol (9) differed from the optimized one mainly in the ethanol (30%) and NR concentration (9.42 mM). The
fluorescent images were obtained using the Axio Imager Z2 microscope (Carl Zeiss, USA), equipped with the scanning platform Metafer 4 and CoolCube 1 camera (Metasystems, USA) magnifying 100 times.
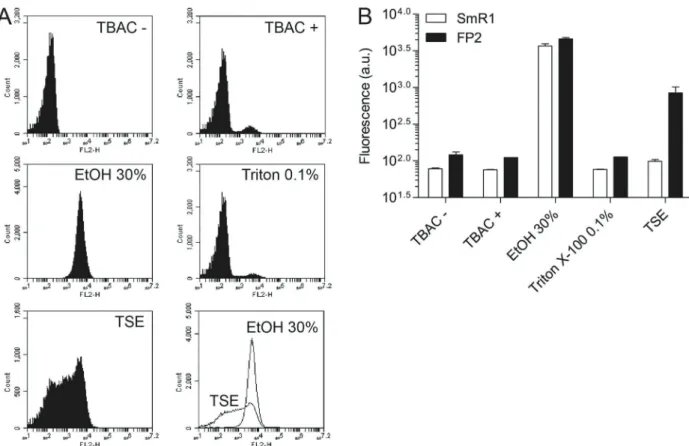
Figure 1.Screening for cell permeabilization solutions. Bacteria were grown at an OD600of 1.2, 0.1 mL was centrifuged (1 min at 13,400g), and resuspended in 1 mL of each solution evaluated. The bacterial suspensions were stained with NR (9.42mM) during 5 min, and analyzed byflow cytometry.A, Histograms are representative ofA. brasilensestrain FP2. Conditions: TBAC–corresponds to Nile red (NR) non-stained
PHB production by epiphytic rice bacteria
Rice experiments were performed according to Valdameri et al. (23). PHB measurements in the epiphytic bacterial populations were performed in bacteria detached from plants 7 days after inoculation. Bacteria were removed from roots by vortexing for 1 min in 1 mL of TBAC contain-ing 50% of ethanol. The suspension was stained with NR following the optimized protocol.
Results
Screening for permeabilization solutions
To determine the best cell permeabilization solution to stain H. seropedicae strain SmR1 and A. brasilense
strain FP2 with NR, we initially compared three different conditions: i) TBAC containing 30% of ethanol, ii) TBAC containing 0.1% of Triton X-100, and iii) TSE buffer. TBAC buffer was previously applied to determine bacterial cell concentration byflow cytometry (23).
As shown in Figure 1A and B, intracellular fl uores-cence of samples stained with NR in TBAC (TBAC+) or TBAC containing detergent (0.1% triton X-100), did not differ from non-stained (TBAC–) samples. In addition, a
sucrose-buffer (TSE) produced only a partial permeabili-zation effect. The representative histograms ofA. brasi-lense strain FP2 permeabilized with TSE buffer clearly showed a heterogeneous cell population (Figure 1A). The same heterogeneous distribution was observed with the H. seropedicaestrain SmR1 treated with TSE buffer (data not shown). TBAC buffer containing 30% of ethanol (EtOH) permeabilized both H. seropedicaestrain SmR1 andA. brasilensestrain FP2, producing a single peak of higher fluorescence, denoting a homogeneous and full membrane permeabilization.
Optimization of ethanol percentage for cell permeabilization
Since TBAC buffer containing 30% of ethanol perme-abilized both bacteria, the effect of ethanol concentration on NR staining was evaluated. Fluorescence histograms of
A. brasilensestrain FP2 reveal that an increase in ethanol concentration increased the amount of permeabilized cells. Indeed, for both bacteria, TBAC buffer containing 50% of ethanol was the best condition for permeabilization considering the increase in NRfluorescence, and a single distinct peak (Figure 2A and B).
Permeabilization time, Nile red exposure and optimal concentration
Cells were incubated in TBAC buffer containing 50% of ethanol up to 30 min before NR staining. As shown in Figure 3A, NRfluorescence levels were similar regardless the incubation time. Therefore, 1 min of permeabilization was used in further experiments, allowing the manipula-tion of five samples simultaneously. A range of NR incubation periods from 0 to 30 min was also evaluated,
and the results showed a similar pattern observed previ-ously for the permeabilization time experiments, with no significant variation influorescence values for all sampling times (Figure 3B). Based on these results, the NR time exposure was established as 1 min. It is noteworthy that bothH. seropedicaestrain SmR1 andA. brasilensestrain
Figure 2. Optimization of ethanol (EtOH) percentage in TBAC buffer for cell permeabilization. Bacteria were grown at an OD600 of 1.2, 0.1 mL was centrifuged (1 min at 13,400g), and resus-pended in 1 mL of TBAC buffer containing different percentages of EtOH (0–70%). After 5 min of EtOH exposure, cells were stained
FP2 showed the same behavior, allowing the use of the same protocol for both species.
To determine the optimal NR concentration to stain cells with higher fluorescence values, a range from 0 to 500 mM was assayed. Since NR is not a PHB-specific dye, it was necessary to measure the NR fluorescence background in non-PHB producing cells. TheH. serope-dicae SmR1 derived mutant DphaC1 defective in PHB production was tested against the wild type SmR1, both at OD6001.2. ForA. brasilense strain FP2, the wild type
at low (0.3) and high (1.2) OD600were compared. These
conditions were selected based on our GC data (not shown) that have shown a high production of PHB at OD6001.2
for both wild type strains, whereas both H. seropedicae DphaC1 mutant strain and A. brasilense strain FP2 at OD6000.3 did not produce PHB, as detected by the GC
method. The optimal NR concentration was 31.25mM for both bacteria (Figure 3C and D).
Fluorescence emission stability
The last parameter to be optimized was the NRfl uo-rescence stability in TBAC buffer and in non-stained and stored permeabilized samples. The fluorescence emis-sion stability of NR stained samples ofA. brasilensestrain FP2 was monitored for a duration of 90 min (Figure 4A). The NR fluorescence started to decrease 5 min after staining. After 30 min, thefluorescence levels were similar to those of the background level. However, it is worth noting that unstained permeabilized cells can be stored under refrigeration (2 to 8°C) without significant loss of NR staining capacity for up to 5 days (Figure 4B). There-fore, one can store samples prior to NR staining for up to
5 days and then stain cells and capture the emitted
fluorescence.
Flow cytometryversusgas chromatography
Several reports have demonstrated a linear correlation between the amount of PHB and the fluorescence emis-sion intensity of NR stained cells. In order to validate the optimized method for PHB quantification byflow cytometry, the standard gas chromatography method was applied to the same bacterial cultures. H. seropedicae SmR1 and
DphaC1 strains,A. brasilense strain FP2, and mutant of
A. brasilensestrain Sp7, identified asphbCSp7, impaired in the production of PHB, were grown in a medium contain-ing 5 and 20 mM NH4Cl, since PHB production has been
correlated with carbon availability and nitrogen limitation. The results revealed that the kinetic curves of NR
fluorescence as a function of OD600varied among bacteria.
As shown in Figure 5A,H. seropedicaestrain SmR1 grown in 5 mM NH4Cl produced more PHB as compared to the
growth in 20 mM NH4Cl, results also confirmed by GC. For A. brasilense strain FP2, low NH4Cl levels also triggered
PHB production; however, A. brasilense strain FP2 grown in 20 mM NH4Cl did not produce any detectable PHB
(results also confirmed by GC; Figure 5B). These data highlighted important differences between PHB accumula-tion inH. seropedicaestrain SmR1 andA. brasilensestrain FP2, since H. seropedicaestrain SmR1 seems to always produce PHB, even at low OD600, whereas A. brasilense
strain FP2 produces PHB only in OD6001.0 or higher, with
limiting nitrogen concentration in the growth medium. As shown in Figure 5C,flow cytometry and GC present a very high correlation coefficient (R2) of 0.99 for both bacteria.
Fluorescence microscopy analysis
Although this method has been optimized with every precaution possible to ensure high accuracy inflow cytometry
determination of PHB, the same protocol can be success-fully applied to stain cells for fluorescence microscopy analysis. To confirm this assumption, H. seropedicae
and A. brasilense samples stained with NR using the optimized protocol were analyzed byfluorescence micros-copy. In addition, the non-optimized versus optimized procedures were compared. Fluorescent micrographs of
H. seropedicae and A. brasilense revealed an increase
fluorescence emission intensity in samples stained using the optimized protocol (Figure 6).
PHB production in epiphytic bacteria analyzed byflow
cytometry
To determine whether this optimized method could be applied to quantify PHB in small-cell-number samples,
H. seropedicaestrain SmR1 andA. brasilensestrain FP2 cells epiphytically growing on rice roots were detached, stained and PHB was quantified byflow cytometry. After 7 days of rice inoculation, the results showed that both
H. seropedicaeSmR1 andA. brasilenseFP2 grown epi-phytically on rice produced PHB during colonization (Figure 7). This is afirst-time demonstration of what can be considered an easy and reliable approach to follow the kinetics of PHB production by epiphytic bacteria. Since the amount of epiphytic cells is usually insufficient to be determined by GC-based methods, the optimized protocol developed in the present work constitutes an important tool to monitor the production of PHB during plant-bacteria interaction, to screen for potential PHB producers among plant-associated bacteria, and in biotechnological studies to evaluate and improve PHB production by bacteria.
Discussion
For the feasibility of a NR-based method, the dye must cross the bacterial membranes in order to stain the
intracellular PHB. Full uptake offluorescent dyes appears to be critical for a complete intracellular target staining. Besides the hydrophobicity of NR, the bacterial uptake
varies widely among different species, essentially due to differences in membrane permeability. Several strategies can be applied to improve the entry of NR, such as those
using buffers containing ethanol (9), or sucrose-based buffers, such as the TSE buffer (10).
The sucrose-buffer TSE was successfully applied to permeabilize cells of Synechocystis sp. PCC6803 and
Escherichia colito NR staining in PHB-producing condi-tions (10). In the present work the TSE buffer failed to efficiently permeabilizeH. seropedicaestrain SmR1, and produced only a partial effect onA. brasilensestrain FP2 (Figure 1A and B). The TBAC buffer, on the other hand,
containing 50% ethanol was found to be the best perme-abilization solution forH. seropedicaeandA. brasilense.
Apparently, the optimal NR concentration can vary among species, and therefore the adjustment of the con-centration according to species is a critical step for opti-mization. For both H. seropedicae and A. brasilense
strains, fluorescence emission increased up to the NR concentration of 31.25mM, decreasing at higher trations of NR (Figure 4A). Despite the very low concen-tration of NR (0.032mM) described for bothSaccharomyces cerevisaeandCupriavidus necator(9), most bacteria require higher NR concentrations, as demonstrated for Synecho-cystis sp. strain PCC6803 (3.3 mg/mL – 9.42 mM), Escherichia coli (33mg/mL– 94.2 mM) (10) andRalstonia pickettiiAR1 (20mg/mL–62.8mM) (24). Such variations clearly
show that protocols must be optimized for each microbe under study before the introduction of NR-fluorescenceflow cytometry as a technique to quantify PHB or other kinds of neutral lipids.
Compared to H. seropedicae strain SmR1, in all conditions assayed here,A. brasilensestrain FP2 always produced higher basalfluorescence values (Figures 2, 3, and 5). Two major reasons could explain this observation: i) NR binding to different intracellular lipid droplets, and ii) the difference in size between the H. seropedicae strain SmR1 andA. brasilensestrain FP2, which is almost twice the size. In view of this, we hypothesize that the higher
fluorescence emission values observed forA. brasilense
strain FP2 are probably due to the bacteria size.
Despite the fact that PHA quantification by GC is largely used in microbial PHA research, this methodol-ogy is quite laborious and requires hazardous solvent
Figure 6.Intracellular PHB detection byfluorescence microscopy using the non-optimized and optimized protocols.H. seropedicae strain SmR1, a mutant strain of H. seropedicae, DphaC1, A. brasilensestrain FP2, and a mutant strain ofA. brasilense,phbC SP7 were grown to OD600of 1.4 using 5 mM NH4Cl in growth medium. Fluorescence microscopy analysis was performed using the procedure described in the Material and Methods.
manipulations. The standard method for PHB quantifi ca-tion involving methanolysis followed by GC analysis is a well-established and reproducible technique, however with a main drawback: the long time needed to analyze sample by sample. A typical procedure of methanolysis followed by GC analysis requires 16 h of lyophilization, 5 h of methanolysis and 20 min for GC data acquisition for each sample – at least 250 times longer than our NR
optimized protocol using flow cytometry, which was less than 5 min. In addition, ourflow cytometry protocol is even faster than other flow cytometry methodologies that require 25 to 50 min to be completed (9,10,24). Another advantage of the NR flow cytometry protocol reported here is the low amount of cells required for analysis, which unlike other methodologies allows one to perform a larger number of experiments in different conditions. While the quantification of other PHAs, such as polyhydroxy-hexanoate and polyhydroxyoctanoate, was not tested in this study, we believe our protocol can be successfully adapted to quantify other PHAs.
The methodologies used here, flow cytometry and GC, applied to PHB quantification presented a very high correlation coefficient (R2) of 0.99 for both bacteria.
This level of correlation is in agreement with methods optimized for other microorganisms, such as E. coli
(R2=0.96) (10),S. cerevisiae(R2=0.99), andC. necator
(R2=0.99) (9).
In summary, a reliable and relatively fast flow cyto-metric procedure was developed for PHB quantification in
H. seropedicae SmR1 and A. brasilense FP2 grown in cultures or in cells isolated from grass root surfaces. PHB production can be quantified with accuracy and preci-sion using NR staining, following the six optimized steps detailed in this paper. This protocol has potential to be used in other studies involving PHB metabolism in these and other bacterial species, as well as in quality control of inoculant, since PHB production has been reported as an important feature to maintain the fitness of plant-associated bacteria.
Acknowledgments
We thank Roseli Prado, Valter Baura and Marilza Doroti Lamour for technical assistance and Dr. Gladys Alexandre, University of Tennessee, for providing the
Azospirillum brasilenseSP7 mutant strainphbC. We are also grateful for the National Institute of Science and Technology of Nitrogen Fixation INCT/CNPq/MCT and CAPES forfinancial support. G. Valdameri thanks PNPD/ CAPES for a postdoctoral scholarship.
References
1. Urtuvia V, Villegas P, Gonzalez M, Seeger M. Bacterial produc-tion of the biodegradable plastics polyhydroxyalkanoates. Int J Biol Macromol 2014; 70: 208–213, doi: 10.1016/
j.ijbiomac.2014.06.001.
2. Jendrossek D, Pfeiffer D. New insights in the formation of polyhydroxyalkanoate granules (carbonosomes) and novel functions of poly(3-hydroxybutyrate). Environ Microbiol 2014; 16: 2357–2373, doi: 10.1111/1462-2920.12356.
3. Khanna S, Srivastava AK. Recent advances in microbial polyhydroxyalkanoates.Process Biochem2005; 40: 607–619,
doi: 10.1016/j.procbio.2004.01.053.
4. Karr DB, Waters JK, Emerich DW. Analysis of poly-b -hydroxybutyrate in Rhizobium japonicum bacteroids by ion-exclusion high-pressure liquid chromatography and UV detection.Appl Environ Microbiol1983; 46: 1339–1344. 5. Gorenflo V, Steinbuchel A, Marose S, Rieseberg M, Scheper
T. Quantification of bacterial polyhydroxyalkanoic acids by Nile red staining.Appl Microbiol Biotechnol 1999; 51: 765–772, doi: 10.1007/s002530051460.
6. Hesselmann RP, Fleischmann T, Hany R, Zehnder AJ. Deter-mination of polyhydroxyalkanoates in activated sludge by ion chromatographic and enzymatic methods.J Microbiol Methods 1999; 35: 111–119, doi: 10.1016/S0167-7012(98)00107-9.
7. Greenspan P, Mayer EP, Fowler SD. Nile red: a selective fluorescent stain for intracellular lipid droplets.J Cell Biol 1985; 100: 965–973, doi: 10.1083/jcb.100.3.965.
8. Degelau A, Scheper T, Bailey JE, Guske C. Fluorometric measurement of poly-b-hydroxybutyrate in Alcaligenes eutrophusbyflow cytometry and spectrofluorometry. Appl Environ Microbiol1995; 42: 653–657.
9. Kacmar J, Carlson R, Balogh SJ, Srienc F. Staining and quantification of poly-3-hydroxybutyrate inSaccharomyces cerevisiae andCupriavidus necatorcell populations using automatedflow cytometry. Cytometry A 2006; 69: 27–35,
doi: 10.1002/cyto.a.20197.
10. Tyo KE, Zhou H, Stephanopoulos GN. High-throughput screen for poly-3-hydroxybutyrate in Escherichia coli and Synechocystissp. strain PCC6803.Appl Environ Microbiol 2006; 72: 3412–3417, doi: 10.1128/AEM.72.5.3412-3417.2006.
11. Saranya V, Poornimakkani, Krishnakumari MS, Suguna P, Binuramesh C, Abirami P, et al. Quantification of intracel-lular polyhydroxyalkanoates by virtue of personalizedflow cytometry protocol. Curr Microbiol 2012; 65: 589–594, doi: 10.1007/s00284-012-0198-0.
12. Monteiro RA, Balsanelli E, Wassem R, Marin AM, Brusamarello-Santos LCC, Schmidt MA, et al.Herbaspirillum-plant inter-actions: microscopical, histological and molecular aspects. Plant Soil2012; 356: 175–196.
13. Fibach-Paldi S, Burdman S, Okon Y. Key physiological properties contributing to rhizosphere adaptation and plant growth promotion abilities ofAzospirillum brasilense.FEMS Microbiol Lett2012; 326: 99–108, doi: 10.1111/j.1574-6968.
2011.02407.x.
14. Kadouri D, Jurkevitch E, Okon Y. Involvement of the reserve material poly-beta-hydroxybutyrate in Azospirillum brasi-lensestress endurance and root colonization.Appl Environ Microbiol 2003; 69: 3244–3250, doi: 10.1128/AEM.69.6.
3244-3250.2003.
granule-associated proteins (PhaP1 and PhaP2) on PHB accumulation and symbiotic nitrogenfixation in Sinorhizo-bium melilotiRm1021.J Bacteriol 2007; 189: 9050–9056,
doi: 10.1128/JB.01190-07.
16. Quelas JI, Mongiardini EJ, Perez-Gimenez J, Parisi G, Lodeiro AR. Analysis of two polyhydroxyalkanoate synthases in Bradyrhizobium japonicumUSDA 110. J Bacteriol2013; 195: 3145–3155, doi: 10.1128/JB.02203-12.
17. Mandon K, Michel-Reydellet N, Encarnacion S, Kaminski PA, Leija A, Cevallos MA, et al. Poly-beta-hydroxybutyrate turnover inAzorhizobium caulinodansis required for growth and affects nifA expression.J Bacteriol1998; 180: 5070–5076.
18. Baldani JI, Baldani V, Seldin L, Dobereiner J. Characteriza-tion ofHerbaspirillum seropedicaegen. nov., sp. nov., a root-associated nitrogen-fixing bacterium.Int J Syst Evol Microbiol 1986; 36: 86–93.
19. Tirapelle EF, Muller-Santos M, Tadra-Sfeir MZ, Kadowaki MA, Steffens MB, Monteiro RA, et al. Identification of pro-teins associated with polyhydroxybutyrate granules from Herbaspirillum seropedicae SmR1 - old partners, new players.PLoS One2013; 8: e75066, doi: 10.1371/journal. pone.0075066.
20. Pedrosa FO, Yates MG. Regulation of nitrogen fixation (nif) genes ofAzospirillum brasilenseby nifA and ntr (gln) type gene products.FEMS Microbiol Lett1984; 23: 95–101,
doi: 10.1111/j.1574-6968.1984.tb01042.x.
21. Kadouri D, Burdman S, Jurkevitch E, Okon Y. Identification and isolation of genes involved in poly(beta-hydroxybuty-rate) biosynthesis inAzospirillum brasilenseand character-ization of a phbC mutant.Appl Environ Microbiol2002; 68: 2943–2949, doi: 10.1128/AEM.68.6.2943-2949.2002. 22. Braunegg G, Sonnleitner B, Lafferty RM. A rapid gas
chromatographic method for the determination of poly-b -hydroxybutyric acid in microbial biomass. Appl Microbiol Biotechnol1978; 6: 29–37, doi: 10.1007/BF00500854.
23. Valdameri G, Kokot TB, Pedrosa FO, de Souza EM. Rapid quantification of rice root-associated bacteria by flow cytometry. Lett Appl Microbiol 2015; 60: 237–241,
doi: 10.1111/lam.12351.
24. Shakeri S, Roghanian R, Emtiazi G. Surveillance of single-cell behavior in different subpopulations ofRalstonia pickettii AR1 during growth and polyhydroxybutyrate production phases byflow cytometry.J Basic Microbiol2012; 52: 206–215, doi: