Structure and Metabolism
Mary I. O’Connor1,2¤*, Michael F. Piehler3, Dina M. Leech3, Andrea Anton1,2, John F. Bruno2
1Curriculum in Ecology, The University of North Carolina, Chapel Hill, Chapel Hill, North Carolina, United States of America,2Department of Marine Sciences, The University of North Carolina, Chapel Hill, Chapel Hill, North Carolina, United States of America,3Institute of Marine Sciences, Morehead City, North Carolina, United States of America
Abstract
Climate change disrupts ecological systems in many ways. Many documented responses depend on species’ life histories, contributing to the view that climate change effects are important but difficult to characterize generally. However, systematic variation in metabolic effects of temperature across trophic levels suggests that warming may lead to predictable shifts in food web structure and productivity. We experimentally tested the effects of warming on food web structure and productivity under two resource supply scenarios. Consistent with predictions based on universal metabolic responses to temperature, we found that warming strengthened consumer control of primary production when resources were augmented. Warming shifted food web structure and reduced total biomass despite increases in primary productivity in a marine food web. In contrast, at lower resource levels, food web production was constrained at all temperatures. These results demonstrate that small temperature changes could dramatically shift food web dynamics and provide a general, species-independent mechanism for ecological response to environmental temperature change.
Citation:O’Connor MI, Piehler MF, Leech DM, Anton A, Bruno JF (2009) Warming and Resource Availability Shift Food Web Structure and Metabolism. PLoS Biol 7(8): e1000178. doi:10.1371/journal.pbio.1000178
Academic Editor:Michel Loreau, McGill University, Canada
ReceivedMarch 20, 2009;AcceptedJuly 15, 2009;PublishedAugust 25, 2009
Copyright:ß2009 O’Connor et al. This is an open-access article distributed under the terms of the Creative Commons Attribution License, which permits unrestricted use, distribution, and reproduction in any medium, provided the original author and source are credited.
Funding:This work is funded by The National Fish and Wildlife Federation’s Budweiser Conservation Scholarship and the University of North Carolina Thomas S. and Caroline H. Royster Fellowship. The funders had no role in study design, data collection and analysis, decision to publish, or preparation of the manuscript.
Competing Interests:The authors have declared that no competing interests exist.
Abbreviations:IMS, Institute of Marine Sciences; H/A, heterotroph biomass relative to autotroph biomass; TN, total nitrogen; P-I, photosynthesis versus irradiance.
* E-mail: [email protected]
¤ Current address: National Center for Ecological Analysis and Synthesis, Santa Barbara, California, United States of America
Introduction
The ocean is a dynamic part of the global climate system. The temperature of the sea surface, where almost 50% of the world’s primary productivity occurs [1], varies regionally as the result of changing surface air temperatures, currents, and upwelling of deeper water. Though links between climate conditions and pelagic food web productivity and structure have long been of interest to scientists [2], effects of physical conditions on secondary and tertiary productivity (hereafter: consumer productivity) have seemed too context dependent to allow general predictions [3–5]. The prevailing conceptual framework for understanding effects of ocean temperature on food webs is based on the view that consumer production is predominantly controlled indirectly by temperature effects on primary production [6,7]. According to this model, increased primary productivity and net autotrophy also increase CO2 uptake of the whole food web [8,9]. Yet recently
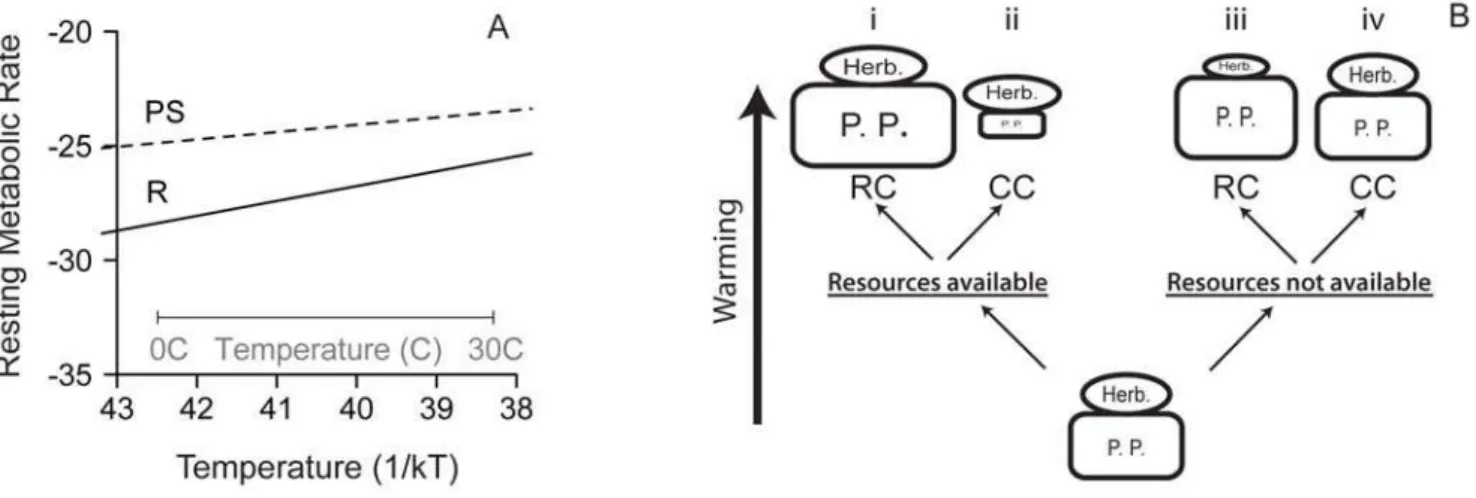
developed metabolic theory and a meta-analysis indicate that heterotrophic (respiration-limited) metabolism is more sensitive to changing temperature than autotrophic (photosynthesis-limited) metabolism and production (Figure 1A) [9,10], suggesting stronger consumer-driven control with warming. Greater consumer control of primary production would lead to increased heterotrophy and less phytoplankton standing stock (Figure 1B-ii). In either model, the response of food web productivity and structure to changing
environmental temperature may be determined by general processes and not the specific responses of component species, and thus could represent a critical step forward in efforts to forecast the impacts of climate change on ecological communities [11,12].
Temperature-driven shifts in food web productivity and structure are limited ultimately by resource availability, and therefore must be considered in realistic nutrient supply contexts (Figure 1B) [5]. In the ocean, the same physical processes that drive temperature patterns also influence resource availability. Temperature-driven stratification isolates surface waters from cool, nutrient-rich deeper water, and because biological produc-tivity at the sunlit surface depletes available nutrients, temperature and nutrient supplies are usually negatively correlated [5]. Nutrient limitation directly constrains primary production, while metabolic responses to temperature influence both photosynthetic and respiratory processes, and thus primary and consumer production. The metabolic effects of temperature therefore should be different and complementary to constraints imposed by resource availability.
To understand the combined effects of temperature and resource availability on food web biomass (gC L21
) and productivity (gC L21
yr21
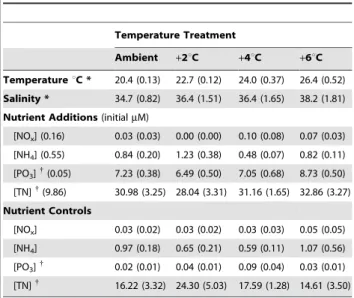
(.63mm) consumers, we experimentally tested the effects of non-lethal temperatures and resource availability on food web structure (biomass allocation among trophic levels) and biomass standing stock (gC L21). We assembled food webs in outdoor microcosms in a factorial experiment with four temperature levels (ambient, +2,+4, and+6uC) and two resource levels (nutrient additions and controls) (Table 1). Treatment levels mimic local estuary conditions during springtime warming and dry versus storm events causing riverine inputs of elevated nutrient concentrations (Figure S1). We measured effects of temperature and nutrient
treatments on standing stocks of primary and secondary producers and on rates of primary productivity. Initial microcosm conditions included known amounts of zooplankton, phytoplankton, and bacteria (Figure 2) collected from the Bogue Sound Estuary at the University of North Carolina’s Institute of Marine Sciences (IMS) in Morehead City, North Carolina.
Results
We found that small increases in temperature (Table 1) shifted food web structure toward greater heterotroph biomass relative to autotroph biomass (H/A) (Figure 2A). This shift is consistent with predictions based on differential temperature scaling of respira-tion- and photosynthesis-limited metabolism (Figure 1) [9,13,14]. Differential temperature scaling implies that organismal processes such as resource use, growth, and reproduction rates scale differently with temperature for heterotrophs and autotrophs [9,14]. Consequently, increased grazing pressure with temperature dramatically reduced standing phytoplankton biomass in spite of increased per capita primary productivity (as approximated by the maximum photosynthesis per unit chlorophyll biomass, PM
B
, Figure 3, Table S1). Stronger consumer effects and greater consumer biomass were driven by higher density, and not increased individual size or a shift in the relative abundance of species (Figure S2). This pattern is consistent with the hypothesis that temperature affected change on a metabolic, individual level rather than via competitive exclusion or other species interactions. Shifts in food web structure with warming were accompanied by a decrease in overall biomass (Figure 2E, Table 2). The decline in total biomass is consistent with stronger consumer control of food web structure with warming [14,15], reflecting a direct effect of temperature on consumers and a disproportionate increase in grazing relative to primary production. Conversion of phyto-plankton into consumer biomass is inefficient (,10% [16]), so as
consumers represent a greater proportion of the food web biomass, total biomass must decline. If instead the predominant influence of temperature on consumer productivity had been mediated indirectly by increased primary productivity, total food web biomass would have increased (Figure 2B-i). Although food web structures with reduced relative primary producer biomass are thought to be unstable, Carpenter et al. (2001) [15] showed that
Figure 1. Effects of temperature on metabolism and food web structure. (A) Temperature (1/kT for T in Kelvin) dependence of photosynthesis- (PS, slope =20.32 eV) and respiration- (R, slope =20.65 eV) based mass-normalized resting metabolic rate (mmol O2/d pg C
ah)
(Adapted from Allen et al., 2005 [10], Lopez-Urrutia et al., 2006 [9]). (B) Four possible effects of warming on food web structure and biomass depend on resource availability and the importance of consumer-controlled (CC) or resource-controlled (RC) food web dynamics. Relative size of boxes and ovals indicate standing biomass stocks for the simplest of food webs comprising herbivores (Herb.) and primary producers (P. P.).
doi:10.1371/journal.pbio.1000178.g001
Author Summary
such a top-heavy food web structure can be sustained over time in natural pelagic lake food webs (i.e., at least 5 years).
There was a strong interaction between resource availability and temperature effects on food web structure and total biomass. Nutrient addition allowed food web structure (H/A) to increase with warming and led to greater total food web biomass that declined with warming (Figure 2). In contrast, in the nutrient control treatments, resource availability constrained primary productivity at all temperatures (Figure 3), limited total standing biomass, and reversed the temperature-induced increase in H/A at the highest temperature. Low H/A at the highest temperature probably reflects exhaustion of resources at the highest produc-tivity rates. In sum, resource availability determined whether food web structure was more strongly influenced by resources or by consumers (Figure 1B). If this experimental system is representa-tive of effects of environmental warming, the interaction between nutrient supply and temperature suggests that in nutrient-poor regions, food webs may be more resilient to warming because consumer production is limited by resource availability, while in nutrient-rich regions small amounts of warming may have dramatic effects on trophic structure, primary productivity, and standing biomass.
Food web experiments in microcosms are a necessary but imperfect approximation of natural conditions. Microcosm experiments allow manipulation of environmental factors that would be impossible in the field while allowing natural feeding interactions, behaviors, and population growth processes to occur. These advantages undoubtedly enhance our understanding of fine-scale biological dynamics in pelagic ecosystems. Nonetheless, small microcosms impose several limitations on the broad interpretation of their results. For example, evaporation at warmer temperatures increased salinity in our microcosms (Table 1). Reduced concentrations of dissolved oxygen and carbon dioxide are also associated with warmer temperatures and likely varied naturally in our microcosms. Though these factors can influence productivity, their effects are negative and small over the
experimental temperature range relative to the strong positive effects of temperature [17]. In addition, it is possible that the importance of consumer control was amplified in our experimental microcosms. For example, small experimental systems with relatively homogenous environments can facilitate foraging and reduce refuges for resources. Nonetheless, top-down determination of food web structure and dynamics has been documented in large-scale aquatic ecosystems [15,18] and may become more important in a warming environment.
Discussion
Temperature is known to influence food web structure [13,19,20], and such findings have generally been attributed to differential effects of resource limitation across trophic levels, or the specific effects of temperature on consumers or producers [13,19]. Our experiments demonstrate that temperature alone can shift food web structure and change total standing biomass. Furthermore, biogeographic trends towards net heterotrophy in warmer climates in open ocean pelagic food webs [9,21] and patterns observed in spring bloom dynamics, rocky intertidal systems, grasslands, and forests [20,22–25] are consistent with differential metabolic scaling across trophic levels, though this mechanism has been invoked and tested in just one of these cases Table 1.Experimental temperature and nutrient treatments.
Temperature Treatment
Ambient +2uC +4uC +6uC
TemperatureuC * 20.4 (0.13) 22.7 (0.12) 24.0 (0.37) 26.4 (0.52)
Salinity * 34.7 (0.82) 36.4 (1.51) 36.4 (1.65) 38.2 (1.81)
Nutrient Additions(initialmM)
[NOx] (0.16) 0.03 (0.03) 0.00 (0.00) 0.10 (0.08) 0.07 (0.03)
[NH4] (0.55) 0.84 (0.20) 1.23 (0.38) 0.48 (0.07) 0.82 (0.11)
[PO3]{(0.05) 7.23 (0.38) 6.49 (0.50) 7.05 (0.68) 8.73 (0.50)
[TN]{(9.86) 30.98 (3.25) 28.04 (3.31) 31.16 (1.65) 32.86 (3.27)
Nutrient Controls
[NOx] 0.03 (0.02) 0.03 (0.02) 0.03 (0.03) 0.05 (0.05)
[NH4] 0.97 (0.18) 0.65 (0.21) 0.59 (0.11) 1.07 (0.56)
[PO3] {
0.02 (0.01) 0.04 (0.01) 0.09 (0.04) 0.03 (0.01)
[TN]{
16.22 (3.32) 24.30 (5.03) 17.59 (1.28) 14.61 (3.50)
Mean (6s.e.) temperature based on hourly datalogger readings throughout the experiment. Temperatures fluctuated63uC daily similar to field conditions. Mean (6s.e.) final salinity and nutrient concentration values are given. Treatments received no nutrients (controls) or 20mM N and 5mM P on Days 0, 2, and 4 (additions). Significant (p,0.01, one- or two-way ANOVA) main effects of temperature*and nutrient{
treatments are indicated. doi:10.1371/journal.pbio.1000178.t001
Figure 2. Effects of temperature and nutrient treatments on food web structure and biomass. Effect of temperature (uC) on mean (6s.e.) (A) ratio of heterotroph to autotroph biomass and the carbon biomass of (B) phytoplankton, (C) microbes, (D) zooplankton, and (E) the entire food web in nutrient addition (
N
) and control (#)treatments. Initial conditions (mean6s.e. indicated by horizontal lines) mimicked contemporary conditions in Bogue Sound. Significance of two-way ANOVA test: ***p,0.001, **p,0.01, * p,0.05. Full statistical results in Table 2.
[9]. By explicitly testing the hypothesis based on metabolic theory in the context of food web ecology, we have for the first time experimentally validated the prediction that universal temperature constraints on individual metabolism can lead to general responses at the community level [11,26].
The interaction between effects of temperature and nutrient availability observed in these experiments deepens our understand-ing of food web responses to changunderstand-ing climate conditions. In pelagic marine ecosystems, projected increases in stratification imply that negative correlations between nutrient availability and temperature will intensify in many regions [5,27]. This pattern occurs on very broad geographic scales (i.e., cold temperate or polar systems relative to tropical systems), on smaller scales within oceans and seas (i.e., the North Sea [19]), and over time within a single region [4]. According to theory supported by our experimental results, small increases in sea surface temperature should cause small declines or no change at all in primary productivity and standing stocks in nutrient-poor systems such as stratified areas with a shallow thermo-or pycnocline. Under such conditions, nutrient limitation would constrain consumer productivity and biomass stocks (Figure 1B-iii), and could even lead to reduced consumer biomass with warming due to increased respiratory costs that exceed available primary production. In contrast, when nutrients are plentiful, as in upwelling or well-mixed systems, warming should increase productivity leading to increased biomass production at higher trophic levels, shifted food web structure, and stronger consumer control of phytoplankton standing stock (Figure 1B-ii).
The importance of temperature scaling of food web structure for fisheries productivity and food webs in aquatic ecosystems depends on the contemporary food web structure. In nature, most food webs include consumers at trophic levels higher than the zooplankton used in our microcosm experiments. In more complex food webs, temperature-driven intensification of con-sumer control could strengthen a trophic cascade, causing increased phytoplankton biomass as a result of indirect effects of increased consumption by carnivores. Alternatively, if consumer biomass has been severely reduced due to overfishing, direct effects of differential temperature scaling across trophic levels may be
difficult to detect and indirect effects of increased primary productivity may be most apparent (Figure 1B-i) [3].
Ocean warming or cooling influences marine ecosystems in a variety of ways. For example, together with associated changes in physical properties such as vertical stratification and ice cover, warming has shifted species composition and altered the timing of seasonal spawning and spring bloom events [5,28,29]. The ramifications of these changes can be severe for some species and mild for others, causing mismatch between interacting species [6,20,28]. Temperature scaling of food web properties, however, is a general response to temperature change that should occur regardless of species composition [9,10]. This mechanistic response can be incorporated into predictions of ecological variation, thus providing one of the few general models for ecosystem change with geography or climate.
The conceptual framework outlined here reinforces predictions that effects of climate change on ecosystem processes will vary among regions [7,30]. Future warming will likely increase secondary productivity and fish harvests in nutrient-rich regions, but may cause little change in more stratified, oligotrophic systems. These are not paradoxical responses, and the general effects of temperature in different nutrient contexts explain why different responses to warming can occur within the same ecosystem. Implications of temperature effects on food webs for the ocean’s role in carbon cycling are unclear, due in part to the mosaic of nutrient-rich and nutrient-poor regions of the world’s oceans, and to temperature-driven shifts in the threshold dividing net heterotrophy from net autotrophic (carbon sinks from carbon sources) [9]. Nonetheless, small degrees of warming may have predictable broad scale consequences for the productivity and structure of aquatic ecosystems.
Methods
Mesocosm System and Experimental Design
Food webs were maintained in 4-L translucent plastic microcosms (n= 5) in outdoor water tables at IMS from April 23 to May 1, 2008. Pilot experiments indicated that 8 days were
Figure 3. Effects of temperature on primary productivity. (A) Mean (695% CI) maximum photosynthesis per unit chlorophyll biomass (PMB) in
nutrient addition (
N
) and no-addition control (#) treatments and (B) P-I curves for nutrient addition (black lines) and no-addition control (gray lines)sufficient to allow zooplankton population growth without exhausting water quality. We maintained temperature treatments in a blocked design with temperature blocked by water table (Table 1). Temperature treatments were significantly different (one-way ANOVA with temperature as a continuous variable: df= 1, F= 567.72, p,0.001), and water table did not alter the treatment effects (comparison of nested linear models using likelihood ratio tests indicated no improvement by including a
water table term: p.0.952). Temperatures were monitored regularly using a hand thermometer and continuously using ibutton Thermochron dataloggers (Dallas semiconductor, Dallas, Texas, USA). Nutrient addition and control replicates were randomly arranged in water tables. Plexiglass and one layer of window screen were placed several inches above microcosms to block UV radiation, minimize evaporation, and reduce light levels to those similar to 0.5–1.0 m depth (approximately 900mM Table 2.Statistical results of two-way ANOVA analyses on the effects of temperature and nutrient levels on biomass standing stocks in an experimental food web.
Response Source df MS F p
Phytoplankton C biomass Temperature 1 2.684 10.504 ,0.01
Nutrients 1 32.796 128.406 ,0.001
Temperature*Nutrients 1 2.293 8.976 ,0.01
Error 36 0.255
Microbe C biomass Temperature 1 4.79861027 23.621
,0.001
Nutrients 1 8.40461026 41.376
,0.001
Temperature*Nutrients 1 2.17561027 10.710
,0.01
Error 36 2.03161028
Zooplankton C biomass Temperature 1 6.926 11.056 0.002
Nutrients 1 6.798 10.851 0.002
Temperature*Nutrients 1 4.504 7.189 0.011
Error 36 0.627
Heterotroph/Autotroph C biomass Temperature 1 18.402 21.285 ,0.001
Nutrients 1 9.908 11.460 0.002
Temperature*Nutrients 1 13.416 15.517 ,0.001
Error 36 0.865
Total C biomass (mg/L) Temperature 1 0.938 19.568 ,0.001
Nutrients 1 8.380 174.861 ,0.001
Temperature*Nutrients 1 0.950 19.825 ,0.001
Error 36 0.048
Zooplankton average length (mm) Temperature 1 3 ,0.001 0.984
Nutrients 1 93,345 14.448 ,0.001
Temperature*Nutrients 1 992 0.154 0.697
Error 36 6,461
Calanoid density Temperature 1 9,193.7 18.434 ,0.001
Nutrients 1 13,468.9 27.006 ,0.001
Temperature*Nutrients 1 3,960.5 7.941 0.008
Error 36 498.7
Cyclopoid density Temperature 1 105.13 1.375 0.249
Nutrients 1 1,155.63 15.120 ,0.001
Temperature*Nutrients 1 235.44 3.080 0.088
Error 36 76.43
Harpacticoid density Temperature 1 12.50 2.059 0.160
Nutrients 1 16.90 2.783 0.104
Temperature*Nutrients 1 2.00 0.329 0.570
Error 36 6.07
Nauplii density Temperature 1 58,277 12.518 0.001
Nutrients 1 121,000 25.992 ,0.001
Temperature*Nutrients 1 56,919 12.227 0.001
Error 36 4,655
photons/m2/s midday on a sunny day), while still allowing unhindered gaseous exchange with the atmosphere. Each microcosm received air through an air stone to maintain oxygen levels and water mixing.
Sampling Food Web Structure, Biomass, and Primary Productivity
Phytoplankton biomass was estimated by quantifying chloro-phyll a concentrations in 50 mL aliquots of each replicate. Nutrient (NH4, PO4, NOXand total nitrogen (TN)) concentrations
were quantified using the filtrate from the same water samples used to estimate phytoplankton biomass. Zooplankton were sorted from water remaining in the microcosm after other sampling (2,768 mL) using a 63mm mesh and preserved in 4.5% sucrose Formalin. In the laboratory, zooplankton were counted and identified to lowest taxonomic level possible at 406magnification. Carbon biomass was estimated by converting from chl a, ash free dry weight, and visual counts for phytoplankton, zooplankton, and microbes, respectively (Text S1).
Final maximum primary productivity was estimated using photosynthesis versus irradiance (P-I) relationships for ambient, +2, and +6uC. Maximum photosynthesis per unit chlorophyll biomass (PMB) and the initial slope of the P-I curve (695%
confidence intervals) were calculated based on estimation of radioactive carbon uptake at each treatment level. Phytoplankton samples were collected from microcosms and spiked with 14C-bicarbonate (Amersham) to a final concentration of 0.8mCi mL21
and incubated for 45 minutes at varied irradiances (Text S1). Effects of temperature and nutrient levels on response variables were analyzed using a two-way ANOVA. Biomass data were log-transformed prior to analysis to meet the assumptions of ANOVA.
All statistical analyses were performed in R (v. 2.7.0). P-I curve fitting was performed in SAS.
Supporting Information
Figure S1 Natural variation in nutrient concentrations (mM) and temperature (uC) in Bogue Sound, North Carolina.
Found at: doi:10.1371/journal.pbio.1000178.s001 (3.60 MB RTF)
Figure S2 Effect of temperature (uC) on zooplankton size, density, and taxonomic composition.
Found at: doi:10.1371/journal.pbio.1000178.s002 (0.34 MB PDF)
Table S1 Parameters for photosynthesis-irradiance (P-I) curves.
Found at: doi:10.1371/journal.pbio.1000178.s003 (0.06 MB RTF)
Text S1 Additional methodological detail.
Found at: doi:10.1371/journal.pbio.1000178.s004 (0.05 MB RTF)
Acknowledgments
We are grateful to Just Cebrian, Carolyn Currin, Will Eaton, Bryce Koukopoulos, Sarah Lee, Howard Mendlovitz, Virginia Schutte, Suzanne Thompson, and the staff of IMS for assistance and support.
Author Contributions
The author(s) have made the following declarations about their contributions: Conceived and designed the experiments: MIO MFP JFB. Performed the experiments: MIO MFP DML AA. Analyzed the data: MIO MFP. Contributed reagents/materials/analysis tools: MFP DML. Wrote the paper: MIO.
References
1. Field CB, Behrenfeld MJ, Randerson JT, Falkowski P (1998) Primary production of the biosphere: integrating terrestrial and oceanic components. Science 281: 237–240.
2. Harvey HW, Cooper HN, Lebour MV, Russell FS (1935) Plankton production and its control. J Mar Biol Assoc U K 20: 407–440.
3. Brander KM (2007) Global fish production and climate change. Proc Natl Acad Sci U S A 104: 19709–19714.
4. McGowan JA, Cayan DR, Dorman LM (1998) Climate-ocean variability and ecosystem response in the Northeast Pacific. Science 281: 210–216. 5. Sarmiento JL, Slater R, Barber R, Bopp L, Doney SC, et al. (2004) Response of
ocean ecosystems to climate warming. Global Biogeochem Cycles 18: GB3003. 6. Cushing DH (1982) Climate and fisheries. New York: Academic Press. 7. Fischlin A, Midgley GF, Price JT, Leemans R, Gopal B, et al. (2007) Ecosystems,
their properties, goods and services. In: Parry ML, Canziani OF, Palutikof JP, van der Linden PJ, Hanson CE, eds. Climate Change 2007: Impacts, Adaptation and Vulnerability. Contribution of Working Group II to the Fourth Assessment Report of the Intergovernmental Panel on Climate Change. Cambridge: Cambridge University Press. pp 211–272.
8. Schindler DE, Carpenter SR, Cole JJ, Kitchell JF, Pace ML (1997) Influence of food web structure on carbon exchange between lakes and the atmosphere. Science 277: 248–251.
9. Lopez-Urrutia A, San Martin E, Harris RP, Irigoien X (2006) Scaling the metabolic balance of the oceans. Proc Natl Acad Sci U S A 103: 8739–8744. 10. Allen AP, Gillooly JF, Brown JH (2005) Linking the global carbon cycle to
individual metabolism. Funct Ecol 19: 202–213.
11. Duarte CM (2007) Marine ecology warms up to theory. Trends Ecol Evol 22: 331–333.
12. Helmuth B, Mieszkowska N, Moore P, Hawkins SJ (2006) Living on the edge of two changing worlds: Forecasting the responses of rocky intertidal ecosystems to climate change. Annu Rev Ecol Syst 37: 373–404.
13. Muren U, Berglund J, Samuelsson K, Andersson A (2005) Potential effects of elevated sea-water temperature on pelagic food webs. Hydrobiologia 545: 153–166. 14. O’Connor MI (2009) Warming strengthens an herbivore-plant interaction: linking individual responses to temperature with changes in community structure. Ecology 90: 388–398.
15. Carpenter SR, Cole JJ, Hodgson JR, Kitchell JF, Pace ML, et al. (2001) Trophic cascades, nutrients, and lake productivity: whole-lake experiments. Ecol Monogr 71: 163–186.
16. Slobodkin LB (1959) Energetics in Daphnia pulex populations. Ecology 40: 232–243.
17. Lobban CS, Harrison PJ (1997) Seaweed ecology and physiology. New York: Cambridge University Press.
18. Frank KT, Petrie B, Choi JS, Leggett WC (2005) Trophic cascades in a formerly cod-dominated ecosystem. Science 308: 1621–1623.
19. Richardson AJ, Schoeman DS (2004) Climate impacts on plankton ecosystems in the Northeast Atlantic. Science 305: 1609–1613.
20. Sommer U, Aberle N, Engel A, Hansen T, Lengfellner K, et al. (2007) An indoor mesocosm system to study the effect of climate change on the late winter and spring succession of Baltic Sea phyto- and zooplankton. Oecologia 150: 655–667.
21. del Giorgio PA, Duarte CM (2002) Respiration in the open ocean. Nature 420: 379–384.
22. Rose JM, Caron DA (2007) Does low temperature constrain growth rates of heterotrophic protists? Evidence and implications for algal blooms in cold waters. Limnol and Oceanogr 52: 886–895.
23. Logan JA, Regniere J, Powell JA (2003) Assessing the impacts of global warming on forest pest dynamics. Front Ecol Environ 1: 130–137.
24. Ritchie ME (2000) Nitrogen limitation and trophic vs. abiotic influences on insect herbivores in a temperate grassland. Ecology 81: 1601–1612. 25. Thompson RC, Norton TA, Hawkins SJ (2004) Physical stress and biological
control regulate the producer-consumer balance in intertidal biofilms. Ecology 85: 1372–1382.
26. Harris LA, Duarte CM, Nixon SW (2006) Allometric laws and prediction in estuarine and coastal ecology. Estuaries Coasts 29: 340–344.
27. IPCC (2007) Climate Change 2007: The Physical Science Basis. Solomon S, Qin D, Manning M, Chen Z, Marquis M, et al. eds. Cambridge (United Kingdom) and New York: Cambridge University Press.
28. Edwards M, Richardson AJ (2004) Impact of climate change on marine pelagic phenology and trophic mismatch. Nature 430: 881–884.
29. Parmesan C (2006) Ecological and evolutionary responses to recent climate change. Annu Rev Ecol Syst 37: 637–639.