Primary School Children’s Lunch and Total Dietary
Intake: A Natural Experimental Evaluation of
Government Policy in England
Suzanne Spence1, Jennifer Delve1, Elaine Stamp1, John N. S. Matthews2, Martin White3,4, Ashley J. Adamson1,4*
1Institute of Health and Society, Human Nutrition Research Centre, Newcastle University, Newcastle upon Tyne, United Kingdom,2School of Mathematics and Statistics, Newcastle University, Newcastle upon Tyne, United Kingdom,3Institute of Health and Society, Newcastle University, Newcastle upon Tyne, United Kingdom,4Fuse, UKCRC Centre for Translational Research in Public Health, Newcastle upon Tyne, United Kingdom
Abstract
In 2005, the nutritional content of children’s school lunches in England was widely criticised, leading to a major policy change in 2006. Food and nutrient-based standards were reintroduced requiring primary schools to comply by September 2008. We aimed to determine the effect of the policy on the nutritional content at lunchtime and in children’s total diet. We undertook a natural experimental evaluation, analysing data from cross-sectional surveys in 12 primary schools in North East England, pre and post policy. Dietary data were collected on four consecutive days from children aged 4–7 years (n= 385 in
2003–4;n= 632 in 2008–9). We used linear mixed effect models to analyse the effects of gender, year, and lunch type on
children’s mean total daily intake. Both pre- and post-implementation, children who ate a school lunch consumed less sodium (mean change2128 mg, 95% CI:2183 to273 mg) in their total diet than children eating home-packed lunches. Post-implementation, children eating school lunches consumed a lower % energy from fat (21.8%, 22.8 to20.9) and saturated fat (21.0%; 21.6 to 20.5) than children eating packed lunches. Children eating school lunches post implementation consumed significantly more carbohydrate (16.4 g, 5.3 to 27.6), protein (3.6 g, 1.1 to 6.0), non-starch polysaccharides (1.5 g, 0.5 to 1.9), vitamin C (0.7 mg, 0.6 to 0.8), and folate (12.3mg, 9.7 to 20.4) in their total diet than
children eating packed lunches. Implementation of school food policy standards was associated with significant improvements in the nutritional content of school lunches; this was reflected in children’s total diet. School food- and nutrient-based standards can play an important role in promoting dietary health and may contribute to tackling childhood obesity. Similar policy measures should be considered for other environments influencing children’s diet.
Citation:Spence S, Delve J, Stamp E, Matthews JNS, White M, et al. (2013) The Impact of Food and Nutrient-Based Standards on Primary School Children’s Lunch and Total Dietary Intake: A Natural Experimental Evaluation of Government Policy in England. PLoS ONE 8(10): e78298. doi:10.1371/journal.pone.0078298
Editor:Lorraine Brennan, University College Dublin, Ireland
ReceivedJune 21, 2013;AcceptedSeptember 19, 2013;PublishedOctober 30, 2013
Copyright:ß2013 Spence et al. This is an open-access article distributed under the terms of the Creative Commons Attribution License, which permits unrestricted use, distribution, and reproduction in any medium, provided the original author and source are credited.
Funding:This work was undertaken as part of the research programme of the Public Health Research Consortium. The Public Health Research Consortium is funded by the Department of Health (DH) Policy Research Programme. The views expressed in this publication are those of the authors and not necessarily those of DH. Information about the wider programme of the PHRC is available from http://phrc.lshtm.ac.uk/. The funders had no role in the study design, data collection or analysis, interpretation of findings, writing of, or the decision to submit for publication. All authors had access to data, and take responsibility for the integrity of the data and the accuracy of the data analysis. MW and AJA are partly funded as members of Fuse, the Centre for Translational Research in Public Health, a UK Clinical Research Collaboration (UKCRC) Public Health Research Centre of Excellence. Funding for Fuse from the British Heart Foundation, Cancer Research UK, Economic and Social Research Council, Medical Research Council, and the National Institute for Health Research, under the auspices of the UKCRC, is gratefully acknowledged. AJA is funded by the National Institute of Health Research. Opinions expressed are not necessarily those of the funders.
Competing Interests:The authors have declared that no competing interests exist.
* E-mail: [email protected]
Introduction
The causes, complexities and adverse health effects of obesity are well documented [1–5]. Diet has played a significant role in contributing to childhood obesity levels in the United Kingdom [4]. The National Child Measurement Programme identified 23% of reception (4–5 year olds) and 33% of year 6 (10–11 year olds) children in England as overweight or obese in 2011 [6]. National Diet and Nutrition Surveys report children’s diets exceed recommended intakes of per cent energy from saturated fat and non-milk extrinsic sugars (NMES), and contain low levels of some micronutrients, such as iron [7,8]. Central to improving children’s
diets is the need to reduce intakes of fat, saturated fat, and NMES, while increasing nutrient density.
School Dinners’’ attracted both public and Government attention and led to intensive lobbying by parents and pressure groups [12,13]. In March 2005, a national School Meal Review Panel was established to advise on school food, [14] and in April of the same year the School Food Trust was established to ‘‘transform school food’’ [15]. A major policy change ensued in England, which received legislative support in 2006 [16]. New food- and nutrient-based standards were introduced and primary schools were expected to comply by September 2008 [17]. Food-based standards specify which foods can and cannot be served, and how often. Nutrient-based standards apply to the average nutritional content of school lunches over three-weeks, and specify minimum and maximum levels [18]. Both food- and nutrient-based standards focus on planned provision, not consumption.
To date, research has focused on changes to school and packed lunch [19–22]. There is a lack of research in the UK examining the wider effects of this important policy change, i.e. on the impact of school food standards on children’s total dietary intake. In this paper, we report a natural experimental evaluation [23] to assess whether the introduction of food- and nutrient-based standards in primary schools had an impact on children’s lunchtime dietary intake and their total diet.
Methods
Ethics Statement
Ethical approval was granted by Newcastle University ethics committee (reference 000011/2007). Parents provided written informed consent prior to children’s participation.
Study Design, Setting and Participants
We undertook cross-sectional surveys during two academic years: 2003–4 (pre-) and 2008–9 (post-implementation) in 12 primary schools, North East England. The pre-implementation survey had been completed as part of a prior study [24]. The post-implementation survey used the same methods, which are described briefly here.
A letter with study details was posted to head teachers of the 16 primary schools that had participated in 2003–4. The results presented in this study are based on 12 schools for which comparable data were available from the two surveys. These schools had been identified to represent a comprehensive range of socio-economic circumstances, determined using the free school meal index at school level [25].
All children in Reception, Year 1 and Year 2 (aged 4–7 years) were eligible to participate. Each child received a letter with study details and a form requesting parental permission to participate in the study: consent forms were collected from schools by the study nutritionist.
Data Collection
We used a prospective, 24-hour food diary method (theFood Assessment in Schools Tool (FAST)), validated to record young
children’s dietary intake [24]. FAST assesses foods within six defined daily time slots, along with age- and sex-specific portion sizes, derived from the National Diet and Nutrition Surveys (NDNS) [7].
Four consecutive days of dietary consumption were assessed: three week days and one weekend day. Full written instructions on how to complete the diary were provided to parents. At each school, a team of trained observers and the study nutritionist recorded dietary intake, including, breakfast and afterschool clubs. The diary design enabled categorisation of foods into ‘school lunch’, ‘packed lunch’, and ‘food eaten at home’. All dietary
coding for nutritional composition was based on McCance and Widdowson’s Integrated Composition of Food Dataset [26]. School recipes and menus were obtained to allow for coding of school food and assessing compliance with food- and nutrient-based standards.
All nutrients reported were checked for completeness in McCance and Widdowson’s Integrated Composition of Food Database [26]. To ensure consistency of dietary coding, all food codes, weights and food groups allocated were exported and interrogated, allowing identification and correction of inconsis-tencies.
Main Outcome Measures
Main outcome measures were changes in mean daily intakes of macro- and micro-nutrients in school lunch, packed lunch and total diet. The values for vitamins A and C had skewed distributions and were log-transformed before analysis.
Statistical Analysis
The sample size of the study was pragmatic and determined by the number of children studied in the earlier survey of the participating schools, and by the number of these schools prepared to participate in the more recent survey. Similar studies with smaller numbers of children aged 11–12 years have identified important and statistically significant changes in selected macro and micronutrients [27–29].
The first analysis assessed the direct effect of changes in school lunch standards, and considered only children who ate school lunches. The mean intake of macro- or micro-nutrients of each child from this source alone were compared between the 2003–4 and 2008–9 surveys. A more detailed analysis considered the intake of macro- and micro-nutrients from the total diet: this analysis explored the importance of year of the survey, whether the child ate a school or packed lunch, and the interaction between these factors. All analyses adjusted for the effect of gender and used a linear mixed effect model, with year (of survey), gender and packed/school lunch taken as fixed effects: potential correlation between responses within the same school and child were accommodated by fitting random effects for school and child. The models were fitted usingxtmixedin Stata (version 10) and lme
in R (version 2.14.0).
Results
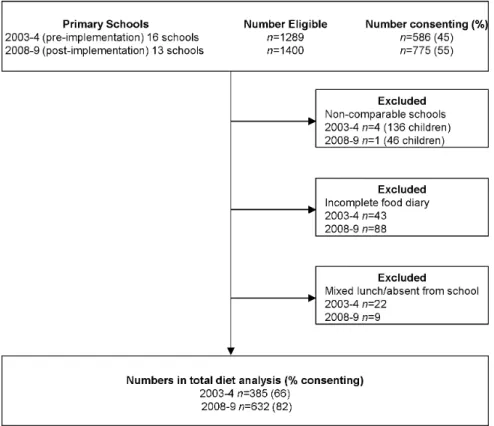
Across all 12 schools, 586 (45% of those eligible) and 775 (55%) children consented in 2003–4, and 2008–9 respectively. Children eligible, consenting and completing, and reasons for exclusion are shown in Figure 1. The analyses included observed dietary intake from 407 children (boysn= 198; girlsn= 209) in 2003–4, and 641
children (boysn= 322; girlsn= 319) in 2008–9. In 2003–04, 233
children ate school lunch (boysn= 106; girlsn= 127); in 2008–09,
323 children ate school lunch (boysn= 164; girlsn= 159).
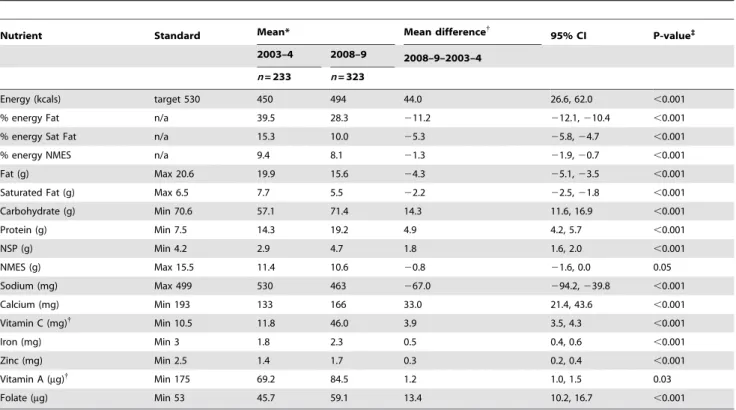
Lunchtime Intake: Change in Mean Daily Nutrients from School Lunches between 2003–4 and 2008–9
increased; these were also statistically significant (Table 1). In relation to the planned nutrient-based standards children’s mean intake from calcium, iron, zinc and vitamin A remain below the minimum standard.
Total Dietary Intake: the Effect of Year and Lunch Type on Mean Daily Nutrient Intake
The results of the analysis of total diet are tabulated in Tables 2– 4. Table 2 presents the results showing the effect of year, Table 3 the effect of lunch type, and Table 4 presents those variables for which there was a significant interaction between year and lunch type.
In children’s total dietary intake between 2003–4 and 2008–9, there was a statistically significant reduction in mean daily intake of per cent energy from NMES (mean change 22.4%, 95% confidence interval23.0 to 21.7), and in absolute intakes of fat (29.5 g, 211.0 to 28.0), saturated fat (24 g, 24.8 to 23.3), NMES (216.9 g,220.3 to213.7), and sodium (2148 mg,2202 to293). There was no evidence of a change in children’s mean daily intake of vitamin A, calcium, iron, or zinc (Table 2). In 2008–9 children’s mean daily intake of per cent energy from NMES and absolute amounts of sodium (mg) remain above the dietary reference value. Mean daily intakes of vitamin A (mg) and zinc (mg) remain below the dietary reference value.
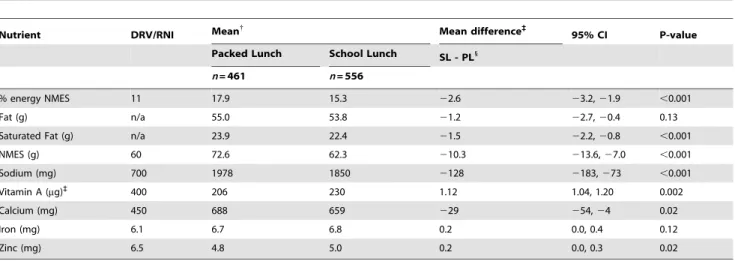
Table 3 shows the effect of children’s lunch type (school or home-packed lunch) on their mean total dietary intake adjusted for year (pre- and post-implementation). Children who ate school lunch consumed a lower mean per cent energy from NMES (mean change22.6%, 95% confidence interval,23.2 to21.9) and lower absolute intakes of saturated fat (21.5 g,20.8 to22.2), NMES (210.3 g,213.6 to27.0), and sodium (2128 mg,2183 to273)
than children eating a packed lunch. Mean daily intakes of vitamin A and zinc were higher in the total diets of children who ate a school lunch (Table 3). Although total fat intake was slightly lower and iron slightly higher in children who ate a school lunch, there was no statistically significant change. Children who ate a school lunch had a statistically significant lower intake of calcium (229 mg,254 to24) in their mean total daily intake.
For a number of macro- and micro-nutrients examined, there was a significant interaction between year (pre- and post-implementation), and lunch type (school or home-packed lunch), and the consequent effect on total dietary intakes (Table 4). In 2003–4, children who ate a school lunch had a lower mean daily energy intake compared with children consuming a packed lunch (257 kcals); by 2008–9, children who had a school lunch had a slightly higher mean daily energy intake, though this difference was very small (29 kcals). In 2003–4, children who ate a school lunch had a higher per cent energy from fat (0.6%); by 2008–9 children who ate a school lunch had a lower per cent energy from fat in their total diets than those who ate a packed lunch (21.2%). Mean total daily per cent energy intake from saturated fat was lower in children who ate a school lunch in 2003–4 and remained lower in 2008–9 (Table 4). Carbohydrate and vitamin C intakes were lower in 2003–4 in those consuming school lunches; by 2008–9 children who ate a school lunch had a higher intake. In 2008–9 children who ate a school lunch had significantly higher mean daily total intakes of protein, NSP, and folate than children who ate packed lunches (Table 4). There was no statistically significant interaction between year and lunch type and children’s mean daily total intake of per cent energy from NMES and absolute amounts of fat, saturated fat, NMES, sodium, vitamin A, calcium, iron, or zinc.
Figure 1. Flowchart detailing numbers (%) of children eligible, consenting, completing four-day food diaries and included in analysis.
Discussion
Summary of Main Findings
This natural experimental evaluation of the nutrient standards for primary schools in England identified important reductions in both per cent energy and absolute intakes of fat, saturated fat, and
NMES in school and packed lunches post-implementation. While we observed a small increase in the energy content of a child’s average school lunch post-implementation, the average energy content provided by either a school or packed lunch was similar post-implementation (494 and 504 kcals respectively) and remained below the target stated in the requirements of
Table 1.School lunch: change in primary school children’s mean daily intake of nutrients from 2003–4 to 2008–9 compared with
planned nutrient-based standards.
Nutrient Standard Mean* Mean difference{ 95% CI P-value`
2003–4 2008–9 2008–9–2003–4
n= 233 n= 323
Energy (kcals) target 530 450 494 44.0 26.6, 62.0 ,0.001
% energy Fat n/a 39.5 28.3 211.2 212.1,210.4 ,0.001
% energy Sat Fat n/a 15.3 10.0 25.3 25.8,24.7 ,0.001
% energy NMES n/a 9.4 8.1 21.3 21.9,20.7 ,0.001
Fat (g) Max 20.6 19.9 15.6 24.3 25.1,23.5 ,0.001
Saturated Fat (g) Max 6.5 7.7 5.5 22.2 22.5,21.8 ,0.001
Carbohydrate (g) Min 70.6 57.1 71.4 14.3 11.6, 16.9 ,0.001
Protein (g) Min 7.5 14.3 19.2 4.9 4.2, 5.7 ,0.001
NSP (g) Min 4.2 2.9 4.7 1.8 1.6, 2.0 ,0.001
NMES (g) Max 15.5 11.4 10.6 20.8 21.6, 0.0 0.05
Sodium (mg) Max 499 530 463 267.0 294.2,239.8 ,0.001
Calcium (mg) Min 193 133 166 33.0 21.4, 43.6 ,0.001
Vitamin C (mg){
Min 10.5 11.8 46.0 3.9 3.5, 4.3 ,0.001
Iron (mg) Min 3 1.8 2.3 0.5 0.4, 0.6 ,0.001
Zinc (mg) Min 2.5 1.4 1.7 0.3 0.2, 0.4 ,0.001
Vitamin A (mg){ Min 175 69.2 84.5 1.2 1.0, 1.5 0.03
Folate (mg) Min 53 45.7 59.1 13.4 10.2, 16.7 ,0.001
*Mean adjusted for gender.
{Arithmetic means and differences are reported except for vitamins A and C (highly skewed) where geometric means and ratios are given.
`
Confidence intervals and P-value derived from a linear mixed effects model with random term for schools. doi:10.1371/journal.pone.0078298.t001
Table 2.Total diet: effect of year on children’s mean daily nutrient intake compared with Dietary Reference Values/Reference
Nutrient Intakes*.
Nutrient DRV/RNI Mean{ Mean difference` 95% CI P-value
2003–4 200829 200829–200324
n= 385 n= 632
% energy NMES 11 18.0 15.6 22.4 23.0,21.7 ,0.001
Fat (g) n/a 60.3 50.8 29.5 211.0,28.0 0.001
Saturated Fat (g) n/a 25.6 21.6 24.0 24.8,23.3 ,0.001
NMES (g) 60 77.5 60.6 216.9 220.3,213.7 ,0.001
Sodium (mg) 700 2000 1852 2148 2202,293 ,0.001
Vitamin A (mg)` 400 210 224 1.08 1.00, 1.16 0.05
Calcium (mg) 450 677 669 28.0 233, 18 0.57
Iron (mg) 6.1 6.8 6.7 0.1 20.2, 0.2 0.73
Zinc (mg) 6.5 4.9 4.9 0.0 20.2, 0.1 0.77
*Dietary reference value/reference nutrient intake35.
{
Mean adjusted for gender and lunch type.
`
530 kcals/day. Post-implementation the average level of all micro-nutrients except calcium were higher in school lunches than packed lunches.
A number of these key changes in children’s mean daily intake from school lunch were reflected in children’s total diet. Post-implementation a child who ate a school lunch had a lower per cent energy derived from fat and saturated fat, but more carbohydrate, protein, NSP, vitamin C and folate in their total diet than children who ate a packed lunch. Findings show that children mean daily intake of % energy from saturated fat and NMES, and absolute amounts of sodium remain above Dietary Reference Values. Children’s mean daily intake of Vitamin A and Zinc continue to remain below the Reference Nutrient Intake.
Strengths and Weaknesses of the Study
This natural experimental evaluation was dependent on repeated cross-sectional surveys, and as such, we were limited in the extent to which changes in nutrient intakes could be attributed to the implementation of the school food policy. Externally imposed time constraints for the implementation of the new standards precluded a stronger, prospective study design. Never-theless, the study offers a unique evaluation of national policy, enabled by the availability of pre-implementation data, collected for an earlier study [24]. To avoid introducing measurement bias, the same methods were employed post-implementation. The study was restricted to a sample of primary schools in one city in North East England, which potentially limits generalisability.
Table 3.Total diet: effect of lunch type on children’s mean daily nutrient intake compared with Dietary Reference Values/
Reference Nutrient Intakes*.
Nutrient DRV/RNI Mean{ Mean difference` 95% CI P-value
Packed Lunch School Lunch SL - PL1
n= 461 n= 556
% energy NMES 11 17.9 15.3 22.6 23.2,21.9 ,0.001
Fat (g) n/a 55.0 53.8 21.2 22.7,20.4 0.13
Saturated Fat (g) n/a 23.9 22.4 21.5 22.2,20.8 ,0.001
NMES (g) 60 72.6 62.3 210.3 213.6,27.0 ,0.001
Sodium (mg) 700 1978 1850 2128 2183,273 ,0.001
Vitamin A (mg)` 400 206 230 1.12 1.04, 1.20 0.002
Calcium (mg) 450 688 659 229 254,24 0.02
Iron (mg) 6.1 6.7 6.8 0.2 0.0, 0.4 0.12
Zinc (mg) 6.5 4.8 5.0 0.2 0.0, 0.3 0.02
*Dietary reference value/reference nutrient intake35.
{
Mean adjusted for gender and year.
`Geometric mean and ratio reported for vitamin A. 1
SL (school lunch) PL (packed lunch). doi:10.1371/journal.pone.0078298.t003
Table 4.Total diet: effect of year and lunch type on children’s mean daily nutrient intake compared with Dietary Reference Values/
Reference Nutrient Intakes*.
Nutrient DRV/RNI* Mean{ Mean` Difference between differences 95% CI P-value
2003–4 2008–9 2003–4 2008–9
n= 385 n= 632
SLII PLII SL PL SL-PL SL-PL [2008–9 SL-PL] – [2003–4 SL-PL]
Energy (kcals) 1
1568.8 1625.3 1452.7 1423.6 256.5 29.1 85.6 15.2, 156.1 0.02
% energy Fat 35 34.1 33.5 30.8 32.1 0.6 21.2 21.8 22.8,20.9 ,0.001
% energy Sat Fat 11 14.3 14.5 12.8 14.0 20.2 21.2 21.0 21.6,20.5 ,0.001
Carbohydrate (g) n/a 224.7 236.8 211.1 206.7 212.1 4.3 16.4 5.3, 27.6 0.004
Protein (g) 19.7 47.2 47.1 50.3 46.6 0.1 3.7 3.6 1.1, 6.0 0.004
NSP (g) n/a 8.7 8.5 10.5 8.8 0.2 1.7 1.5 0.5, 1.9 0.001
Vitamin C (mg)`
30 58.1 67.8 89.0 72.6 1.2 0.8 0.70 0.60, 0.81 ,0.001
Folate (mg) 100 163.3 160.0 171.7 155.9 3.5 15.8 12.3 9.7, 20.4 0.03
*Dietary reference value/reference nutrient intake35.
{Mean adjusted for gender.
`
Geometric mean and ratio reported for vitamin C.
1
Boy (1715 kcals), Girl (1545 kcals).
IISL (Total intake of children having School Lunch), PL (Total intake of children having Packed Lunch).
Food and nutrient-based standards for primary schools are based on the average school lunch over a three-week menu cycle. Some foods on which standards are based, such as oily fish, only have to be served once in this three week cycle. A potential limitation to assessing the impact of food and nutrient-based standards on children’s total diet is that our data collection did not cover a full three week cycle in primary schools. However, there is a selection of food items available at school lunch each day. Children make choices both at the counter and, once seated, they may or may not choose to consume particular food items served. Our findings are based on children’s actual food consumption.
Relationship to Previous Work
This study has shown changes in the nutrient content of both school and packed lunches, but also provides evidence of a widening gap between school and packed lunches. The finding that packed lunches contained more fat, saturated fat, sodium and NMES than school lunch confirms the findings of previous studies [20],[30–33]. This study, along with others, [19], [32,33] provides some evidence of the potential advantages of planned, nutrient-based lunch provision compared with home-prepared packed lunches. Our findings on total diet are similar to those of the NDNS [34] and show some improvements in children’s nutrient intake over recent years. This study provides evidence that at least part of this improvement is associated with the change in school food policy. Although this study has not reported on children’s weight gain following the implementation of the standards, a recent study in the US examined the impact of stricter nutritional standards and student weight gain [35]. Their findings show that, in states with stringent regulation of school food, children eating school lunches improved their weight status. This adds further support for regulation of foods offered at school lunch and the potential impact of such legislation on child health.
Future Research
Both the Healthy Lives, Healthy People (2010) [36] and Foresight [4] reports have highlighted the issue of social inequalities in children’s diets. Schools offer a unique opportunity to influence the food choices of all children with the potential to reduce inequalities [37]. Further research is needed to assess whether the introduction of new school food- and nutrient-based standards has had a comparable effect on children’s total diet across the socio-economic spectrum.
Conclusions and Implications
Although our findings show reductions in children’s average daily intake of per cent energy from saturated fat and NMES, and
absolute intakes of NMES and sodium, intakes remain above the Dietary Reference Values [38]. These remain key areas for public health action, necessitating a focus on children’s food choice at school and beyond. At school, more encouragement and supervision of children at lunchtime with selection of foods, more time to eat, and more child friendly dining environments have been advocated [39]. Following implementation of the nutritional standards, school lunches appeared to have a positive impact on children’s total diet, but this can only be realised fully in children who eat school lunch. School lunch competes against packed lunch where children bring their choice of foods. Although it was observed some schools do impose rules (e.g. no sweets, chocolate, or crisps), there are more often no regulations as to what can and cannot be brought from home in a packed lunch.
It has been advocated that to address the complexity of obesity there is a need for political will [1,5], [40,41]. In 2011, Swinburn et al [39] commented that to enable ‘healthy choices’, policy interventions are required at the environment level. After a highly publicised campaign on the state of school lunches, government provided legislative and financial support for this change in policy, thereby creating an environment to enable healthier food choices in schools. Within the limitations of the natural experimental design, we found that children’s total diet has improved since the reintroduction of food- and nutrient-based standards. Our findings of a positive effect on both lunchtime and total diet intake provide evidence to support this level of intervention in primary schools. Similar policy approaches should be considered for other schools and academies, and other environments influencing children’s diet outside school. Prospective evaluation of public health policy interventions would add considerably to the evidence base.
Acknowledgments
We thank: the schools, parents, and children who provided us with extensive data; all members of the research steering group which included representatives from the Department of Health, Newcastle City and Northumbria County Councils, Newcastle Primary Care Trust and the School Food Trust; and Professor Andrew Rugg-Gunn (Professor Emeritus Newcastle University) for his invaluable expertise and guidance from the inception of the Newcastle and Northumberland dietary surveys.
Author Contributions
Conceived and designed the experiments: AJA MW JM. Performed the experiments: SS JD. Analyzed the data: SS ES JM. Wrote the paper: SS JD ES JM MW AJA.
References
1. Ebbeling C, Pawlak D, Ludwig D (2002) Childhood obesity: public health crisis, common sense cure. Lancet 360: 473–582.
2. WHO (2003) Diet, Nutrition and the Prevention of Chronic Disease: Report of a Joint WHO/FAO Expert Consultation. Geneva: WHO.
3. Lobstein T, Baur L, Uauy R (2004) Obesity in children and young people: a crisis in public health. Obes Rev 5 (Suppl.1): 4–85.
4. Foresight (2007) Tackling obesities: Future Choices- Project Report. 5. Han J, Lawlor D, Kimm S (2010) Childhood obesity. Lancet 375: 1737–1748. 6. Department of Health (2011) National Child Measurement Programme:
England, 2010/11 school year. London: Department of Health.
7. Gregory J, Lowe S (2000) National Diet and Nutrition Survey: young people aged 4 to 18 years. London: HMSO.
8. Bates B, Lennox A, Bates C, Swan G (2011) National Diet and Nutrition Survey: Headline results from years 1 and 2 (combined) of the Rolling Programme 2008/9–2009/10. London:Department of Health.
9. Nelson M, Nicholas J, Suleiman S, Davies O, Prior G, et al. (2006) School meals in primary schools in England. London: Department for Education and Skills.
10. The Education (Nutritional Standards for School Lunches) (England) Regula-tions 2000. Available: http://www.legislation.gov.uk/uksi/2000/1777/ contents/made Accessed 2012 Sep 20.
11. Nelson M, Bradbury J, Poulter J, McGee A, Msebele S, et al. (2004) School Meals in Secondary Schools in England. London: Department for Education and Skills.
12. Spence D (2005) Jamie’s School Dinners. British Medical Journal 330.doi: Available: http://dx.doi.org/10.1136/bmj.330.7492.678 Accessed 2013 Apr 17. 13. BBC NEWS Oliver’s school meal crusade goes on. Available: http://news.bbc.
co.uk/go/pr/fr/-/1/hi/uk/5313882.stm Accessed 2013 Apr 17.
14. School Meals Review Panel (2005) Turning the Tables. Transforming School Food: A report on the development and implementation of nutritional standards for school lunches.
16. The Education (Nutritional Standards and Requirements for School Food) (England) (Amendment) Regulations 2008. Available: http://www.opsi.gov.uk/ si/si2008/pdf/uksi_20081800_en.pdf Accessed 2012 Mar 28.
17. Department for Education and Skills (2006) Nutritional Standards for school lunches and other school food. London: Department for Education and Skills. 18. School Food Trust A Guide to introducing the Government’s food-based and
nutrient-based standards for school lunches Available: www.childrensfoodtrust. org.uk/resources/guide-to-the-nutrient-based-standards Accessed 2013 Jun 13. 19. Rogers IS, Ness AR, Hebditch K, Jones LR, Emmett PM (2007) Quality of food eaten in English primary schools: school dinners vs packed lunches. Eur J Clin Nutr 61: 856–864.
20. Rees GA, Richards CJ, Gregory J (2008) Food and nutrient intakes of primary school children: a comparison of school meals and packed lunches. J Hum Nutr Diet 21: 420–427.
21. Haroun D, Harper C, Wood L, Nelson M (2010) The impact of the food-based and nutrient-based standards on lunchtime food and drink provision and consumption in primary schools in England. Public Health Nutr 14: 209–218. 22. Golley R, Pearce J, Nelson M (2010) Children’s lunchtime food choices following the introduction of food-based standards for school meals: observations from six primary schools in Sheffield. Public Health Nutr 14: 271–278. 23. Craig P, Cooper C, Gunnell D, Haw S, lawson K, et al. (2012) Using natural
experiments to evaluate population health interventions: new Medical Research Council guidance. J Epidemiol Community Health.doi:10.1136/jech-2011-200375.
24. Adamson AJ, Griffiths JM, Carlin LE, Barton KL, Wrieden WL, et al. (2003) FAST: Food Assessment in Schools Tool. Proc Nutr Soc 62: 84A.
2 5 . D i r e c t g o v . c o . u k . A v a i l a b l e : w w w . d i r e c t . g o v . u k / e n / P a r e n t s / Schoolslearninganddevelopment/SchoolLife/DG_4016089. Accessed 2012 Aug 29.
26. Food Standards Agency (2002) McCance and Widdowson’s the Composition of Foods,Sixth Summary Edition. Cambridge: The Royal Society of Chemistry. 27. Adamson AJ, Rugg-Gunn AJ, Butler TJ, Appleton DR, Hackett AF (1992)
Nutritional intake, height and weight of 11–12-year-old Northumbrian children in 1990 compared with information obtained in 1980. Br J Nutr 68: 543–563. 28. Rugg-Gunn AJ, Fletcher ES, Matthews JNS, Hackett AF, Moynihan PJ, et al. (2007) Changes in consumption of sugars by English adolescents over 20 years. Public Health Nutr 10: 354–363.
29. Fletcher ES, Rugg-Gunn AJ, Matthews JNS, Hackett A, Moynihan PJ, et al. (2004) Changes over 20 years in macronutrient intake and body mass index in 11- to 12-year old adolescents living in Northumberland. Br J Nutr 92: 321–333. 30. Evans CEL, Greenwood DC, Thomas JD, Cade JE (2010) A cross-sectional survey ofchildren’s packed lunches in the UK: food-and nutrient-based results. J Epidemiol Community Health 64: 977–983.
31. Evans CEL, Greenwood DC, Thomas JD, Cleghorn CL, Kitchen MS, et al. (2010) SMART lunch box intervention to improve the food and nutrient content of children’s packed lunches: UK wide cluster randomised controlled trial. J Epidemiol Community Health 64: 970–976.
32. Gatenby L (2011) Children’s nutritional intake as part of the Eat Well Do Well scheme inKingston-upon-Hull-a pilot study. Nutr Bull 36: 87–94.
33. Pearce J, Harper C, Haroun D, Wood L, Nelson M (2011) Key differences between school lunches and packed lunches in primary schools in England in 2009. Public HealthNutr 14: 1507–1510.
34. Bates B, Lennox A, Swan G (2010) National Diet and Nutrition Survey-headline results from year 1 (2008–2009). London: Department of Health. 35. Taber D, Chriqui J, Powell L, Chaloupka F (2013) Association between state
laws governing school meal nutrition content and student weight status. JAMA Pediatr.doi:10.1001/jamapediatrics.2013.399.
36. HM Government (2010) Healthy Lives, Healthy People: Our strategy for public health in England. London: HMSO.
37. The Marmot Review (2010) Fair Society, Healthy Lives. London: The Marmot Review.
38. Department of Health (1991) Dietary Reference Values for Food Energy and Nutrients for the United Kingdom. London: HMSO.
39. Adamson A, White M, Stead M, Delve J, Stamp E, et al. (2011) The process and impact of change in the school food policy on food and nutrient intake of children aged 4–7 and 11–12 years both in and out of school; a mixed methods approach. Available: http://phrc.lshtm.ac.uk/papers/PHRC_B5-07_Final_ Report.pdf.