www.earth-syst-sci-data.net/2/189/2010/ doi:10.5194/essd-2-189-2010
©Author(s) 2010. CC Attribution 3.0 License. Open
Access
Science
Data
Data of hydraulic properties of North East and
North Central German soils
U. Schindler and L. M ¨uller
Leibniz Centre for Agricultural Landscape Research (ZALF), Institute of Landscape Hydrology, Eberswalder Str. 84, 15374 M¨uncheberg, Germany
Received: 29 April 2010 – Published in Earth Syst. Sci. Data Discuss.: 11 May 2010 Revised: 8 July 2010 – Accepted: 12 July 2010 – Published: 15 July 2010
Abstract. The paper presents a data base of soil physical and hydrological properties of North East and
North Central German soils. Included are measured data of the soil water retention curve and the unsaturated hydraulic conductivity function. Information on geo-reference, soil type and horizon are given. Soil hydraulic functions were measured with the evaporation method. The applied measurement technique is described and information to actual innovations and advanced technology is given. Additional soil physical data like particle size distribution, dry bulk density, organic matter content and other variables are presented. The data base includes original measurement results of 278 organic and of 497 mineral soil samples from 103 sites. The mineral soils cover a wide range of texture classes and dry bulk densities. The organic soils and samples represent different states of decomposition and mineralization. Furthermore hydraulic functions are included of soils anthropogenically altered by deep plough sand covering measures.
1 Introduction
Knowledge of soil hydraulic functions is required for vari-ous hydrological and plant physiological studies. During the last decades numerous measurement procedures have been developed. Currently a broad array of methods exists for the determination of soil hydraulic properties in the field or in the laboratory (Klute and Dirksen, 1986; Dane and Hop-mans, 2002; Nimmo et al., 2002; Arya, 2002). The evapo-ration method is a frequently used procedure for measuring hydraulic functions of unsaturated soil samples in the labora-tory (Wind, 1966; Becher, 1970; Schindler, 1980; Wendroth et al., 1993; Halbertsma, 1996; Bertuzzi et al., 1999; Arya, 2002). The method allows an accurate characterization of the water retention properties of the porous system, between sat-uration and the measurement limit of tensiometers, and of the unsaturated hydraulic conductivity in the range where sig-nificant hydraulic gradients occur in the sample (Schindler and M¨uller, 2006; Peters and Durner, 2008). The method of Schindler (1980) is a simplified setup of the evaporation method presented by Wind (1968). Only the total soil sample weight and tensions at two height levels are recorded at
sev-Correspondence to:U. Schindler ([email protected])
eral times as the basis for quantifying the hydraulic functions. Peters and Durner (2008) showed that despite the larger spa-tial distance of the tensiometers, effects of spatial and tempo-ral nonlinearity of the soil wetness distribution are negligible in the data evaluation and that the method leads to precise and unbiased results, provided that the usual assumption of water flow according to Richards’ equation, with instantaneous lo-cal equilibrium between water content and matric pressure, is valid (Durner and Fl¨uhler, 2005).
2 Materials and methods
2.1 Soils and sites
Measurements of the water retention curve and the unsatu-rated hydraulic conductivity function were carried out in the laboratory with the evaporation method (Schindler, 1980). The 497 mineral soil samples cover a wide range of tex-ture classes (AG Boden, KA4 1994) (Fig. 1) and dry bulk densities. The organic matter content ranged between 0 and maximum about 5%. The structure of the soils was assigned according to FAO guidelines (1990) to 5 classes: SG – sin-gle grain, GR – granular, PR – prismatic, PS – subangular prismatic, MA – massive. The 278 organic soils contain peat samples (organic matter content>30%) of different grades of
decomposition and mineralization, several muddy substrates, as well as clay and sand soils rich in humus (organic matter content>10%) (Table 1). Additionally to the soil
hydrologi-cal properties, the particle size distribution, dry bulk density, organic matter content and other parameters were measured. However, most fen sites are underlain by sand. These min-eral samples are included in the database of organic soils, too. Different pedogenetically altered soil types of deep and shallow fens, with and without sapric horizons (mud, F: Fc – calceric mud, Fs – sandy mud, Ft – clayey mud, Fi – organic mud) in the profile were considered. The following soil types were studied: earthyfied fen (Erdfen), weakly moorshyfied fen (Fenmulm) and moorsh (Mulm) with the horizons (fol-lowing Succow and Joosten, 2001).
– nH: Pedogenetically almost unmodified peat below the water table.
– nHa: Peat subsoil horizon with segregation structure as a consequence of swelling and shrinking.
– nHv: Earthyfied peat topsoil horizon, crumbles and small-polyhedric aggregates.
– nHvm: Weakly moorshyfied topsoil horizon, intermedi-ate stage between nHv and nHm
– nHm: Moorsh topsoil horizon, small aggregates, powder-like under dry conditions, smeary under wet conditions
In addition, half-fen soils (Aa) with organic matter content lower than 30%, sand covered fens (yYAp), as well as deep-ploughed sites (R) were investigated (Schindler et al., 1999). At the deep-ploughed sites we analyzed the A horizon (RAp-mixture of sand and a small amount of peat) underlain by the sand (RGo) and peat (RnH) plough section.
2.2 Data base
The data (raw data) are collected in the soil hydrological data base of the Institute of Landscape Hydrology of the ZALF at
Lt2
0 20 40 60 80 100
0 20 40 60 80 100
Ss St2 St3 Ts4 Ts3 Ts2
Tl
Ls4 Lts Tl
Lt2 Lt3 Tu2
Uls Lu Tu3
Ls2
Ls3 Uu
Us
Su4
Su3
Tu4
Lt2 Ul4
Sl2 Sl3
Sl4
Su2 Ul2
Ul3
Clay (% by mass) Silt (% by mass)
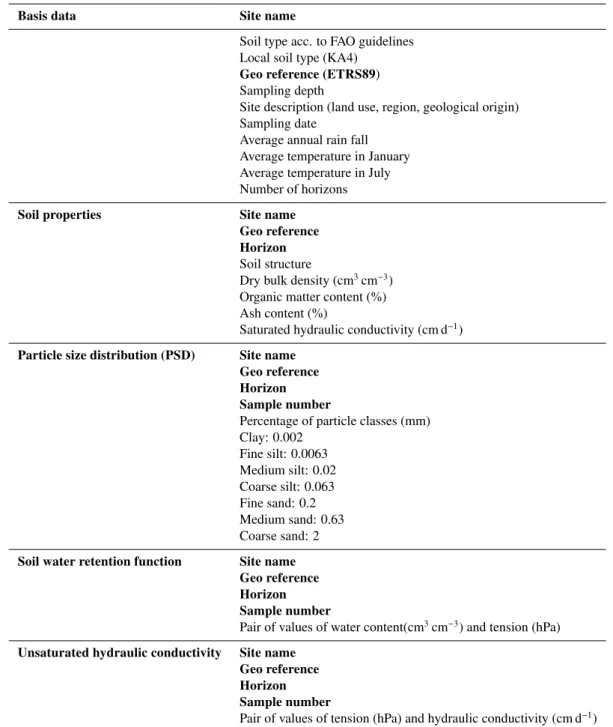
Figure 1.Distribution of texture classes according to German clas-sification (Arbeitsgruppe Boden, KA4, 1994) of the investigated soils. Warning: There is a mismatch between the German PSD system and the internationally frequently used FAO/USDA system.
M¨uncheberg. The structure of the data base is the same as in the HYPRES database (W¨osten et al., 1999). Table 1 gives an overview of the data base content.
2.3 Measurement of soil hydraulic properties with the evaporation method (Schindler, 1980)
Intact soil cores are taken in stainless steel cylinders (250 cm3 volume, 6 cm height) with a sharpened leading
edge to minimize soil disturbance during insertion. Two tensiometers are installed horizontally at depths of 1.5 and 4.5 cm above the bottom of the core. Cores were slowly satu-rated in the laboratory by placing them in a pan of water. Af-ter saturation, the sample is sealed at the bottom and placed on a balance. Its surface remains open to evaporation. Ten-sion (Ψ) and sample mass (m) are measured at time intervals. The measurement interval of both sample mass and tension varies, depending on soil material and evaporation rate, be-tween 10 min (clay soils and sand near the end of measure-ment, when the hydraulic gradient increases rapidly) and 4 h (sand soils at the beginning of measurement, as long as the hydraulic gradient is small). The measurement is finished when the upper tensiometer reached its tension limit. Ten-sion is measured with mercury tensiometers (measurement range 0<h<70 kPa, measurement accuracy 0.1 kPa). The
mean hydraulic gradient (im) is calculated on the basis of the
Table 1.Data base content and structure.
Basis data Site name
Soil type acc. to FAO guidelines Local soil type (KA4)
Geo reference (ETRS89)
Sampling depth
Site description (land use, region, geological origin) Sampling date
Average annual rain fall Average temperature in January Average temperature in July Number of horizons
Soil properties Site name
Geo reference Horizon
Soil structure
Dry bulk density (cm3cm−3)
Organic matter content (%) Ash content (%)
Saturated hydraulic conductivity (cm d−1)
Particle size distribution (PSD) Site name
Geo reference Horizon Sample number
Percentage of particle classes (mm) Clay: 0.002
Fine silt: 0.0063 Medium silt: 0.02 Coarse silt: 0.063 Fine sand: 0.2 Medium sand: 0.63 Coarse sand: 2
Soil water retention function Site name
Geo reference Horizon Sample number
Pair of values of water content(cm3cm−3) and tension (hPa)
Unsaturated hydraulic conductivity Site name
Geo reference Horizon Sample number
Pair of values of tension (hPa) and hydraulic conductivity (cm d−1)
Soil and site description was done according to Arbeitsgruppe Boden (KA4, 1994), bold face are fields linking between tables.
from the soil water volume difference∆V (assuming 1 cm3
of water=1 g) per surface area (A) and time unit (∆t). Sin-gle points of the water retention curve are calculated on the basis of the water loss per volume of the sample at timetand the tension averaged over the sample at that time.
The hydraulic conductivity (K) is calculated according to Darcy-Buckingham’s law (Eq. 1).
K(Ψ)= ∆V
2A·∆t·im
(1)
whereΨis the mean tension averaged over the upper ten-siometer at positionz1(4.5 cm above bottom) and the lower
1.0E-05 1.0E-04 1.0E-03 1.0E-02 1.0E-01 1.0E+00 1.0E+01
10 100 1000
-Pressure head (cm)
H
y
dr
a
ul
ic
c
onduc
ti
v
it
y
(
c
m
d
-1 )
Organic soils
Underlying sand and sand cover horizons
Expample- organic soil
0 0.1 0.2 0.3 0.4 0.5 0.6 0.7 0.8 0.9 1
1 10 100 1000
-Pressure head (cm)
W
a
te
r c
o
n
te
n
t
(c
m
3 cm -3)
Organic soils
Undelying sand and sand cover horizons Example- organic soil
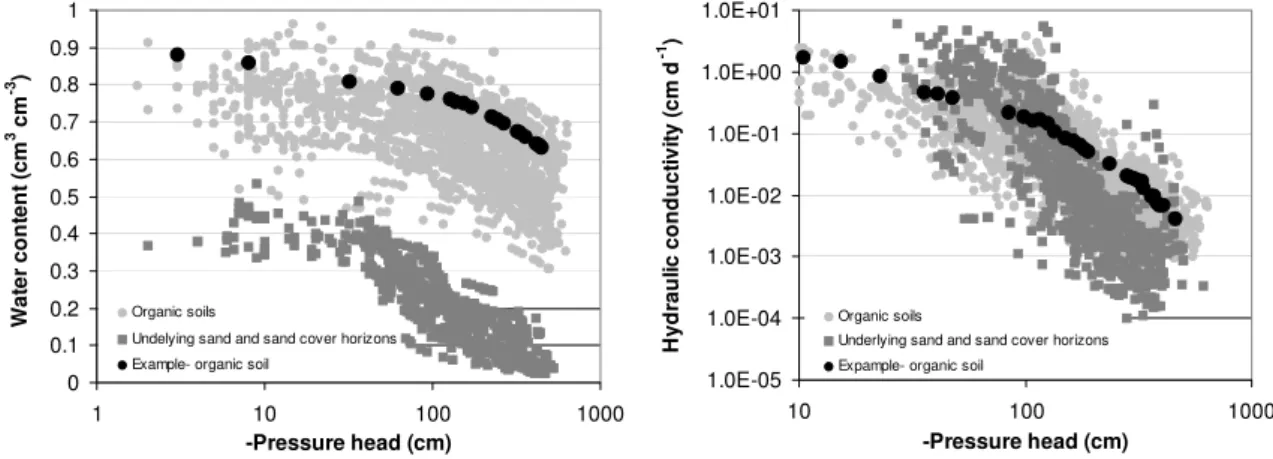
Figure 2.Data range of organic soils, underlying sand and sand cover horizons, and a pair of measured hydraulic functions.
time interval,∆V is the total water volume evaporated from the complete sample (equal to sample mass difference,∆m, in the given time interval),Ais the cross sectional area of the sample, andimis the mean hydraulic gradient effective in the
time interval, given by:
im=
1 2·
Ψt1,upper−Ψt1,lower
∆z +
Ψt2,upper−Ψt2,lower
∆z
!
−1 (2)
whereΨt,upper,lower indicate the tension values of the upper
and lower tensiometers at timet, and∆zis the vertical dis-tance of the tensiometers from each other. At the end of the measurement, the amount of water that remained in the sam-ple is determined by drying in an 105◦C oven and weighting
the dry sample.
The assumptions for the validity of Eq. (1) are:
i) “quasi steady state” conditions, which means that flux and hydraulic gradient are approximately constant over the time interval.
ii) linear decreasing water content over the sample height in the time interval. Accordingly, the flux through the measured layer (half of the total flux) can be calculated from the soil water volume difference in the time inter-val. Results by Peters and Durner (2008) confirmed the validity of these assumptions.
The initial water content is determined using the sum of the water content (loss by evaporation plus the residual wa-ter content afwa-ter the last measurement) and the volume of the core. Dry bulk density is derived from dry soil mass di-vided by core volume. For this reason the volume of the ten-siometer holes (1 cm3) is subtracted from the core. The total
measurement time is depending on the evaporation rate and the soil water content in the measurement range (tension be-tween 0 and about 60 kPa) and varies bebe-tween 3 days for clay soils and maximum 10 days for sand and peat soils. Figure 2 presents exemplarily the data range of measured hydraulic functions of the organic soils. Included are the range of hy-draulic properties of the underlying sand of the fen sites and
the sand cover horizons of the deep-ploughed sites, as well as an example of a pair of measured hydraulic functions, as obtained using the evaporation method.
2.3.1 Advantages and disadvantages of the current evaporation method
The main advantage of the evaporation method is the simul-taneous quantification of both the water retention curve and the unsaturated hydraulic conductivity function. The method is robust, easy to handle, and the curves are accurately de-scribed by a multitude of measurements. The water reten-tion funcreten-tion has a high resolureten-tion over the entire range from wet to dry conditions. The hydraulic conductivity function is well described in the drier part of the function. Uncer-tainties in tension measurement at the beginning of the ex-periment, however, can lead to uncertainties in the hydraulic gradient and the calculated hydraulic conductivities (Peters and Durner, 2008).
The main disadvantage is the limited measurement range between 0 and maximum 60 kPa (average tension in the soil sample at the end of measurement). Due to sometimes short measuring intervals (<1 h), the demand on weighing accu-racy is very high (at least 0.01 g). In order to minimize weighing errors it is recommended to leave the sample on the balance during the entire measuring period. As a result, each sample needs its own balance, and therefore the equip-ment required is rather cost intensive. This situation cannot be remedied by applying automatic sample changers.
2.3.2 Innovations (not yet effective for the published soil physical data base)
1.00E-05 1.00E-04 1.00E-03 1.00E-02 1.00E-01 1.00E+00
10 100 1000 10000
-Pressure head (cm)
H
y
dr
a
u
li
c co
nduc
ti
v
it
y
(
c
m
d
-1)
0.00 0.10 0.20 0.30 0.40 0.50
0 1 10 100 1000 10000 100000
-Pressure head (cm)
W
a
te
r co
nt
en (
c
m
3 cm -3)
Current range Extended range Permanent wilting point
Current range Extended range
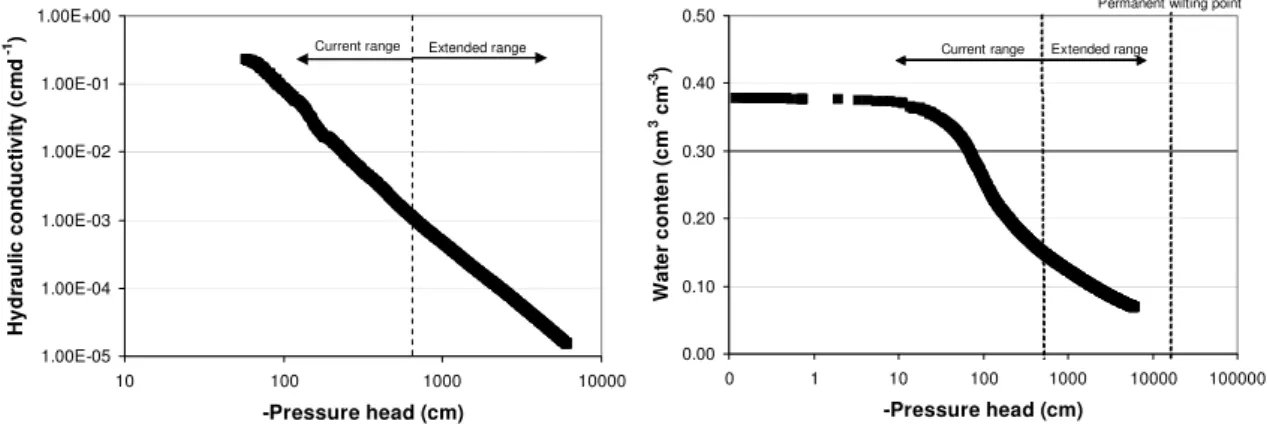
Figure 3.Extended hydraulic functions measured with the evaporation method. Sandy loam, Dedelow, Uckermark (Germany).
method while maintaining the same quality of unsatu-rated hydraulic conductivity and water retention func-tions (Schindler et al., 2006).
2. Applying new cavitation tensiometers and using the air-entry pressure of the tensiometer’s porous ceramic cup as additional defined tension value allows the quantifi-cation of hydraulic functions up to close to the wilting point (Fig. 3, Schindler et al., 2010a, b). Depending on the evaporation rate and the evaporative water loss during the evaporation measurement, the entire mea-surement time varies between 3 days for clay soils and maximum 10 days for sand and peat soils. Compared with the mainly used techniques (water retention curve: sandbox, kaolinite box and pressure plate extractor; un-saturated hydraulic conductivity function: multi-step outflow method), the evaporation method is cost and time saving.
2.4 Methods to determine other physical properties 2.4.1 Particle size analyzes
The particle size distribution is an important basic soil physi-cal variable for characterizing and classifying soils. Particle-size measurements took place using the gravitational sedi-mentation (pipette method) according to Gee and Or (2008). It relies on the relationship between settling velocity and par-ticle diameter at a given depth.
Two conditions need to be met before running the mea-surements:
1. Disintegration of the soil material and
2. a solution free of organic carbon, calcium and other salts.
Pretreatment of samples to enhance the separation or disper-sion of aggregates is a key step in particle-size measurement and is generally recommended since many soils contain ag-gregates that are not readily dispersed (Gee and Or, 2002).
Organic carbon was destroyed by cooking in hydrogen peroxide (H2O2). Dispersion occurred by shaking in sodium
pyrophosphate (Na4P2O7). Analyzed particle classes were:
clay (<0.002 mm), fine silt (0.002–0.0063 mm), medium silt
(0.0063–0.02 mm), fine silt (0.02–0.063 mm). The sand fraction, fine sand (0.063–0.2 mm), medium sand (0.2– 0.63 mm), and coarse sand (0.63–2 mm), was analyzed by wet sieving of the disperse solution. Warning: There is a mis-match between the German PSD (Particle-Size-Distribution) system and the internationally frequently used FAO/USDA system. However, the provided data conforms with the ISSS PSD system. Interpolation techniques should be developed in future.
2.4.2 Soil organic matter content and ash content
The soil organic matter content was analysed by dry combus-tion according to DIN ISO 10694 (1994), and calculated on the basis of:
soil organic matter content=organic C·1.724
The ash content was measured by combustion at 550◦C
(DIN 19684 T3) related to the oven-dried soil sample (DIN ISO 11465).
3 Conclusions
4 Data access
The data of the mineral soils are published under doi:10.4228/ZALF.1977.164. The data set contains 497 soil samples covering a wide range of textures, bulk densities and organic matter contents. The data of the organic soils are published under doi:10.4228/ZALF.1978.165. The data set contains 278 soil samples that cover a wide range of soils with different degrees of decomposition and mineralization as well as wide ranges of bulk density and porosity.
Acknowledgements. We thank J. Pilz from the ZALF Landscape information system group, R. Dannowski from the Institute of Landscape Hydrology of the ZALF for helpful assistance, and the anonymous referees for their helpful comments, remarks and suggestions.
Edited by: N. Verhoest
References
Arbeitsgruppe Boden der Geologischen Landes¨amter und der Bun-desanstalt f¨ur Geowissenschaften und Rohstoffe der Bundesre-publik Deutschland: Bodenkundliche Kartieranleitung, 4. Au-flage, Hannover (als KA 4 zitiert), 1994.
Arya, L. M.: Wind and hot-air methods, in: Methods of soil anal-ysis, Part 4, Physical methods, edited by: Dane, J. H. and Topp, G. C., SSSA Book Ser. 5, SSSA, Madison, WI, 916–926, 2002. Becher, H. H.: Ein Verfahren zur Messung der unges¨attigten
Wasserleitf¨ahigkeit, Z. Pflanzenernaehrung u. Bodenkd., 128, 1– 12, 1970.
Bertuzzi, P. and Voltz, M.: The Wind method: A standard labo-ratory method adopted by the French INRA laboratories, Work-shop Proceedings: The use of pedotransfer in soil hydrology re-search, 10–12 Oct., Orleans, France, 51–53, 1997.
Dane J. H. and Hopmans, J. W.: Pressure plate extractor, in: Meth-ods of soil analysis, Part 4, Physical methMeth-ods, edited by: Dane, J. H. and Topp, G. C., SSSA Book Ser. 5, SSSA, Madison, WI, 688–690, 2002.
DIN 19684: Bodenuntersuchungsverfahren im Land-wirtschaftlichen Wasserbau – Chemische Laboruntersuchungen, 1977.
DIN ISO 11465: Bestimmung des Trockenrueckstandes und des Wassergehalts auf der Grundlage der Masse, 1996.
DIN ISO 10694: Bodenbeschaffenheit: Bestimmung des organ-ischen Kohlenstoffgehaltes und des Gesamtkohlenstoffgehaltes nach trockener Verbrennung (Elementaranalyse), 1994. Durner, W. and H. Fl¨uhler: Soil Hydraulic Properties, in:
Ency-clopedia of Hydrological Sciences, Chapter 74, edited by: An-derson, M. G. and McDonnell, J. J., John Wiley & Sons Ltd., 1103–1120, 2006.
FAO: Guidelines for Soil Description, 3rd Edn., Rome, 1990. Gee, G. W. and Or, D.: Particle-Size Analysis, in: Methods of soil
analysis, Part 4, Physical methods, edited by: Dane, J. H. and Topp, G. C., SSSA Book Ser. 5, SSSA, Madison, WI, 255–293, 2002.
Halbertsma, J.: Wind’s evaporation method, determination of the water retention characteristics and unsaturated hydraulic con-ductivity of soil samples. Possibilities, advantages and disad-vantages, European Workshop on Advanced Methods to Deter-mine Hydraulic Properties of Soils, Thurnau, Germany, 10–12 June 1996, Department of Hydrology, University of Bayreuth, 107 pp., 1996.
Nimmo, J. R., Perkins, K. S., and Lewis, A. M.: Steady-state cen-trifuge, in: Methods of soil analysis, Part 4, Physical methods, edited by: Dane, J. H. and Topp, G. C., SSSA Book Ser. 5, SSSA, Madison, WI, 903–916, 2002.
Peters, A. and Durner, W.: A simple model for describing hy-draulic conductivity in unsaturated porous media accounting for film and capillary flow, Water Resour. Res., 44, W11417, doi:101029/2008WR007136, 2008.
Schindler, U.: Ein Schnellverfahren zur Messung der Wasser-leitf¨ahigkeit im teilges¨attigten Boden an Stechzylinderproben, Arch. Acker- u. Pflanzenbau u. Bodenkd., Berlin, 24, 1–7, 1980. Schindler, U., M¨uller, L., and Sch¨afer, W.: Entwicklung der physikalischen und hydrologischen Eigenschaften einer Tiefpflug- Sanddeckkultur, Z. Kulturtechnik und Landentwick-lung, 40, 1–7, 1999.
Schindler, U. and M¨uller, L.: Simplifying the evaporation method for quantifying soil hydraulic properties, J. Plant Nutr. Soil Sc., 169, 623–629, 2006.
Schindler, U., Durner, W., von Unold, G., and Mueller, L.: Evap-oration Method for Measuring Unsaturated Hydraulic Properties of Soils: Extending the Range, Soil Sci. Soc. Am. J., in press, doi:08.0358/sssaj2008.0358, 2010a.
Schindler, U., Durner, W., von Unold, G., Mueller, L., and Wieland, R.: The evaporation method – Extending the mea-surement range of soil hydraulic properties using the air-entry pressure of the ceramic cup, J. Plant Nutr. Soil Sc., in press, doi:10.1002/jpln.200900201, 2010b.
Succow, M. and Joosten, H.: Landschafts¨okologische Moorkunde, E. Schweizerbart’sche Verlagsbuchhandlung Stuttgart, 622 pp., 2001.
Wendroth, O., Ehlers, W., Hopmans, J. W., Kage, H., Halbertsma, J., and W¨osten, J. H. M.: Reevaluation of the evaporation method for determining hydraulic functions in unsaturated soils, Soil Sci. Soc. Am. J., 57, 1436–1443, 1993.
Wind, G. P.: Capillary conductivity data estimated by a simple method, in: Proc. UNESCO/IASH Symp. Water in the unsatu-rated zone, Wageningen, The Netherlands, 181–191, 1968. W¨osten, J. H. M., Lilly, A., Nemes, A., and Le Bas, C.: