COMPARISON OF THE COMPOSITION AND ANTIOXIDANT CAPACITIES OF GREEN TEAS PRODUCED FROM
THE ASSAM AND THE CHINESE VARIETIES CULTIVATED IN THAILAND
Theerapong Theppakorn
1*, Atika Luthfiyyah
1and Karnjana Ploysri
2Address(es): Theerapong Theppakorn,
1 School of Agro-Industry, Mae Fah Luang University, Chiang Rai 57100, Thailand. 2 Tea Institute, Mae Fah Luang University, Chiang Rai 57100, Thailand.
*Corresponding author: [email protected]
ABSTRACT
Keywords: Antioxidant, caffeine, catechins, green tea, polyphenols
INTRODUCTION
Tea is made from the young tender shoots (flushes) of Camellia sinensis (L.) O. Kuntze and it is the most widely consumed drink after water, due to its refreshing and mildly stimulant effects. Freshly harvested tea leaves are processed differently to produce specific types of tea (green, oolong, and black tea). Green tea is heated to avoid enzymatic oxidation. Oolong tea is semi-fermented to permit a moderate level of enzymatic oxidation during processing and then dried. Black tea is the most thoroughly oxidized enzymatically. Approximately 76-78% of the tea produced and consumed worldwide is black tea, 20-22% is green tea and less than 2% is oolong tea (McKay and Blumberg 2002).
The predominant constituents of tea leaves, accounting for up to 30% of the dry weight, are the polyphenols, which include flavonols, flavones, and flavan-3-ols. Of these, 60–80% are the flavan-3-ols commonly known as catechins. Some studies support the idea that among all tea types, green teas contain the highest amount of catechins (Lin et al., 2003). The catechins include (-)-gallocatechin (GC), epigallocatechin (EGC), (+)-catechin (C), epicatechin (EC), epigallocatechin gallate (EGCG), gallocatechin gallate (GCG), (-)-epicatechin gallate (ECG) and (-)-catechin gallate (CG). These compounds are primarily responsible for many of the health benefits, resulting from the antioxidant properties. Antioxidative tea components are reported to have beneficial protective effects against cancers (Trudel et al., 2012; Khan et al., 2009; Shukla 2007), obesity (Li et al., 2013; Ueda and Ashida 2012), cardiovascular disease (Yamada and Watanabe 2007) and diabetes (van Woudenbergh et al., 2012; Fiorino et al., 2012). The radical-scavenging and antioxidant properties of tea polyphenols are frequently cited as important contributors to these beneficial effects (Higdon and Frei 2003). However, studies have shown that the compounds having beneficial health effects in tea is influenced by many factors such as the cultivars, harvest season, age of the plant, climate, environmental conditions and processing conditions (Owuor et al., 2008).
In Thailand, tea is cultivated in the north part of the country in the provinces of Chiang Rai and Chiang Mai (accounting for 93% of tea production in Thailand). About 30% of the production is commercialized in the domestic market, whereas the remaining 70% is exported. Commercially grown teas in Thailand are the
Assam cultivar (Camellia sinensis var. assamica) and the Chinese cultivar (Camellia sinensis var. sinensis). The Assam tea is usually used for green and black tea production, while the Chinese tea is used for green and oolong tea production. Green tea processing in Thailand occurs in five steps: harvesting, roasting, rolling, drying and blending/packing. The amount of tea polyphenols has been regarded as a quality indicator of tea (Owuor et al., 2006). Research concerning the Thai tea has been conducted on the caffeine content (Suteerapataranon et al., 2009) and volatile flavor constituents (Pripdeevech and Machan 2011). Data based on chemical constituents are complementary indicators of the quality of tea, regarding its biological activities. The growing popularity of tea in recent years on the basis of beneficial health effects requires additional data concerning its chemical constituents and biological activities. As polyphenols are the most important group of tea leaf components, especially the catechins, the objectives of this study were to investigate and compare the chemical content and antioxidant capacities of green teas produced from C. assamica and C. sinensis cultivated in Thailand. The contents of caffeine, total polyphenols, total catechins and eight catechins (GC, EGC, C, EC, EGCG, GCG, ECG and CG) together with the radical scavenging capacity and reducing power capacity are also investigated.
MATERIAL AND METHODS
Green tea samples
A total of 13 green teas of 2 major cultivars, C. assamica and C. sinensis (cv. oolong no.12) were collected from factories in Thailand from April to June 2013. The samples were analyzed within 6 months of their production. For each factory, three samples were sampled.
Chemicals and reagents
The standards , which include gallic acid(G, ≥ 99%), (-)-gallocatechin (GC, ≥ 98%), (-)-epigallocatechin (EGC, ≥ 98%), (+)-catechin (C, ≥ 98%), (
-)-epicatechin (EC, ≥ 90%), (-)-epigallocatechin gallate (EGCG, ≥ 95%), caffeine
(CF, ≥ 99%), (-)-gallocatechin gallate (GCG, ≥ 98%), (-)-epicatechin gallate
Tea (Camellia sinensis L.) has attracted much attention due to the antioxidant capacities of bioactive compounds present in it, which are considered beneficial to consumer health. In Thailand, commercially cultivated teas are the Assam and the Chinese cultivars which both are processed as green teas. The aim of this study was to investigate the chemical composition and antioxidant capacities of these teas. Samples were collected from tea factories and analyzed for caffeine content (CF), total polyphenol content (TPC), total catechin content (TCC), (-)-gallocatechin (GC), (-)-epigallocatechin (EGC), (+)-catechin (C), (-)-epicatechin (EC), (-)-epigallocatechin gallate (EGCG), (-)-gallocatechin gallate (GCG), (-)-epicatechin gallate (ECG), (-)-catechin gallate (CG), the 2,2-diphenyl-1-picrylhydrazyl (DPPH) radical-scavenging activity (DPPH-assay) and the ferric reducing antioxidant power (FRAP-assay). The results showed that green tea produced from the Assam cultivar was significantly higher in CF and TPC than the Chinese cultivar. There was no significant difference in the TCC. Both cultivars had the same level of radical scavenging capacity (DPPH). As opposed to the radical scavenging capacity, there was a significant difference in the reducing power capacity (FRAP). The FRAP of the Assam was significantly higher than that of the Chinese tea. There was a significant difference in the individual catechins; the Assam cultivar mainly contained ECG, EGCG, and EC, whereas the major catechins in the Chinese cultivar were EGCG and EGC. Results from this study suggest that the profiles of catechins in green teas manufactured in Thailand might contribute to the cultivars.
ARTICLE INFO
Received 25. 11. 2013 Revised 9. 1. 2014 Accepted 10. 2. 2014 Published 1. 4. 2014
(ECG, ≥ 98%) and (-)-catechin gallate (CG, ≥ 98%), were purchased from Sigma-Aldrich (St. Louis, Missouri, USA). Trolox ((±) -6-Hydroxy-2,5,7,8-tetramethylchromane-2-carboxylic acid) and DPPH (2,2-diphenyl-1-picryhydrazyl) were purchased from Aldrich (Steinheim, Germany). Folin–
Ciocalteu’s phenol reagent, monosodium phosphate monohydrate, disodium
phosphate heptahydrate, acetonitrile, trifluoroacetic acid (TFA), trichloroacetic acid (TCA) and methanol (HPLC-grade) were purchased from Fluka (Buchs, Switzerland). Potassium hexacyanoferrate [K3Fe(CN)6] and anhydrous sodium carbonate were purchased from Merck (Darmstadt, Germany). Ascorbic acid and ferric chloride (FeCl3) were purchased from Ajax Finechem (Seven Hills, Australia). Water was purified with a Milli-Q water purification system (Millipore, Bedford, USA). All other chemicals and solvents in this study were of analytical grade.
Sample extraction
Collected tea samples were ground and samples (5 g, weighed to the nearest
0.001g) were extracted with 100 mL of distilled water at 80 °C for 30 min
(Vuong et al., 2013). The extraction mixture was filtered through a filter paper (Whatman No. 4). The residue was washed with distilled water (3x10mL). The tea solution was cooled to room temperature and adjusted to 250 mL with distilled water. All samples were extracted in triplicate.
Determination of moisture content
Tea samples, 5 g, weighed to the nearest 0.001g, were placed in a moisture can
and heated in an oven at 103±2C for at least 16 h to constant weight. The
percentage of moisture content (%MC) and dry matter (%DM) in the samples were then calculated from the weight differences. All tests were performed in triplicate.
Determination of total polyphenol content (TPC)
The total polyphenol content (TPC) was determined by spectrophotometry, using gallic acid as a standard, according to the method described by the International Organization for Standardization (ISO 14502–1, 2005). Sample extracts were diluted 50-fold with distilled water and 1.0 mL portions of the diluted solution were transferred in duplicate to separate tubes containing 5.0 mL of 10%v/v dilution of Folin-Ciocalteu’s reagent in water. Then, 4.0 mL of sodium carbonate solution (7.5% w/v) was added with mixing. The tubes were then left to stand at room temperature for 60 min before absorbance at 765 nm was measured. The concentration of polyphenols in samples was derived from a standard curve of gallic acid ranging from 10-100 μg/mL. The TPC was expressed as gallic acid equivalents (GAE), i.e. GAE g/100 g dry weight (DW).
Determination of individual catechins, total catechins and caffeine
Individual catechins, total catechins content (TCC) and caffeine (CF) were determined by ISO method (ISO 14502–2, 2005) with slight modifications. The individual standard solutions of GC, EGC, C, EC, EGCG, GCG, ECG, CG and CF were prepared by dissolving them in methanol to generate a stock
concentration of 1,000 µg/mL. The mixed stock standard solution was prepared
by mixing an equal volume of each stock standard. Working standard solutions were prepared by dilution of the mixed stock solution and then filtered through a
0.45 µm polytetrafluoroethylene (PTFE) filter (Millipore Ltd., Bedford, USA.
HPLC analysis of standards and samples was conducted on Water 966 high performance liquid chromatography comprising vacuum degasser, quaternary pump, auto-sampler, thermostatted column compartment and photo diode array
detector. The column used was a Platinum EPS C18 reversed phase, 3µm (53x7
mm) with the column temperature of 30°C. Mobile phase was water/acetonitrile
(87:13) containing 0.05% (v/v) trifluoroacetic acid (TFA) with the flow rate of 2
mL/min. The injection volume was 20 µL. Absorption wavelength was 210 nm.
Validation was carried out in compliance with the AOAC International guidelines for single Lab. validation of chemical methods for dietary supplements and botanicals (AOAC, 2002). Individual catechins and caffeine were identified by comparing their retention times and UV spectra in the 190-400 nm range with standards. Calibration graphs were constructed using nine levels of concentration which covered the concentration ranges expected in the tea samples. The characteristics of the calibration curves, including the regression equation, correlation coefficient (r), range of linearity, limit of detection (LOD), limit of quantitation (LOQ) were determined. The LOD and LOQ were based on a signal-to-noise (S/N) ratio as 3:1 and 10:1, respectively. The linearity of the HPLC method was checked for caffeine and individual catechins (0.10-51.9, 0.09-43.1, 0.20-100.0, 0.19-97.0, 0.16-80.0, 0.20-100.0, 0.11-52.9, 0.20-98.0, 0.09-44.1
µg/mL for GC, EGC, C, EC, EGCG, CF, GCG, ECG and CG, respectively. All
the analytes exhibited good linearity (r) over the range tested with correlation coefficient from 0.9965 for GCG to 0.9997 for CF. Individual catechins and caffeine were quantified using calibration curves. The results were expressed as g/100 g DW. The total catechin content (TCC) as g/100 g DW was determined by
the summation of individual catechins (GC, EGC, C, EC, EGCG, GCG, ECG and CG).
Determination of DPPH radical scavenging activity (DPPH assay)
Tea extract was diluted (50-fold) with distilled water. The diluted tea extract (50
µL) was mixed with an aliquot of 2,000 µL of 60 µM DPPH radical in methanol.
Distilled water was used as a control instead of the extract. The reaction mixture was vortex-mixed and let to stand at 25C in the dark for 60 min. Absorbance at 517 nm was measured using methanol as a blank. The control and standard were subjected to the same procedures as the sample except that, for the control, only distilled water was added, and, for the standard, the extract was replaced with
0-1,000 µM Trolox standard. The percentage inhibition values were calculated
from the absorbance of the control (Ac) and of the sample (As). The calibration
curve was plotted between Trolox concentration (µM) and % inhibition. The
DPPH radical scavenging activity of tea sample was expressed in terms of millimole equivalents of Trolox (TE) per 100 grams of dry sample, i.e. mmol TE/100 g DW) (Roy etal., 2010) .
Determination of ferric reducing antioxidant power activity (FRAP assay)
A 1-mL aliquot of each extract (50-fold dilution) was mixed with 2.5 mL of phosphate buffer (0.2 M, pH 6.6) and 2.5 mL of a 1% aqueous potassium hexacyanoferrate [K3Fe(CN)6] solution. After 30 min incubation at 50C, 2.5 mL of 10% trichloroacetic acid were added, and the mixture was centrifuged for 10 min. A 2.5-mL aliquot of the upper layer was mixed with 2.5 mL of water and 0.5 mL of 0.1% aqueous FeCl3, and the absorbance was recorded at 700 nm. The control and standard were subjected to the same procedures as the sample except that, for the control, only distilled water was added, and, for the standard, the extract was replaced with 0-1,000 µM ascorbic acid standard. The calibration curve was plotted between ascorbic acid concentration (µM) and absorbance at 700 nm. Iron (III) reducing activity was determined as millimole equivalents of ascorbic acid (AA) per 100 grams of dry sample, i.e. mmol AA/100 g DW) (Hajimahmoodi et al., 2008).
Statistical analysis
Data were expressed as means ± standard deviation. The data were also subjected to analysis of variance (ANOVA) and Duncan’s multiple range tests using SPSS
16.0 for Windows. The significance level of P<0.05 was considered significantly different.
RESULTS AND DISCUSSION
Elution order of compounds analyzed by HPLC
G
C
A
B
C
EG
C
C
EC
EG
C
G
C
F
G
C
G EC
G
C
G
Figure 1 Typical chromatogram of standards (A), green teas from C. assamica
(B) and C. sinensis (C). Peak identification and approximate retention times in minutes in parentheses are as follows: GC (1.25); EGC (1.59); C (1.88); EC (2.56); EGCG (2.94); CF (3.40); GCG (4.36); ECG (5.81); and CG (8.71).
Chemical compositions and antioxidant capacities of green teas from C. assamica
Data on the caffeine content, total polyphenol content, total catechin content and antioxidant capacities (DPPH-assay and FRAP-assay) of the green teas produced from C. assamica are presented in Table 1. The caffeine content ranged from 3.27 to 3.71 g/100 g DW, with a mean of 3.44±0.51 g/100 g DW. There was no significant difference in caffeine content of all samples analyzed (P≥0.05). Total polyphenol content varied slightly, ranging from 16.63 to 20.83 GAE g/100 g
DW with an average of 18.95±1.45 GAE g/100 g DW. Among these teas, A
-GT-004 taken from Ming Dee Tea had the highest concentrations of phenolic substances, whereas A-GT-006 taken from Mae Ka Tea had the lowest concentrations. Catechins are the main phenolic compounds and are present in large amounts in green tea. In this study, total catechins varied slightly, ranging from 9.02 to 14.08 g/100 g DW with an average of 12.42±2.41 g/100 g DW.
There was no significant difference in total catechins in all samples (P≥0.05).
Among the 6 tested samples, the DPPH values ranged from 132.32 to 247.11
mmol TE/100 g DW, with a mean value of 183.90±46.68 mmol TE/100 g DW.
A-GT-001 collected from Raming Tea had the highest DPPH value (247.11±2.02 mmol TE/100 g DW), followed by A-GT-002 (240.56±4.77 mmol TE/100 g DW) collected from Choui Fong Tea. A-GT-006 collected from Mae Ka Tea had the lowest DPPH value (132.32±0.89 mmol TE/100 g DW). The FRAP values
ranged from 1.22 to 2.13 mmol AA/100 g DW, with a mean value of 1.66±0.32
mmol AA/100 g DW. A-GT-004 collected from Ming Dee Tea had the highest
FRAP value (2.13±0.06 mmol TE/100 g DW).
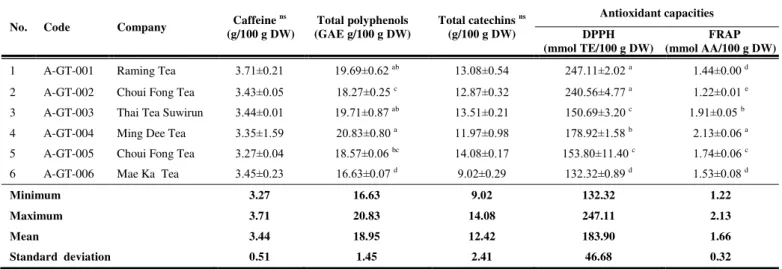
Table 1 Mean values of caffeine, total polyphenol, total catechin content and antioxidant capacities of 6 green teas produced from C. assamica
No. Code Company Caffeine
ns
(g/100 g DW)
Total polyphenols (GAE g/100 g DW)
Total catechins ns
(g/100 g DW)
Antioxidant capacities
DPPH (mmol TE/100 g DW)
FRAP (mmol AA/100 g DW)
1 A-GT-001 Raming Tea 3.71±0.21 19.69±0.62 ab 13.08±0.54 247.11±2.02 a 1.44±0.00 d
2 A-GT-002 Choui Fong Tea 3.43±0.05 18.27±0.25 c 12.87±0.32 240.56±4.77 a 1.22±0.01 e
3 A-GT-003 Thai Tea Suwirun 3.44±0.01 19.71±0.87 ab 13.51±0.21 150.69±3.20 c 1.91±0.05 b
4 A-GT-004 Ming Dee Tea 3.35±1.59 20.83±0.80 a 11.97±0.98 178.92±1.58 b 2.13±0.06 a
5 A-GT-005 Choui Fong Tea 3.27±0.04 18.57±0.06 bc 14.08±0.17 153.80±11.40 c 1.74±0.06 c
6 A-GT-006 Mae Ka Tea 3.45±0.23 16.63±0.07 d 9.02±0.29 132.32±0.89 d 1.53±0.08 d
Minimum 3.27 16.63 9.02 132.32 1.22
Maximum 3.71 20.83 14.08 247.11 2.13
Mean 3.44 18.95 12.42 183.90 1.66
Standard deviation 0.51 1.45 2.41 46.68 0.32
Values are expressed as means ± SD (n=3). Different letters in the same column indicate significant difference at p < 0.05.
ns = not significant.
Comparison of the individual catechins of 6 tea manufactures is shown in Table 2. Green teas produced from C. assamica contained GC, EGC, C, EC, EGCG, GCG and ECG. Surprisingly, CG was not detected in all tested samples. Among quantified catechins, ECG was predominant, ranging from 1.65 to 3.53 g/100 g
DW with an average of 2.94±0.78 g/100 g DW, followed byEGCG (ranging
from 1.16 to 3.69 with an average of 2.62±0.94 g/100 g DW), EC (ranging from
1.31 to 2.88 with an average of 2.23±0.60 g/100 g DW),EGC (ranging from 0.70
to 2.48 with an average of 1.77±0.61 g/100 g DW), C (ranging from 1.41 to 2.15
with an average of 1.65±0.38 g/100 g DW) and, to lesser extents, GC and GCG.
Table 2 Mean values of individual catechins present in 6 green teas produced from C. assamica
No. Code Company
Individual catechins (g/100 g DW)
GC ns EGC C ns EC EGCG GCG ns ECG
1 A-GT-001 Raming Tea 0.77±0.06 1.60±0.36 c 1.70±0.04 2.88±0.16 a 2.20±0.61 cd 0.39±0.08 3.53±0.14 a
2 A-GT-002 Choui Fong Tea 1.01±0.02 1.95±0.01 bc 1.51±0.03 2.29±0.05 ab 2.74±0.05 abc 0.48±0.04 2.90±0.14 ab
3 A-GT-003 Thai Tea Suwirun 0.89±0.11 1.70±0.20 bc 2.15±0.13 2.62±0.04 ab 2.44±0.16 bc 0.25±0.02 3.45±0.00 a
4 A-GT-004 Ming Dee Tea 0.99±0.56 2.16±0.19 ab 1.41±0.95 1.31±0.91 c 3.69±0.92 a 0.76±0.58 1.65±1.41 b
5 A-GT-005 Choui Fong Tea 0.96±0.03 2.48±0.02 a 1.61±0.01 2.39±0.02 ab 3.47±0.06 ab 0.34±0.02 2.84±0.04 ab
6 A-GT-006 Mae Ka Tea 0.39±0.03 0.70±0.01 d 1.53±0.05 1.87±0.01 ab 1.16±0.02 d 0.10±0.14 3.24±0.10 a
Minimum 0.39 0.70 1.41 1.31 1.16 0.10 1.65
Maximum 1.01 2.48 2.15 2.88 3.69 0.76 3.53
Mean 0.84 1.77 1.65 2.23 2.62 0.39 2.94
Standard deviation 0.28 0.61 0.38 0.60 0.94 0.28 0.78
Values are expressed as means ± SD (n=3). Different letters in the same column indicate significant difference at p < 0.05.
CG was not detected in any sample. ns = not significant.
Chemical compositions and antioxidant capacities of green tea from C. sinensis
Results of the caffeine content, total polyphenol content, total catechin content and antioxidant capacities of the green teas from C. sinensis are presented in Table 3. The caffeine ranged between 1.69 to 3.51 g/100 g DW with a mean of
2.50±0.71 g/100 g DW. This mean value was significantly lower than in C.assamica samples (P<0.05). Among 7 samples analyzed, O12-GT-007 taken from Doi Chang Tea had the highest concentrations of caffeine, whereas O12-GT-004 taken from Sing Long Shop had the lowest concentrations than other samples. Total polyphenols varied from 11.52 to 17.34 GAE g/100 g DW with an
average of 14.58±1.87 GAE g/100 g DW. This value was significantly lower than
in C.assamica samples (P<0.05). Total catechins ranged from 8.32 to 13.20 g/100
g DW with an average of 10.86±1.47 g/100 g DW. This value was not
significantly different from C.assamica samples (P≥0.05). Among 7 samples
analyzed, there were significant differences in total polyphenols and total
catechins (P<0.05), in which the highest total polyphenols (17.34±0.29 GAE g/100 g DW) and total catechins (13.19±0.32 g/100 g DW) were found in the
OT-GT-003 sample taken from Jing Jing Tea shop. Among the tested samples, the DPPH values ranged from 80.08 to 241.39 mmol TE/100 g DW, with a mean
value of 146.97±56.40 mmol TE/100 g DW. O12-GT-007 collected from Doi
Chang Tea had the highest DPPH value (241.39±0.71 mmol TE/100 g DW). The
FRAP values ranged from 0.61 to 1.08 mmol AA/100 g DW, with a mean value
of 0.85±0.16 mmol AA/100 g DW. O12-GT-003 collected from Jing Jing Tea
shop had the highest FRAP value (1.08±0.17 mmol AA/100 g DW).
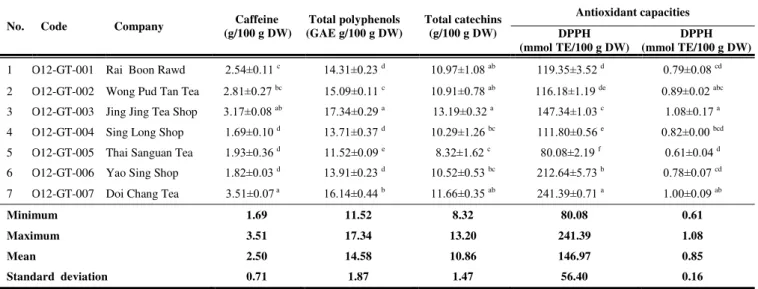
Table 3 Mean values of caffeine, total polyphenol and total catechin content and antioxidant capacities of 7 green teas produced from C. sinensis
No. Code Company Caffeine
(g/100 g DW)
Total polyphenols (GAE g/100 g DW)
Total catechins (g/100 g DW)
Antioxidant capacities
DPPH (mmol TE/100 g DW)
DPPH (mmol TE/100 g DW)
1 O12-GT-001 Rai Boon Rawd 2.54±0.11 c 14.31±0.23 d 10.97±1.08 ab 119.35±3.52 d 0.79±0.08 cd
2 O12-GT-002 Wong Pud Tan Tea 2.81±0.27 bc 15.09±0.11 c 10.91±0.78 ab 116.18±1.19 de 0.89±0.02 abc
3 O12-GT-003 Jing Jing Tea Shop 3.17±0.08 ab 17.34±0.29 a 13.19±0.32 a 147.34±1.03 c 1.08±0.17 a
4 O12-GT-004 Sing Long Shop 1.69±0.10 d 13.71±0.37 d 10.29±1.26 bc 111.80±0.56 e 0.82±0.00 bcd
5 O12-GT-005 Thai Sanguan Tea 1.93±0.36 d 11.52±0.09 e 8.32±1.62 c 80.08±2.19 f 0.61±0.04 d
6 O12-GT-006 Yao Sing Shop 1.82±0.03 d 13.91±0.23 d 10.52±0.53 bc 212.64±5.73 b 0.78±0.07 cd
7 O12-GT-007 Doi Chang Tea 3.51±0.07 a 16.14±0.44 b 11.66±0.35 ab 241.39±0.71 a 1.00±0.09 ab
Minimum 1.69 11.52 8.32 80.08 0.61
Maximum 3.51 17.34 13.20 241.39 1.08
Mean 2.50 14.58 10.86 146.97 0.85
Standard deviation 0.71 1.87 1.47 56.40 0.16
Values are expressed as means ± SD (n=3). Different letters in the same column indicate significant difference at p < 0.05.
ns = not significant.
Comparison of the individual catechins of 7 tea manufactures is shown in Table 4. Green teas produced from C. sinensis contained 7 catechins as found in C. assamica. CG was again not detected in any sample. Among quantified catechins, the most abundant catechin was EGCG. The EGCG ranged from 2.75 to 5.49
with an average of 3.99±0.92 g/100 g DW, Among samples analyzed, O12
-GT-003 taken from Jing Jing Tea Shop had the highest concentrations of EGCG
(5.49±0.29 g/100 g DW), followed by O12-GT-007 taken from Doi Chang Tea
(4.62±0.30 g/100 g DW). The second most abundant catechin was EGC, ranging
from 2.17 to 3.18 with an average of 2.75±0.48 g/100 g DW. There was no
significant difference in EGC among samples analyzed. The remaining catechins,
GC (0.94±0.14 g/100 g DW), C (0.83±0.17 g/100 g DW), EC (0.92±0.14 g/100 g DW), GCG (0.65±0.23 g/100 g DW), and ECG (0.77±0.29 g/100 g DW), were
Table 4 Mean values of individual catechins present in 7 green teas produced from C. sinensis
No. Code Company
Individual catechins (g/100 g DW)
GC EGC ns C EC EGCG GCG ECG
1 O12-GT-001 Rai Boon Rawd 1.13±0.04 a 2.87±0.41 0.90±0.02 ab 0.95±0.07 b 3.74±0.61 bc 0.76±0.18 b 0.63±0.01 c
2 O12-GT-002 Wong Pud Tan Tea 0.91±0.04 bc 2.95±0.18 0.87±0.14 bc 0.91±0.08 bc 4.01±0.27 bc 0.51±0.10 bc 0.78±0.06 b
3 O12-GT-003 Jing Jing Tea Shop 0.91±0.03 bc 2.41±0.13 1.04±0.01 a 1.09±0.01 a 5.49±0.29 a 1.06±0.11 a 1.19±0.04 a
4 O12-GT-004 Sing Long Shop 1.08±0.05 a 3.18±0.56 0.64±0.03 d 0.80±0.01 cd 3.50±0.63 bc 0.60±0.12 bc 0.52±0.03 cd
5 O12-GT-005 Thai Sanguan Tea 0.99±0.05 ab 2.17±0.63 0.64±0.01 d 0.70±0.01 d 2.75±0.85 c 0.66±0.10 b 0.41±0.06 d
6 O12-GT-006 Yao Sing Shop 0.80±0.01 cd 3.16±0.22 0.72±0.04 cd 0.91±0.04 bc 3.83±0.34 bc 0.36±0.06 c 0.76±0.01 b
7 O12-GT-007 Doi Chang Tea 0.74±0.14 d 2.50±0.40 1.03±0.07 a 1.09±0.08 a 4.62±0.30 ab 0.58±0.01 bc 1.12±0.06 a
Minimum 0.74 2.17 0.64 0.70 2.75 0.36 0.41
Maximum 1.13 3.18 1.04 1.09 5.49 1.06 1.19
Mean 0.94 2.75 0.83 0.92 3.99 0.65 0.77
Standard deviation 0.14 0.48 0.17 0.14 0.92 0.23 0.29
Values are expressed as means ± SD (n=3). Different letters in the same column indicate significant difference at p < 0.05.
CG was not detected in any sample. ns = not significant.
Comparison of green teas from C. assamica and C. sinensis
The chemical compositions and antioxidant capacities of green teas produced from C. assamica and C.sinensis are shown in Table 5. The caffeine of the
Assam cultivar (3.44±0.51 g/100 g DW) was significantly higher than the
Chinese cultivar (2.50 ±0.71 g/100 g DW). Obuchowicz et al (Obuchowicz et
al., 2011) reported that caffeine content in green tea was 1.44-4.03 g/100 g DW (average 2.60, n=287). Our values are in the range of previous reports. The comparison between the Assam and the Chinese cultivars indicated that cultivars affected the level of caffeine in green teas. However, there have been reports that there was no significant difference in the caffeine contents of tea infusions brewed from these two varieties (Suteerapataranon et al., 2009). This might be because this study used only one tea sample and taken from a manufacturer who cultivated the variety assamica in the area near to the variety sinensis, indicating that cultivation areas may also affect the caffeine content. It is suggested that the determinations of the chemical profile of teas should follow sampling protocols that include tea samples from various sources and manufacturers.
Phenolic compounds are a class of chemical constituents containing one or more hydroxyl residues attached to an aromatic (phenyl) ring. They are one of the most effective antioxidative constituents that contribute to the antioxidant capacities of teas. Hence, it is important to quantify phenolic content and to assess its contribution to antioxidant activity. Green tea from the Assam cultivar
(18.95±1.45 GAE g/100 g DW) had levels of total polyphenols significantly (p<0.05) higher than the Chinese cultivar (14.58±1.87 GAE g/100 g DW). This
result is in agreement with Jin et al. (Jin et al., 2005) who reported that the Assam cultivar had significantly higher polyphenols content than the Chinese cultivar. Previous reports have stated that the total polyphenols in green tea was 9.95-25.79 GAE g/100 g DW (average 16.35, n=347) (Obuchowicz et al., 2011), 10.10-22.20 GAE g/100 g DW (average 17.00, n=51) (Engelhardt 2005), 8.70-10.60 GAE g/100 g DW (average 8.63, n=3) (Khokhar and Magnusdottir 2002). Our results are in reasonable agreement with these previous reports. The levels of total catechins in the Assam and the Chinese cultivars were
12.42±2.41 g/100 g DW and 10.86±1.47 g/100 g DW, respectively. This result is
in accordance with mean values obtained in previous studies, 6.57-21.38 g/100 g DW (average 11.70, n=358) (Obuchowicz et al., 2011), 8.50-20.60 g/100 g DW (average 15.10, n=51) (Engelhardt 2005) and 2.80-22.80 g/100 g DW (average 10.90, n=18) (Unachukwu et al., 2010). There were no significant differences in total catechins of green teas from these two varieties. Among 8 catechins analyzed in two varieties, CG was not detected and GC was in a similar level in both tea types. The levels of the EGC, C, EC, EGCG, GCG and ECG showed apparently significant differences (p<0.05). The ECG (2.94±0.78 g/100 g DW),
EGCG (2.62±0.94 g/100 g DW), and EC (2.23±0.60 g/100 g DW), were the 3
predominant catechins in the Assam cultivar, whereas the EGCG (3.99±0.92
g/100 g DW), and EGC (2.75±0.48 g/100 g DW), were the 2 predominant
catechins in the Chinese cultivar. The four major catechins present in green tea were reported as EGCG, EGC, ECG, and EC (Peterson et al., 2005; Ananingsih
et al., 2013; Obuchowicz et al., 2011). According to the study by Obuchowicz
et al., (2011), the greatest amount of individual catechins in green teas was EGCG followed by EGC, which is similar to our result with the Chinese cultivar. Most studies of individual catechins in green teas have been carried out on the Chinese tea. This may be because the Chinese tea is usually used to produce green teas. There are a few countries that grow both the Assam and the Chinese tea in order to process as the green tea. Therefore, most data on individual catechins in green teas is obtained from the Chinese cultivar. Khokhar and Magnusdottir (2002) had cited variations in the abundance of compounds in
teas as being dependent on sample tea subtypes and the different subtypes result from different tea processing protocols, horticultural practices, and geographic settings (Sultana et al., 2008).
The radical scavenging capacity and reducing power capacity of a sample is regarded as a significant indicator of its potential antioxidant activity. FRAP measures the ability of compounds to act as an electron donor while DPPH measures their ability to act as hydrogen donors. In DPPH assays, the antioxidant capacity of the Assam cultivar was slightly higher than the Chinese cultivar. However, no significant differences between cultivars were found with the Duncan test. Although the Assam cultivar had the total polyphenols significantly higher than the Chinese cultivar, both cultivars had the same level of radical scavenging capacity (DPPH). This is likely due to the presence of different antioxidant compounds in green teas. As opposed to the radical scavenging capacity, there was a significant difference in the reducing power capacity (FRAP) (P<0.05). The FRAP of the Assam was substantially higher than the Chinese (P<0.05). According to a study by Stewart et al., (2005), the greatest antioxidant contribution to green tea comes from catechins. The different result in the DPPH and the FRAP found in this study can be demonstrated by the difference in mechanisms between the scavenging and chelating for measuring the antioxidant capacity. The antioxidant capacity of tea may not be determined by one or few phytochemical compounds, but is widely distributed among a range of phenolic compounds including catechins (Horzic et al., 2009) and additional antioxidant compounds such as glycosylated flavonols, proanthocyanidins, and phenolic acids and their derivatives (Lin et al., 2008) in green tea as evidenced by higher TPC levels in the Assam tea.
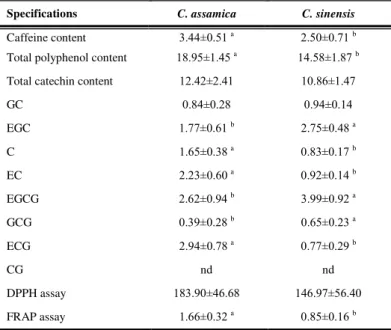
Table 5 Comparison of green teas produced from C. assamica and C. sinensis
Specifications C. assamica C. sinensis
Caffeine content 3.44±0.51 a 2.50±0.71 b
Total polyphenol content 18.95±1.45 a 14.58±1.87 b
Total catechin content 12.42±2.41 10.86±1.47
GC 0.84±0.28 0.94±0.14
EGC 1.77±0.61 b 2.75±0.48 a
C 1.65±0.38 a 0.83±0.17 b
EC 2.23±0.60 a 0.92±0.14 b
EGCG 2.62±0.94 b 3.99±0.92 a
GCG 0.39±0.28 b 0.65±0.23 a
ECG 2.94±0.78 a 0.77±0.29 b
CG nd nd
DPPH assay 183.90±46.68 146.97±56.40
FRAP assay 1.66±0.32 a 0.85±0.16 b
Values are expressed as means ± SD.
As found in this study, the difference in chemical constituents and antioxidant capacities might be related to the cultivars. Thus our hypothesis is that the pattern displayed by catechins enables and observer who is given a tea extract, but is not told from which tea species the extract was prepared, to determine this with reasonable confidence purely from analyzing the pattern displayed by these compounds. At present, the data do not enable a decision as to whether this is just true for the region where the work was performed, or if is generally applicable. The challenge is therefore to tea scientists in other geographical regions where teas are produced comparable to those studied here, to determine if their regional products are classifiable by the same criteria, and by their results to verify or falsify this hypothesis as something processing general applicability.
It also should be noted that these differences could be related to the quality of tea grown in different regions having their soil and climatic conditions different, cultivation practices, post-harvesting handling and processing techniques by different manufacturers. Because health effects may depend on the tea consumed and because there is a lack of composition data on tea produced in different parts of the world, there is a need to know the compositions. Our results provide information that the consumer may be able to select green teas containing high levels of beneficial compounds and avoid those containing low amounts of these compounds.
CONCLUSION
This study provides evidence of the dependability of amounts of compounds and antioxidant capacities in green tea manufactured in Thailand. Present findings show that green tea from the Assam cultivar had caffeine and total polyphenols levels significantly higher than the Chinese cultivar. The ECG, EGCG and EC were the 3 predominantcatechins in the Assam cultivar, whereas the EGCG and EGC were the 2 predominant catechins in the Chinese cultivar. The difference in catechins found in this study might be related to the cultivars used to produce green teas. The results reported here were derived from the analysis of samples collected from representative tea manufacturing establishments in Thailand. It is well recognized that uncontrolled variables, such as the geography, climates, season, cultivation practice, postharvest handling and processing techniques may affect the chemical composition and antioxidant capacities of green teas. However, this investigation provides basic information on important chemical compounds present in Thai green tea, which can be added to the national and regional databases. The data can also be used as a guideline for establishing tea standards and for further detailed studies.
Acknowledgments: The authors warmly thank Mae Fah Luang University for a support.
REFERENCES
ANANINGSIH, V. K., SHARMA, A., ZHOU, W. 2013. Green tea catechins during food processing and storage: A review on stability and detection. Food Research International, 50(2), 469-479.
AOAC. (2002). Guidelines for single laboratory validation of chemical methods for dietary supplements and botanicals. Gaithersburg, Md.: AOAC Int. Available from: http://swww.aoac.org/dietsupp6/Dietary-Supplement-web-site/slv_guidelines.pdf. Accessed Nov 30, 2011.
COOPER, R., MORRE, J., MORRE, D. M. 2005. Medicinal benefits of green tea: Part II. Review of anticancer properties. Journal of Alternative and Complementary Medicine, 11(4), 639-652.
ENGELHARDT, U. H. 2005. Authenticity of tea (C. sinensis) and tea products.
Abstracts of Papers of the American Chemical Society, 229, U40-U40.
FIORINO, P., EVANGELISTA, F. S., SANTOS, F., MAGRI, F. M. M., Delorenzi, J. C. M. O. B., Ginoza, M., Farah, V. 2012. The Effects of Green Tea Consumption on Cardiometabolic Alterations Induced by Experimental Diabetes.
Experimental Diabetes Research.
HAJIMAHMOODI, M., HANIFEH, M., OVEISI, M. R., SADEHHI, N., Jannat, B. 2008. Determination of total antioxidant capacity of green teas by the ferric reducing/antioxidant power assay. Iranian Journal of Environmental Health Science & Engineering, 5(3), 167-172.
HIGDON, J. V., FREI, B. 2003. Tea catechins and polyphenols: Health effects, metabolism, and antioxidant functions. Critical Reviews in Food Science and Nutrition, 43(1), 89-143.
HORZIC, D., KOME, D., BELSCAK, A., GANIC, K. K., IVEKOVIC, D., KARLOVIC, D. 2009. The composition of polyphenols and methylxanthines in teas and herbal infusions. Food Chemistry, 115(2), 441-448.
ISO 14502–1. 2005. Tea; Methods for determination of substances characteristic of green and black tea. Part 1, Content of total polyphenols in tea: colorimetric method using Folin–Ciocalteu reagent.
ISO 14502–2. 2005. Tea; Methods for determination of substances characteristic of green and black tea. Part 2. Contents of catechins in green tea: method using High Performance Liquid Chromatography.
JIN, C., WANG, P. S., XIA, Y. M., XU, M., PEI, S. J.. 2005. Genetic diversity and differentiation of Camellia sinensis L. (cultivated tea) and its wild relatives in
Yunnan province of China, revealed by morphology, biochemistry and allozyme studies. Genetic Resources and Crop Evolution, 52(1), 41-52.
KHAN, N., ADHAMI, V. M., MUKHTAR, H. 2009. Review: Green Tea Polyphenols in Chemoprevention of Prostate Cancer: Preclinical and Clinical Studies. Nutrition and Cancer-an International Journal, 61(6), 836-841. KHOKHAR, S., MAGNUSDOTTIR, S. G. M. 2002. Total phenol, catechin, and caffeine contents of teas commonly consumed in the United Kingdom. Journal of Agricultural and Food Chemistry, 50(3), 565-570.
LI, Q., LIU, Z. H., HUANG, J. A., LUO, G. A., LIAN, Q. L., WANG, D., YE, X. Y., WU, C. B., WANG, L. L., HU, J. H.2013. Anti-obesity and hypolipidemic effects of Fuzhuan brick tea water extract in high-fat diet-induced obese rats.
Journal of the Science of Food and Agriculture, 93(6), 1310-1316.
LIN, L. Z., CHEN, P., HARNLY, J. M. 2008. New phenolic components and chromatographic profiles of green and fermented teas. Journal of Agricultural and Food Chemistry, 56(17), 8130-8140.
LIN, Y. S., TSAI, Y. J., TSAY, J. S., Lin, J. K. 2003. Factors affecting the levels of tea polyphenols and caffeine in tea leaves. Journal of Agricultural and Food Chemistry, 51(7), 1864-1873.
MCKAY, D. L., BLUMBERG, J. B. 2002. The role of tea in human health: An update. Journal of the American College of Nutrition, 21(1), 1-13.
OBUCHOWICZ, J., ENGELHARDT, U. H., DONNELLY, K. 2011. Flavanol database for green and black teas utilising ISO 14502-1 and ISO 14502-2 as analytical tools. Journal of Food Composition and Analysis, 24(3), 411-417. OWUOR, P. O.,OBANDA, M., NYRENDA, H. E., MANDALA, W. L. 2008. Influence of region of production on clonal black tea chemical characteristics.
Food Chemistry, 108(1), 263-271.
OWUOR, P. O., OBANDA, M., NYRENDA, H. E., MPHANGWE, N. I. K., WRIGHT, L. P., APOSTOLIDE, Z. 2006. The relationship between some chemical parameters and sensory evaluations for plain black tea (Camellia sinensis) produced in Kenya and comparison with similar teas from Malawi and South Africa. Food Chemistry, 97(4), 644-653.
PETERSON, J., DWYER, J., BHAGWAT, S., HAYTOWITZ, D., HOLDEN, J., ELDRIDGE, A. L., BEECHER, G., Aladesanmi, J.. 2005. Major flavonoids in dry tea. Journal of Food Composition and Analysis, 18(6), 487-501.
PRIPDEEVECH, P., MACHAN, T. 2011. Fingerprint of volatile flavour constituents and antioxidant activities of teas from Thailand. Food Chemistry,
125(2), 797-802.
ROY, M. K., KOIDE M., RAO, T. P., OKUBO, T., OGASAWARA, Y., JUNEJ, L. R.. 2010. ORAC and DPPH assay comparison to assess antioxidant capacity of tea infusions: Relationship between total polyphenol and individual catechin content. International Journal of Food Sciences and Nutrition, 61(2), 109-124. SHUKLA, Y. 2007. Tea and cancer chemoprevention: A comprehensive review.
Asian Pacific Journal of Cancer Prevention, 8(2), 155-166.
STEWART, A. J., MULLEN, W., CROZIER, A. 2005. On-line high-performance liquid chromatography analysis of the antioxidant activity of phenolic compounds in green and black tea. Molecular Nutrition & Food Research, 49(1), 52-60.
SULTANA, T., STECHER, G., MAYER, R., TROJER, L., QURESHI, M. N., ABEL, G., POPP, M., BONN, G. K.. 2008. Quality assessment and quantitative analysis of flavonoids from tea samples of different origins by HPLC-DAD-ESI-MS. Journal of Agricultural and Food Chemistry, 56(10), 3444-3453.
SUTEERAPATARANON, S., BUTSOONGNERN, J., PUNTURAT, P., JORPALIT, W., THANOMSIL, C. 2009. Caffeine in Chiang Rai tea infusions: Effects of tea variety, type, leaf form, and infusion conditions. Food Chemistry,
114(4), 1335-1338.
TRUDEL, D., LABVBE, D. P., BAIRATI, I., FRADET, V., BAZINET, L.,TETU, B. 2012. Green tea for ovarian cancer prevention and treatment: A systematic review of the in vitro, in vivo and epidemiological studies.
Gynecologic Oncology, 126(3), 491-498.
UEDA, M., ASHIDA, H. 2012. Green Tea Prevents Obesity by Increasing Expression of Insulin-like Growth Factor Binding Protein-1 in Adipose Tissue of High-Fat Diet-Fed Mice. Journal of Agricultural and Food Chemistry, 60(36), 8917-8923.
UNACHUKWU, U. J., AHMED, S., KAVALIER, A., LYLES J. T., KENNELLY, E. J. 2010. White and Green Teas (Camellia sinensis var. sinensis): Variation in Phenolic, Methylxanthine, and Antioxidant Profiles. Journal of Food Science, 75(6), C541-C548.
VUONG, Q. V., GOLDING, J. B., STATHOPOULOS, C. E., Roach, P. D. 2013. Effects of aqueous brewing solution pH on the extraction of the major green tea constituents. Food Research International, 53(2), 713-719.