Mathematical Risk Analysis:
via Nicholas Risk Model
and Bayesian Analysis
Anass BAYAGA
University of Fort Hare (East London South Africa)
În articol se prezintă rezultatele explorării puterii predictive a metodei analizei riscului cantitativ şi procesul desfăşurat în cadrul in-stitutului de învăţământ superior. S-a efectuat analiza de impact asupra utilizării prin metoda de risc şi analiza bayesiană, cu un eşantion de 100 de analişti la o universitate din Africa de Sud. Primele constatări au
con-fi rmat previziunile, existând o relaţie directă între factorul de risc, proba-bilitatea sa şi impactul certiris paribus. A doua constatare este legată fi e de controlul probabilităţii sau impactul apariţiei riscului (Modelul de risc Nicholas). Potrivit analizei bayesiană, prin a treia constatare, impactul de risc poate fi prezis după următoarele aspecte: Impactul uman (deciziile lu-ate), Impactul proprietăţii (studenţii şi infrastructura) şi Impactul afacer-ilor. A rezultat că, deşi în multe cazuri de afaceri unde ciclurile de afaceri variază mult depinzând de industrie sau instituţie, majoritatea impact-elor în universitate au avut loc în perioada academică. Recomandarea a fost ca aplicarea analizei riscului cantitativ săfi e legată de cadrul legisla-tiv curent care se referă la activitatea universitară.
ABSTRACT
The objective of this second part of a two-phased study was to ex-plore the predictive power of quantitative risk analysis (QRA) method and process within Higher Education Institution (HEI). The method and process investigated the use impact analysis via Nicholas risk model and Bayesian analysis, with a sample of hundred (100) risk analysts in a historically black South African University in the greater Eastern Cape Province.
certiris paribus. The second fi nding in relation to either controlling the like-lihood or the impact of occurrence of risk (Nicholas risk model) was that to have a brighter risk reward, it was important to control the likelihood of occurrence of risks as compared with its impact so to have a direct effect on entire University. On the Bayesian analysis, thus third fi nding, the impact of risk should be predicted along three aspects. These aspects included the hu-man impact (decisions made), the property impact (students and infrastruc-tural based) and the business impact. Lastly, the study revealed that although in most business cases, where as business cycles considerably vary depending on the industry and or the institution, this study revealed that, most impacts in HEI (University) was within the period of one academic.
The recommendation was that application of quantitative risk anal-ysis should be related to current legislative framework that affects HEI.
Keywords: Quantitative Risk Analysis, Nicholas risk model, Bayesian analysis, Risk modeling.
1. Background of Study
From consulting studies (Basel II 2009; Sarbanes-Oxley Act of, 200; CoBiT, 2007; Morgan, 1996; Standard and Poor, 2006) proposing recipes for quantitative risk analysis (QRA) to academic research (Stoney, 2007; Higher Education Quality Committee, 2004; Krishnan, 2004, Nicholas, 2004; My-ers, Myers and Omer, 2003, Higher Education funding Council for England-HEFCE, 2001), literature in QRA is still frequently based on an implicit as-sumption of stability (subjective reasoning) view of risk analysis. Researchers such as COSO (2004), Morgan (1993), Power (2004), and Nicholas and Styen (2008) have challenged the view of a rational and subjective risk analysis. The view for some authors (Committee of Sponsoring Organisations-COSO, 2004; Morgan, 1993) suggests that QRA has achieved the status of an exact science (physical science), implying that prediction and replicability are seen possible. However, for quantitative analysts, QRA is not always a straightfor-ward endeavour. Suggesting that prediction is diffi cult prediction and risky.
Van Gelderen, Thurik and Bosma (2006) argued that many QRA methods and process are neither universal nor time-relevant. The authors maintain that on one hand, their external validity is frequently questionable. Van Gelderen et al. (2006) lament that such practices cannot be easily adapted from one organisation to the other, which they (authors) suggested needs con-stant and further investigation.
can not be easily found elsewhere such as a University. This view resonates with that of Nicholas and Styen (2008), who noted that normally, impact analyses are derived from past experiences and conditions which would be rarely the same in the future.
In view of the above contestation in QRA, a paradigmatic shift was necessary to reconcile apparently divergent approaches (objective and subjec-tive) to QRA most particularly. The science of QRA provides a new paradigm where two apparently irreconcilable visions of QRA and subjective model of risk can be reconciled.
The attention of QRA was partly triggered by the Markowitz (1957) on “Portfolio Selection” in the mathematical fi nance (cd. Phase I). Markowitz (1957) showed that a simple deterministic model (variance or standard deviation), under certain conditions, was able to compute risk behaviours as complex as those ob-served in nature. Later QRA work, as discussed by Morgan (1996) and Balbas (2007) confi rmed Markowitz (1957)assertion that risk is quantifi able; QRA could, therefore, lead to risk management. Economists soon followed with works in mac-roeconomics and fi nance as surveyed by Markowitz (1957) andMcNeil, Frey and Embrechts (2005) illustrated. Since economic data seem random, a logical step as proposed by Nicholas (2004:313) was to test the relationship between risk con-sequence, as a function of likelihood and impact of occurrence of risk. This was consistent with the objective of this second phase in South African context.
Universities in South Africa as noted by King III report (2009) have not yet given full attention to QRA. Apart from the works of Higher Education Quality Committee-HEQC on University programme accreditation, and King III report (2009) on corporate governance and other international literature such as Stoney (2007) on quality risk management as well as HEFEC (2001) on general risk management strategies, the literature is still rather sparse and does not always provide insights on what institutions could infer from meth-ods and processes of impact analysis and for that matter QRA.
However, during these last 30 years, interest in these systems has grown among researchers of different scientifi c fi elds such as physics, chem-istry, psychology and mathematical fi nance (fi nancial engineering and the de-rivative1 markets). Interest has been mainly stimulated by QRA capabilities in representing risk by using mathematical and statistical models which was perceived as subjective.
evi-dence discussed by recent studies (King III report, 2009: Stoney, 2007: HEQC, 2004: HEFCE, 2001), it seems reasonable to hypothesised that a University is also subject to relatively risky factors (cf. phase I), which follow various peri-odic patterns, which may follow mathematical and statistical rules. Consistent with the proposition that a social entity such as a University somewhat follows periodic patterns which may contain the seeds of deterministic rules. This leads to the setting of an objective for the paper.
Research Objectives
Following the above proposition in the conclusive remark of the above, the main objective of the paper was to:
Main Objective
Interrogate the predictive power QRA models have within Higher Education Institutions (HEI).
Sub-Objective
To demonstrate mathematical treatment of risk via 1. Nicholas risk model
2. Bayesian analysis
2. METHODOLOGY
Recall that the methodology (sampling technique, reliability of instrument) followed that of phase I, with the exception of logistic regression analysis. The other difference though pertained to the method and process (quantifi cation of risk). Phase II addressed the methods and process of quantitative impact analysis (Nicholas risk model and Bayesian analysis), where as phase I dealt with quantitative likelihood of occurrence of risk.
2.1 Method and process of quantitative impact analysis
Risk consequence = Likelihood of occurrence of risk X Impact of
occurrence of risk (1)
2.2 Mathematical treatment of risk in social phenomenon Nicholas and Steyn (2008) argued that in conducting an impact analysis, consideration should be given to the advantages and disadvantages of quantitative versus qualitative risk analysis (in social phenomenon such as a University). In this research though, the main advantage of the qualitative impact analysis was that it prioritised the risks and identifi ed areas for immediate improvement in addressing the risks. The disadvantage of the qualitative analysis however, was that it did not provide specifi c quantifi able measurements of the magnitude of the impacts, therefore making an impact benefi t analysis of any recommended controls diffi cult as suggested that by Nicholas (2004).
For the above demerit of qualitative analysis, the research capitalised on the advantage of a quantitative impact analysis2 as it provided a measurement of the impacts’ magnitude, which was used in the implication of impact analysis. Nonetheless, the disadvantage was that depending on the numerical ranges used to express the measurement, the meaning of the quantitative impact analysis was unclear, requiring the result to be interpreted in a qualitative manner. For this reason also, to clarify the above, data from the interviews were used. The next section describes the results of the study.
3. RESULTS AND DISCUSSION OF FINDINGS
With reference to the main objective of the paper, the section addressed two key issues: the fi rst was analysis of impact of occurrence of risk. The second addressed decision making of risk consequence. This latter one was further divided into (a) standard of measure indexes, explaining Nicholas risk model and (b) Bayesian analysis of risks.
3.1 Analysis of impact of occurrence of risk
Recall that the presentation of data in phase I revealed the likelihood of occurrence of risk associated with various variables set forth in preliminary quantifi cation of risk. It is important to note that defi nition of risk (cf. section 2.1 in phase II) is a function of the likelihood and impact of occurrence of risk3. Thus, in quantifying risk, an analyst identifi es the likelihood together with the impact of the risk to be able to understand and appreciate the severity of the risk should the risk happen/occur. In the following data presentation, the section revealed various variables associated with the impact of risk.
for such likelihood of occurrence- then what is the impact of the event should the event occur? Consistent with the above question, which resonates with the sub-question (b), this section discusses below the impact of risk of occurrence of various indexes.
The fi rst variable investigated was the impact of occurrence of risk associated 3rd stream income (cf. table 3.1). Table 3.1 revealed that nearly two-thirds (68.8%) agreed that typically, the impact was certain once a year. Comparatively, this impact and its likelihood of occurrence (cf. phase I) simultaneously happen in one academic year. About a fourth (20.3%) asserted that the impact is signifi cant but, its occurrence is on average quarterly. Although, there were varying fi gures for the impact in once in three years, once in one month and week, these fi gures marginal were not wide as measured by the percentages in table 3.1.
What impact of occurrence of risk is associated with below target of 3rd stream income?
Table 3.1
Frequency
Percent (%)
Insigni
fi
cant -Remote
possibility (once every 3 years)
2
3.1
Minor- Could happen but
rare (typically once a year)
44
68.8
Moderate- Could happen
occasionally (on average
quarterly)
13
20.3
Signi
fi
cant- Could happen
often (on average once a
month)
3
4.7
Major- Could happen
frequently (once a week or
more)
2
3.1
Total
64
100.0
impact in three years, once a month and a week were not of major concern as measured by the percentage of response. In the case of the impact of occurrence of risk associated teaching staff and academic staff in university, the responses were somewhat worrying. This was because, while in one academic year the impact of occurrence was 42.2%, in contrast, majority (46.9%) alluded that the impact of the risk of not meeting the target of academic staff in research was quarterly.
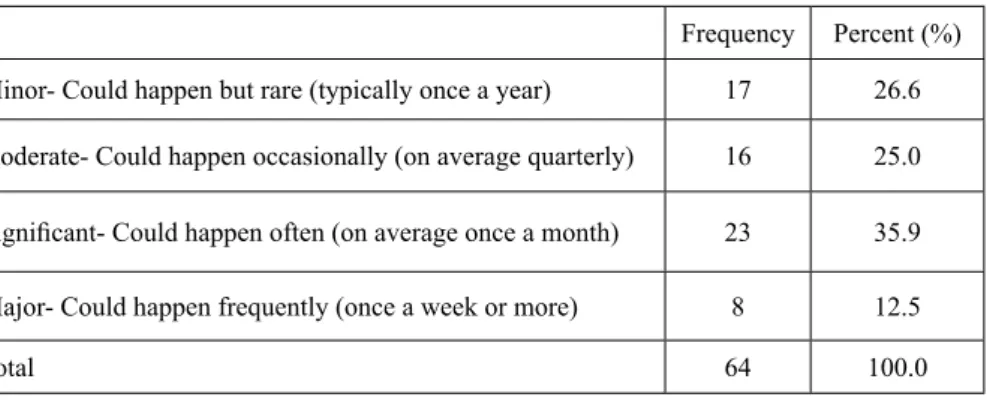
Where, as there were crystal clear disparities as shown in the above variables, there was no such wide gap in terms of the impact of occurrence of risk associated with below target of allocation of infrastructure. Table 3.2 shows that neighborhood of a quarter (26.6%) noted that the impact was within once in an academic year. While, another quarter noted that the impact could occur on average once quarterly. Thus, as a matter of concern, it is important the University evaluates allocation of infrastructure to enhance the life of infrastructural base. Amongst the responses provided in table 3.2, the popular response was the occurrence within a period of once a month, which invariably poses a matter of concern to the institution. Amongst other things, these infrastructures include buildings, computers, library resources and laboratory equipment.
Infrastructure in this study was defi ned as the University’s’ physical assets that are capable of an intended service delivery, and which comprise of rigid assets such as the built environment including buildings, library, lecture hall, residences, computer and laboratory facilities that relate to the University services. From the above, infrastructure risk is approached from the point of view that it is principally concerned with undesired events, and is tied to the prospect of being a threat.
Defi ning infrastructure risk is complicated by the fact that it could be decomposed into two; likelihood and impact. Sala, a respondent, is quoted to have supported this view by claiming that
…when a risk is even considered from the perspective of likelihood, the decision as to whether it would be construed to be a threat depends on how likely the occurrence of the event would be.
ranging from identifi cation of internal and external sources of risk impacts, through to hazards and risk analysis, monitoring, modeling and prediction, risk mitigation and consequence recovery. Such a holistic approach to a vulnerability assessment of critical infrastructure could be important.
The impact of occurrence of risk associated with below target of allocation of infrastructure
Table 3.2
Frequency Percent (%)
Minor- Could happen but rare (typically once a year) 17 26.6
moderate- Could happen occasionally (on average quarterly) 16 25.0
Signifi cant- Could happen often (on average once a month) 23 35.9
Major- Could happen frequently (once a week or more) 8 12.5
Total 64 100.0
Another risk factor under consideration was qualifi cations of academics. In relation to teaching staff with masters and doctoral degrees, majority (79.7%) noted that this was not a matter of concern as per the impact of occurrence of risk associated with it. This index suggested that there was relatively low risk impact in relation to that variable as evidence by the index (79.7%). This measure indicated that once in an academic year, the impact was not as signifi cant (4.7%) as it may be. Nonetheless, a reasonable index (15.6%) noted that the impact was quarterly.
On the other hand, a composite frequency of results of the risk of impact of the various indexes (variables) was discussed. This form of response revealed the occurrence of all the variables in relation to impact. The responses suggested a 59.1% occurrence of risk of impact of the university typically once a year. From the above, there was enough evidence to suggest one thing. Thus the frequency of occurrence of the risk factor(s) predominantly was within a period of one year or one academic year in HEI terms.
up-and-down movements in economic activity, measured by fl uctuations in the various desirable factors of the setting, in this case a University and the various risk factors associated with it. Arguably though, James, an interviewee noted thatb business cycle is not a regular, predictable, or repeating phenomenon like the swing of the pendulum of a clock”.
James maintained that its timing is random and, to large degree, unpredictable. From the perspective of the above empirical evidence, literature and data from the interviewees, it was important to note therefore that the cycle under consideration in this study was one academic year as evidenced by period of occurrence of the risk factors, which, as a recommendation presupposes that application of models of risk and risk measures should take congnisance of the business cycle in further research studies. This may be due to the academic or business cycle being one year.
Meanwhile, few (2.3%) regarded the impact as insignifi cant, thus happening once every 3 years. As measured by the percentage response, there appeared to be no essential difference (3.4%) in terms of impact occurring once a week. About a quarter (24.7%) of the respondents noted that the impact is moderate thus occurring once quarterly. In the interim, a neighborhood of one-tenth (10.4%) agreed that the impact was signifi cant- thus, could happen often (on average once a month). The next sub-section under discussion was decision making of risk consequence.
3.2 Decision Making of Risk Consequence: application of Nicholas risk model
Recollect from table 3.1, that with identical means, the two variables5 distributions are similarly centered (as measured by their means). Noting that variable B’s distribution has somewhat more dispersion as measured by standard deviation. In this instance, the likelihood of occurrence of risk associated with below target of teaching staff with masters and or doctorates is riskier as measured6 by standard deviation. Consequently, the impact of occurrence of risk associated with below target of teaching staff with masters and or doctorates has the better risk –reward profi le. In other words low risk profi le.
to moderate (keep low) the likelihood of occurrence of risks in relation to the data on the variable staff qualifi cation. See the mathematical treatment below.
It should be recalled that in phase 1, section 1, Nicholas (2004) iden-tifi ed two distinct features of risk, which point to the fact that risk addresses; (1) the likelihood that some problematical event would occur and (2) the impact of the event if it does occur. However, Nicholas (2004) expressed the above mathematically as risk = ƒ (likelihood, impact), (cf. also section 2 phase II) which suggested that risk is a joint function of likelihood and impact of risk.
Rc = (La) (Imb)
Numerically, the index of risk (sq) = Rc = (0.764) (0.535) = 0.409 Where risk (sq) = Rc ; means risk associated with below target of staff
qualifi cation
La= the likelihood that some problematical event would occur Imb= the impact of the event if it does occur
Inferring from the index and mathematical defi nition above, this simply means that once likelihood and impact are directly proportional to risk, and fortunately the magnitude of impact of risk as seen in table 3.3 below is lower, then numerical, it makes sense to control7 and mitigate the likelihood of occurrence of the risk. Once likelihood of occurrence of risk is controlled, there would be a direct effect on entire risk consequence by it being controlled University-wide, hence a brighter risk reward profi le.
Mean and standard deviation of staff qualifi cation
Table 3.3
Mean Std. Deviation N
(A) The impact of occurrence of risk associated with below target of teaching staff with Masters and or Doctorates is
2.25 0.535 64
(B) The likelihood of occurrence of risk associated with below target of teaching staff with Masters and or Doctorates is
2.25 0.764 64
The key information here is that all else being equal, it is important the University makes frantic effort to mitigate the likelihood of occurrence of risk either by keeping its measure (0.764) below its current measure and its comparative measure that is (impact =0.535).
Noting that the likelihood of occurrence of risk associated with below target of allocation of infrastructure distribution has somewhat more dispersion, as measured by standard deviation. Thus, the likelihood of occurrence of risk associated with below target of allocation of infrastructure is riskier as measured by standard deviation. Accordingly, the impact of occurrence of risk associated with below target of allocation of infrastructure has the better risk –reward profi le. This suggested that all else being equal and should the impact associated with the risk be kept as constant (with a standard deviation8 of 1.011), there would be a brighter reward associated with meeting the target of allocation of infrastructure. The likelihood should be managed.
Inferring from the mathematical defi nition above, this simply means that once likelihood and impact are a function of risk, and that the magnitude of impact of risk as seen in table 3.4 is low, then numerical, it makes logic to control9 and mitigate the likelihood of occurrence of the risk. Once likelihood of occurrence of risk is controlled, there would be a direct effect on entire risk by it being controlled University-wide, hence a brighter risk reward profi le.
Numerically, the index of risk (ii) = (1.194) (1.011) = 1.207
Where risk (ii) means risk associated with below target of institutional infrastructure
Mean and standard deviation allocation of institutional infrastructure Table 3.4
Mean N SD
(A) The likelihood of occurrence of risk associated
with below target of allocation of infrastructure 3.34 64 1.194
(B) he impact of occurrence of risk associated
with below target of allocation of infrastructure is 3.34 64 1.011
Mean and Standard deviation of pass rates
Table 3.5
N Mean Std. Deviation Skewness Kurtosis
Statistic Statistic Statistic Statistic Statistic
(A) What impact of occurrence of risk is associated with below target in pass rates for all student groups of the institution
64 2.33 0.691 0.139 -0.187
(B) What likelihood of occurrence of risk is associated with below target in pass rates for all student groups of the institution
64 2.41 0.791 0.493 -0.852
The above variability gives an indication that at this stage, risk calculated and subsequent decisions made are likely to be erroneous. This is due to the degree of variability as noted above.Thus evidently suggesting and warranting further analysis.
The realised mean in table 3.5 on variable B appeared to have been different than the mean in variable A. The question now is, was the difference statistically signifi cant for the inference made above? The above was answered as shown below.
Letting μ1 stand for the mean forvariableA and μ2 stand for mean for variable B in the 3.5, a formulated hypothesis was as:
Ho = The mean on variable A is equal to the mean of variable B Ha = The mean on variable A is not equal to the mean of variable B This was represented as:
Ho : μ1 - μ2 = 0 versus Ha : μ1 - μ2 ≠ 0 .
at this point, the University can make a decision based on Nicholas’s (2004) risk defi nition.
Inferring from Nicholas’s (2004) mathematical defi nition of risk and table 3.5, this simply means that once likelihood and impact are functions of risk, and since the magnitude of impact of risk as seen in table 3.5 was lower, then numerically, it does suggest a control and a subsequent mitigation of the likelihood of occurrence of the risk. Once likelihood of occurrence of risk is controlled, there would be a direct effect on entire risk by it being controlled University-wide, hence a brighter risk reward profi le.
Thus numerically, the index of risk (prs) = (0.791) (0.691) = 0.954 Where risk (prs) means risk associated with below target of pass rates. The key information was that all else being equal, there was a strategic reason, steaming from the mathematical treatment to manage the likelihood of occurrence of risks associated with below target in pass rates for all student groups of the institution. This was because, risk is a function of likelihood and impact of occurrence of risk. In which case, comparatively, the impact of occurrence of risk was lower as evidenced above in table 3.5.
To further support the claims above, it is imperative to address the question of risk preference for the purpose of benchmarking the means and standard deviations. For this reason, a further statistical analysis was conducted in relation to percentiles.
3.2.1 Standard of measure Indexes
Benchmark indexes
Table 3.5.1
N Mean Std.
Deviation Minimum Maximum Percentiles
25th 50th
(Median) 75th 25th
50th
(Median) 75th 25th 50th (Median)
(A) What impact of occurrence of risk is associated with below target in pass rates for all student groups of the institution
64 2.27 0.718 1 5 2.00 2.00 2.75
(B) What likelihood of occurrence of risk is associated with below target in pass rates for all student groups of the institution
64 2.38 0.826 1 5 2.00 2.00 3.00
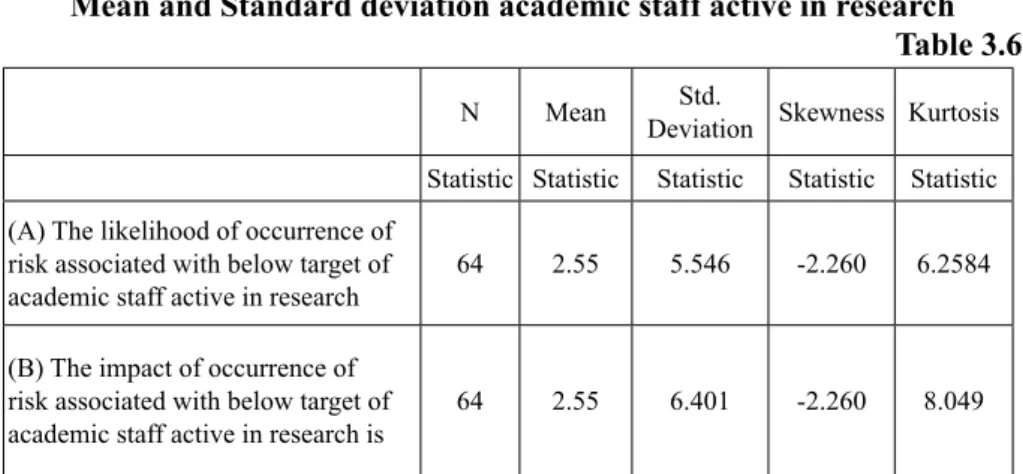
The fi nal analysis made related to the quantitative risk analysis was probing the university’s academic staff active in research as well as throughput targets met in the institution. Following the presentation in table 3.6 below, and with identical means, the distributions are similarly centered. Variable B’s distribution has somewhat more dispersion, as evidenced by standard deviation. Both variables are negatively skewed to the same degree. Both variables have very large excess kurtosis, indicating much more frequent risk at the extremes, both positive and negative, than for a normal distribution.
Mean and Standard deviation academic staff active in research Table 3.6
N Mean Std.
Deviation Skewness Kurtosis
Statistic Statistic Statistic Statistic Statistic
(A) The likelihood of occurrence of risk associated with below target of academic staff active in research
64 2.55 5.546 -2.260 6.2584
(B) The impact of occurrence of risk associated with below target of academic staff active in research is
64 2.55 6.401 -2.260 8.049
In conclusion, table 3.7 revealed identical means, for percentage throughput targets met in the institution. Noting that the two distributions are similarly centered. Variable B’s distribution has somewhat less dispersion, as specifi ed by standard deviation. Both distributions are asymmetric but in different ways. The distribution for variable A was negatively skewed; variable B’s distribution was positively skewed.
Inferring from the indexes above together with Nicholas’s (2004) mathematical defi nition of risk, the University would prefer the distribution of variable B, which has the same mean as variable A, but less risk as evidenced by standard deviation. Furthermore, variable B’s risk is positively skewed, indicating a higher frequency of very large positive rewards relative to variable A. In contrast. Variable A is negatively skewed.
The next stage of analysis was to predict and forecast events based on available index for future use. The essence was to explore sub-question related to Bayesian analysis.
Table 3.7: Mean and Standard deviation of percentage throughput targets met in the university
N Mean Std.
Deviation Skewness Statistic Statistic Statistic Statistic (A) What likelihood of occurrence of risk is
associated with percentage throughput targets met in the institution
64 2.38 8.330 -1.260
(B) What impact of occurrence of risk is associated with percentage throughput targets met in the institution
3.2.2 Bayesian Analysis of Risks
The question that could follow in most of the analysis made above was what probability theory has to say about learning from experience? With reference to the main research objective. It interrogated the predictive power QRA models have within an HEI. It would interest any analyst to be able to predict/forecast events of the future with some relative objectivity. This was consistent with the objective of this study (cf. research objectives).
To attain the objective of prediction, an analyst could use Bayes-ian analysis as described below to update probability of one event given new information. To answer the above question, the section started with an under-standing and analysis of Bayesian analysis.
Recall that when institutions make decisions involving risk, they of-ten start with viewpoints based on their experience and knowledge to generate the indexes seen above (cf. sections 3.1 -3.2.1).
One thing that is easily known is that these viewpoints may be changed or confi rmed by new knowledge and observations with the decay of time. But, on the other hand what is hard to note is how to systematically and objectively treat the information to be updated. This is where Bayesian analysis is appropriated.
Baye’s’ formula is a rational method for adjusting the viewpoints as the institution confronts new information, in which case, the formula makes use of a set of equations (cf. equ 2 below) to answer the question above by using the Total Probability Rule. Thus, in general, this rule suggests that Baye’s formula uses the occurrence of an event to infer the probability of a scenario generating it. For that reason, Baye’s formula is sometimes called an inverse probability.
In many illustrations, including its application in this research, an individual is updating his/her beliefs concerning the causes that may have produced a new observation. For the illustration and application of Bayesian analysis in this research, follow the discussion below with reference to table 3.2 in phase I.
With the above synopsis of Baye’s analysis together with the inferences to be made from table 3.2 (cf phase I) and (see appendix A), the research uses the occurrence of an event (likelihood-variable B) to infer the probability of a scenario (impact-variable A) generating it, thereby predicting, updating and making further inferences.
standard deviations for the variables (1) that exceeded the consensus standard deviation-SD estimate, or (2) the years’ standard deviations-SD exactly meeting the consensus standard deviation-SD estimate, or (3) the years’ standard deviations-SD falling short of the consensus standard estimate.
Now, on the basis of the research, the following prior probabilities (or priors, for short) could be written down concerning these three events mentioned above noting from table 3.8 (cf appendix A).
P(SD exceeded consensus) = 0.45 P(SD met consensus) = 0.30
P(SD fell short of consensus) = 0.25
These probabilities are ‘prior’ in the sense that they refl ect only what the university knows now, before the arrival of any new information. If, next year, the university intends to announce that it is expanding or increasing student pass rate (cf. table 3.3), in its three campuses10 to meet increased demand from say government requirement; this becomes new information with two assumptions. The fi rst being that the decision to expand capacity relates not only to current demand, but also to the prior year’s demand. Secondly, knowing that pass rate probabilities (counts) are related to observed and expected count generated from table 3.8.
The question the university has is, ‘in light of the new information, what is the updated probability that the prior year’s SD probability exceeded the consensus estimate?’ Baye’s formula provides a rational method for accomplishing this updating. The new information could be abbreviated as ‘university expands’. The fi rst step in applying Baye’s formula is to calculate the probability of the new information (here: university expands), given a list of events or scenarios that may have generated it. The list of events should cover all possibilities, as it does here. Formulating these conditional probabilities is the key step in the updating process. Suppose then the university’s view11 is
P (university expands SD Probabilities exceeded consensus) = 0.75 P (University expands SD Probabilities met consensus) = 0.20 P (University expands SD Probabilities fell short of consensus) = 0.05
P (university expands), as follows:
P (university expands) = P (university expands SD Probabilities exceeded consensus)
X P (SD exceeded consensus)
+ P (University expands SD Probabilities met consensus) X P (SD met consensus)
+ P (SD met consensus)
X P (SD fell short of consensus) ……….(2) = 0.75(0.45) + 0.20 (0.30) + 0.05 (0.25)
= 0.41, or 41%
This above equation using the total probability rule is what generates 41%. Now the university can answer the question by applying Bayes’ formula:
P (SD exceeded consensus university expands)
= P(university expands SD exceeded consensus) P (SD exceeded consensus) P (University expands)
= (0.75/0.41) (0.45) = 1.829268 (0.45) = 0.823171
Thus the key information here is that prior to university’s announcement, the university thought that the probability that University would beat consensus expectations was 45 percent. On the basis of interpretation of the announcement, the university update’s that probability to 82.3%.
This updated probability is called the university’s posterior probability, because it refl ects or comes after the new information. The Baye’s’ calculation takes the prior probability, which was 45 percent, and multiplies it by a ratio- the fi rst term on the right-hand side of the equal sign. The denominator of the ratio is the probability that university expands, as one views it without considering (conditioning on) anything else. Therefore, this probability is unconditional.
4. Conclusions and recommendation
This section mainly addresses four points; thus (1) fi ndings of impact of occurrence of risks (2) mathematical treatment of risk (3) measures of risk and (4) Bayesian Analysis and its implication.
4.1 Findings of impact of occurrence of risks
The fi ndings revealed that the impact of occurrence of risks in the University was predominately once a year. Thus, although in most business cases, where as business cycles considerably vary depending on the industry and or the institution, this study revealed that considerably, most impacts in HEI (University) was within the period of one academic.Secondly, noting from the data above; (1) the impact of occurrence of risk associated with 3rd stream income typically was within once a year (2) almost similar trend was revealed in relation to the impact of occurrence of risk associated with not meeting percentage of throughput targets (3) in the case of the impact of occurrence of risk associated teaching staff and academic staff in university, the impact of the risk of not meeting the target of academic staff in research was quarterly (4) the impact of occurrence of risk associated with below target of allocation of infrastructure was within the neighborhood of quarterly basis, but can equally occur an academic year (5) a composite results of the risk of impact of the various indexes revealed that the risk impact of occurrence of risk of the university was typically once a year (6) same as composite risk impact, the composite output of likelihood (cf. phase I) of occurrence of the various risk was unlikely- thus could happen, but rare (typically once a year).
4.2. Mathematical treatment of risk and the fi ndings
With reference to the variables investigated (cf. section 3.2), the main fi ndings in relation to either controlling the likelihood or the impact of occurrence of risk was that to have a brighter risk reward, in all cases12, it was important to control the likelihood of occurrence of risks as compared with its impact so to have a direct effect on entire University. In the case of academic staff active in research, all else being equal and should the likelihood associated with the risk be kept as constant, there would be a brighter reward associated with meeting the target of academic staff active in research as compared with its impact of occurrence of risk in the University.
4.3 Measures of Risk
between risk factor, its likelihood and impact, under constant conditions of the institution (standard of measurements). This was consistent with Nicholas and Steyn (2008) view of risk being a function of likelihood and impact of occurrence of risk factor. Noting that the risk measurement approach is critical and affects all the major issues in University (pass rate, through put, staffi ng, infrastructure, etc).
However, review of literature suggested that there was no a general method to measure the degree of risk of the University objective. On the contrary, there are alternative approaches in business or customised that are applicable in HEI and most importantly, the use of one or more mainly depended on the specifi c (a) standard of measurement and (b) time the University has to deal with. This was also consistent with previous studies (COSA, 2005: Morgan, 1993). Note though that for the sake of relevance, the researcher did not intend to exhaust all models, but provided HEI with a general view about the current risk measures and risk modeling approaches that: the measures13 of risk would merit Universities attention for various reasons: Firstly, as found in literature (King III report, 2009: Stoney, 2007: COSA, 2004) application of risk measures should be related to the current legislative framework that affects HEI. Secondly, they are far less known classical risk measures in HEI. Thirdly, they may be applied in any HEI problem as well as for every kind of risk (pass rate, through put rate, infrastructural risk etc).
4.4 Bayesian Analysis and its Implication
Based on the Bayesian analysis, the impact of risk should be assessed along three aspects. These aspects included the human impact (decisions made), the property impact (students and infrastructural based) and the business impact (effect of decision and property impact to meet regulations/ intentions). This was important in that institutional-wide risk management dictated a holistic/organisational approach to risk management.
The underlying premise of institutional-wide risk management was that every entity exists to provide value for its stakeholders. All entities face uncertainty and the challenge for management is to determine how much uncertainty to accept as it strives to grow stakeholder value This (value) is maximised when management sets strategy and objectives to strike an optimal balance forecasting and effectively deploys resources in pursuit of the entity’s objectives based on relative prediction and precision methods and process such as using Bayesian analysis.
Notes
1. The derivative used in this study is synonimous to fi nancial instruments whose value is a function of another. The term is not the usual word used in differencial calculus.
2. See for instance the entire of section 3
(likelihood, Impact) is often used
4. In this research, event is defi ned as a risk factor- it is important to note that both in mathematical modeling and or probability theory the terms may be interchangeable.
5. Represented as A and B
6. Also see good approaches of risks and risks measures by Morgan (1996) (for RiskMetrics – Technical Document)
7. Note that ‘Control’ in this research is taken as to reduce to the minimal extent either by subjectively or objectively.
8. See phase 1 for risk and measures of risk
9. Note that ‘Control’ in this research is taken as to reduce to the minimal extent either by subjective and objective.
10. The University under investigation had 3 compuses suituated in the nighbohood of 64kilometers apart offering relatively different programmes. See University website for details. 11. At this point, the university makes decisions based on what needs to be met by the government and or their intention.
12. but one (academic staff active in research)
13. The measurement of risk levels however is a major topic in business (see Mathematical Finance). In HEI though, it could be related to major classical issues (cf. section 3-results of study). In the past though, it has been addressed by drawing on different approach-es, all of them refl ecting a complex mathematical development. The researcher has concluded and summarised some major fi ndings, but for obvious reasons a lot of questions such as ap-plicability of other models have not been addressed here. Thus, many theoretical and practical problems are still open. Some of which include pure/applied mathematics. Functional Analysis, Complex analysis, Numerical analysis, Measure and Probability Theory, Ordinary differential equations, Partial differential equations, Delay differential equations, Stochastic differential equations, Mathematical Programming and other mathematical fi elds that play a crucial role, and they would go on to play a crucial role in future research.
Bibliography
- Crouhy, M., Galai, D. and Mark, R. The essentials of risk management. New York: McGraw-Hill, 2006
- Fan, J.X. and Xiao, J.J. Cross-cultural differences in risk tolerance: a com-parison between Chinese and Americans. Journal of Personal Finance, 5, 2006, 54-75
- McNeil, A. J., Frey, R., and Embrechts, P. Quantitative Risk Management: Concepts, Techniques, and Tools’. Princeton: Princeton University Press, 2005
- Menard, S.W. Applied logistic regression analysis. Uk: Sage Publication, 2002 - Mishra, A. and El-Osta, H. Risk Management through Enterprise Diversifi ca-tion: A Farm-Level Analysis. CA: AAEA annual meeting, Long Beach, 2002
- Van Gelderen, M., Thurik, R. and Bosma, N. Success and risk factors in the pre-startup phase, Small Business Economics.26, No 3, 2006, 19-335
- King III Report. King Committee on Governance: Draft code of Governance Principles for South Africa, South Africa, 2009
- Nicholas, J. M. Project management for Business and Engineering: Principles and Practices. (2nd ed). Burlington, MA: Butterworth Heinemann, 2004
- Stoney, C. Risk management: a guide to its relevance and application in Quality management and Enhancement. Leeds Metropolitan University: Publisher unknown, 2007
Integrated Framework. COSO: New York, 2004
- Council on Higher Education -CHE, Final Audit Report On the University of Fort Hare, 2009, Available on line at http://intranet.ufh/FinalReportForUFH retrieved (April 2009).
- Crouhy, M., Galai, D. and Mark, R. The essentials of risk management US: McGraw-Hill Professional, 2006
- Higher Education funding Council for England-HEFCE, Risk, management,
2001, Northern Ireland Available on line at http://www.hefce.ac.uk/Pubs/hefce/2005/05_11/)14th December, 2007
- Higher Education Quality Committee, Criteria for Institutional Audits, 2004, The Council on Higher Education. Pretoria. Available on line at http://www.casact.org/research/ erm/overview.pdf.
- Krishnan, G.V., Auditors’ risk management and reputation building in the post-Enron environment: an examination of earnings conservatism of former Andersen clients, 2004, Working paper. Available on June, 2009. http://www1.american.edu/academic. depts/ksb/fi nance_realestate/mrobe/Seminar/Krishnan.pdf
- Myers, J.N., Myers, L.A. and Omer, T.C. Exploring the term of the auditor-client relationship and the quality of earnings: a case for mandatory auditor rotation,
Accounting Review, 2003, pp. 779-799.
- Nicholas, J. M. and Steyn, H. Project Management for Business and Engineering: Principles and Practices, (3rd ed). Burlington, MA: Butterworth Heinemann, 2008
- Power, M. The Risk Management of everything: rethinking the Politics of uncertainty’ London: Elizerbeth House, 2004
- Reason, J. Human error: models and management, British Medical Journal. 320, No 7237, 2000, pp. 768-770.
- Standard and Poor. Evaluating Risk Appetite: A Fundamental Process of Enterprise Risk management. NY: S and P Publications, 2006
- Walker, P.L., Shenkir, W.G., and Barton, T.L. Enterprise Risk Management: Putting it all together. Institute of Internal Auditors Research Foundation’, 2002, FL: Altamonte Springs. Creating the Information Force. 1, 64- 70. http://ieeexplore.ieee.org/xpl/ freeabs_all.jsp?arnumber=985765 retrieved on 15 June, 2009.
- Bedford, T. and Cooke, R.M. Probabilistic risk analysis: foundations and methods. Cambridge Univ Press. UK, 2001
- Chavez-Demoulin, V. and Embrechts, P. Quantitative models for operational risk: extremes, dependence and aggregation. Journal of Banking and Finance. 30, No10, 2006, pp. 2635-2658
- Degen, M. and Embrechts, P. and Lambrigger, D.D. The quantitative modeling of operational risk: between g-and-h and EVT. Astin Bulletin. 37, No 2, 2007. pp 265-270
- Markowitz, H.M. The Elimination Form of the Inverse and it’s Application to Linear Programming, Management Science 3, No 3, 1957, pp 255–269
- Basel II Revised international capital framework, 2009, http://www.bis.org/ publ/bcbsca.htm. Retrived on 20th October, 2009.
- Sarbanes-Oxley Act of Center for Quality Management, 2002, http://thecaq. aicpa.org/Resources/Sarbanes+Oxley/. Retrived on 20th August, 2009.
- COBIT. A powerful and user-friendly IT governance framework, 2007, http://ww2.itweb.co.za/offi ce/analytix/0705230810.htm. Retrived on 20th August, 2009.
- BALB´A S. Mathematical methods in modern risk measurement: A survey, RACSAM Rev. R. Acad. Cien. Serie A. Mat., 101, No 2, 2007, pp 205–219.
- Hansen, G.D. and Prescott, E.C. Capacity constraints, asymmetries, and the business cycle. Review of Economic Dynamics. 8, No4,2005,pp 850-865.
- Hansen, G.D. and Imrohoro. Consumption over the life cycle: the role of annuities. Review of Economic Dynamics. Elsevier, 2008
APPENDIX A Observed and expected count of count of pass rates
Table: 3.8 What impact of occurrence
of risk is associated with below target in pass rates for all student groups of the
institution
What likelihood of occurrence of risk is associated with below target in pass rates for all student groups of the
institution
Observed Expected
Count % Count %
Insignifi cant -Remote possibility (once every 3 years)
Rare- Remote possibility (once
every 3 years or more) 1 1.6% .031 .0%
Unlikely- Could happen but rare
(typically once a year) 1 1.6% 1.406 2.2%
Possible -Could happen
occasionally (on average quarterly) 0 .0% .344 .5%
Likely - Could happen often (on
average once a month or more) 0 .0% .156 .2%
Almost Certain- Could happen
frequently (once a week or more) 0 .0% .062 .1%
Minor- Could happen but rare (typically once a year)
Rare- Remote possibility (once
every 3 years or more) 0 .0% .450 1.1%
Unlikely- Could happen but
rare (typically once a year) 34 53.1% .300 48.3%
Possible -Could happen occasionally (on average
quarterly)
6 9.4% .250 11.8%
Likely - Could happen often (on
average once a month or more) 2 3.1% 3.437 5.4%
Almost Certain- Could happen
frequently (once a week or more) 2 3.1% 1.375 2.1%
Rare- Remote possibility (once
every 3 years or more) 0 .0% .219 .3%
Unlikely- Could happen but rare
Possible -Could happen
occasionally (on average quarterly) 3 4.7% 2.406 3.8%
Likely - Could happen often (on
average once a month or more) 1 1.6% 1.094 1.7%
Almost Certain- Could happen
frequently (once a week or more) 0 .0% .437 .7%
Signifi cant- Could happen often (on average once a month)
Rare- Remote possibility (once
every 3 years or more) 0 .0% .047 .1%
Unlikely- Could happen but rare
(typically once a year) 0 .0% 2.109 3.3%
Possible -Could happen
occasionally (on average quarterly) 1 1.6% .516 .8%
Likely - Could happen often (on
average once a month or more) 2 3.1% .234 .4%
Almost Certain- Could happen
frequently (once a week or more) 0 .0% .094 .1%
Major- Could happen frequently (once a week or more)
Rare- Remote possibility (once
every 3 years or more) 0 .0% .016 .0%
Unlikely- Could happen but rare
(typically once a year) 0 .0% .703 1.1%
Possible -Could happen
occasionally (on average quarterly) 1 1.6% .172 .3%
Likely - Could happen often (on
average once a month or more) 0 .0% .078 .1%
Almost Certain- Could happen