Mathematical model for the assessment of fracture risk associated with
osteoporosis
Jairson Dinis, Ana I. Pereira, and Elza M. Fonseca
Citation: AIP Conf. Proc. 1479, 814 (2012); doi: 10.1063/1.4756262
View online: http://dx.doi.org/10.1063/1.4756262
View Table of Contents: http://proceedings.aip.org/dbt/dbt.jsp?KEY=APCPCS&Volume=1479&Issue=1
Published by the American Institute of Physics.
Related Articles
Continuous-waveform constant-current isolated physiological stimulator
Rev. Sci. Instrum. 83, 044303 (2012)
A new device for performing reference point indentation without a reference probe
Rev. Sci. Instrum. 83, 044301 (2012)
A numerical analysis of multicellular environment for modeling tissue electroporation
Appl. Phys. Lett. 100, 143701 (2012)
Some observations on the mechanics and dynamics of tumor heterogeneity
AIP Advances 2, 011001 (2012)
Roles of silica and lignin in horsetail (Equisetum hyemale), with special reference to mechanical properties
J. Appl. Phys. 111, 044703 (2012)
Additional information on AIP Conf. Proc.
Journal Homepage: http://proceedings.aip.org/
Journal Information: http://proceedings.aip.org/about/about_the_proceedings
Top downloads: http://proceedings.aip.org/dbt/most_downloaded.jsp?KEY=APCPCS
Mathematical Model for the Assessment of Fracture Risk
Associated with Osteoporosis
Jairson Dinis
∗, Ana I. Pereira
∗,†and Elza M. Fonseca
∗,∗∗∗Polytechnic Institute of Bragança, Portugal
†ALGORITMI, University of Minho, Portugal
∗∗CENUME, FEUP, Portugal
Abstract. Osteoporosis is a skeletal disease characterized by low bone mass. It is considered a worldwide public health
problem that affects a large number of people, in particularly for women with more than 50 years old. The occurrence pattern of osteoporosis in a population may be related to several factors, including socio-economic factors such as income, educational attainment, and factors related to lifestyle such as diet and physical activity. These and other aspects have increasingly been identified as determining the occurrence of various diseases, including osteoporosis. This work proposes a mathematical model that provides the level of osteoporosis in the patient. Preliminary numerical results are presented.
Keywords:Nonlinear optimization. Risk of fracture. Osteoporosis.
PACS:02.60.Pn
INTRODUCTION
Osteoporosis is a skeletal disease characterized by low bone mass, predominant in older adults, particularly in postmenopausal women [1, 2]. This pathology is characterized by the degeneration of bone microstructure, leading to increasing bone brittleness and susceptibility to fracture, [3, 4]. Osteoporotic fractures are a major cause of morbidity and mortality in the population [3, 4, 5, 6]. Particularly, hip fracture, has a deep impact on quality of life, increasing difficulties regarding the activities of daily life [7, 8]. In this work we analyze the influence of some specific risk factors related with osteoporosis to identify the level of osteoporosis in the patient.
STUDY METHODOLOGY
For the proposed mathematical model we considered 97 women questionnaires aged over than 60 years old. This is only valid for densitometry examinations marks obtained in the DEXA equipment and software EnCORE 2004 GE Medical Systems.
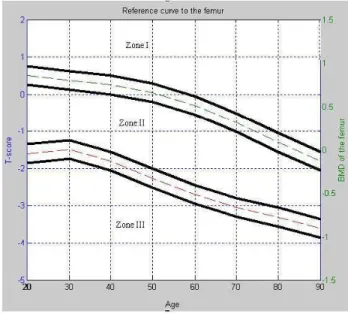
We indicate that the patient belong to the Zone I if the patient has a normal bone. Zone II and III, if the patient has osteopenia and osteoporosis, respectively. We used the reference curve, for the femur anatomical region, to define the Zone I, II and III (see Fig. 1, where the dashed lines are the boundaries of each zone). This reference curve is indicated through the DEXA equipment.
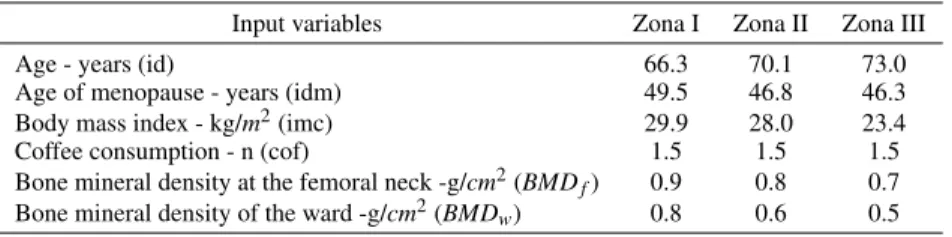
Table 1 presents the average of input variables in each Zone.
TABLE 1. Average of the input variables for the Zone I, II and III.
Input variables Zona I Zona II Zona III Age - years (id) 66.3 70.1 73.0 Age of menopause - years (idm) 49.5 46.8 46.3 Body mass index - kg/m2(imc) 29.9 28.0 23.4 Coffee consumption - n (cof) 1.5 1.5 1.5 Bone mineral density at the femoral neck -g/cm2(BMDf) 0.9 0.8 0.7
Bone mineral density of the ward -g/cm2(BMDw) 0.8 0.6 0.5
smaller for the women that are in the Zone III (women with osteoporosis). As we expected, the bone mineral density (at the femoral neck and at the wards) is lower in the women group that has osteoporosis.
In the neighborhood of the reference curves, the proposed mathematical model is not valid. So, the mathematical model is not valid in the following region:
BMDL= [BMD−δ,BMD+δ], (1)
where theδis the region tolerance andBMDis the value in the reference curve for the current patient age. Figure 1 represents the Zone I, II and III and the regionBMDL.
FIGURE 1. Femur region curve and the tolerance limits.
If the patient’s BMD not belong toBMDLthe mathematical model is applied. This mathematical model has as main
objective to predict what is the situation of the patient (patient in the Zone I, II or III).
In this study we considered two different mathematical models to approximate the value of T-score for femoral neck region
f1(x) = x1(bmd f+bmdw)2+x2imc30 +x360
id +x4 1 co f +x5
idm
50 (2)
and
f2(x) = x1(bmd f+bmdw)2+x2imc30 +x360
id+x4 1 co f +x5
idm
50 +x6. (3)
To identify the optimal solutionx, it was solved the following constrained nonlinear optimization problem:
min g(x) = n
∑
i=1(fij(x)−tsi)2
s.a x1≥x2
x2≥x3
x3≥x4
x5≥x4
(4)
wheretsirepresents the T-score of the patienti,fij(x), for j=1,2, represents the T-score approximation of the patient
i.
to the body mass index (imc), followed by patient age (id), age at menopause (idm) and finally the coffee consumer (cof).
To identify the optimal parameters, we used three optimization methods from Matlab [9]: Genetic Algorithms (GA), Pattern Search method (PS) and Sequential Quadratic Programming method (SQP).
NUMERICAL RESULT AND DISCUSSION
To choose the best mathematical model, we use twenty questionnaires. Table 2 shows the objective function values for the three optimization methods.
TABLE 2. Objective function values.
Algorithms f1 f2
SQP 8.10 1.23 PS 8.09 1.48 GA 8.93 3.68
According to the results presented in Table 2 the best function isf2.
The Table 3 presents the results obtained with twenty questionnaires considering the functionf2and different values
ofδ. The table presents the number of tests that do not belong to the regionBMDL(NTN), the number of questionnaires
with a proper identification (NQP), the number of questionnaires with a wrong identification (NQW) and the correct identification rate (CIR).
TABLE 3. Numerical results for the functionf2. δ Algorithms NTN NQP NQW CIR 0.050 SQP 11 9 2 81.2% 0.050 PS 11 9 2 81.2% 0.050 GA 11 8 3 72.7% 0.025 SQP 13 11 2 84.6% 0.025 PS 13 11 2 84.6% 0.025 GA 13 11 2 84.6% 0.015 SQP 17 14 3 82.23% 0.015 PS 17 13 4 76.47% 0.015 GA 17 14 3 82.23%
Table 3 shows that the best result is obtained forδ=0.025.
To validate the mathematical model twenty new questionnaires of patients aged over 60 years old were used. These data were not used to define the optimal parameters of the mathematical model.
The motivation for using these new questionnaires is to test the reliability of the model. The Table 4 presents the validation results.
TABLE 4. Numerical results for functionf2with new
ques-tionnaires.
Tolerance Algorithms NTN NQP NQW CIR 0.025 SQP 16 16 0 100% 0.025 PS 16 16 0 100% 0.025 GA 16 16 0 100%
We can verified in Table 4, that the proposed mathematical model (f2) has 100% of correct identification rate.
CONCLUSIONS AND FUTURE WORK
Some ideas for future work are to extend this study to patients under the age of 60 years old and different gender. And propose different mathematical models to approximate the T-score in different anatomical parts of the human body.
ACKNOWLEDGMENTS
The authors would like to thank the financial support from FEDER COMPETE and FCT Project FCOMP-01-0124-FEDER-022674.
REFERENCES
1. P. Augat, and S. Schorleimmer, Oxford Journals35, 27–31 (2006).
2. J. A. Kanis, and O. J. Melton, and C. Christiansen, and C. C. Johnston, and N. Khaltaev, Journal of Bone and Mineral Research
9, 1137–1141 (1994).
3. O. Johnell, and J. A. Kanis, and A. Oden, and H. Johansson, and C. D. Laet, and P. Delmas, and J. A. Eisman, and S. Fujiwara, and H. Kroger, and D. Mellstrom, and P. J. Meunier, and L. J. Melton, and T. ÓNeill, and H. Pols, and J. Reeve, and A. Silman, and A. Tenenhouse, Journal of Bone and Mineral Research20, 1185–1194 (2005).
4. J. A. Kanis, and O. Johnell, and A. Oden, and H. Johansson, and E. McCloskey, Osteoporosis International19, 385–397 (2008).
5. E. M. M. Fonseca, and A. I. Pereira, and D. F. S. Rocha, and J. K. Noronha, International Journal of Medical Engineering and Informatics, accepted, (2012).
6. M. M. Pinheiro, and R. M. Ciconelli, and O. N. O Jacques, and P. S. Genaro, and L. A. Martini, and M. B. Ferraz, Revista Brasileira de Reumatologia2, 113–127 (2010).
7. J. A. Kanis, and O. Johnell, and B. Jonsson, and A. Dawson, and W. Dere, Osteoporosis International11, 120–127 (2000). 8. A. Papaionnou, and S. Morin, and AM. Cheung,2010 Clinical practice guidelines for the diagnosis and management of