Agricultural Knowledge and Perceptions
Among Students Enrolled in Agriscience Programs
in Texas Counties Bordering Mexico
Isabel M. Whitehead Christopher M. Estepp Sul Ross State University
Hispanics are rapidly becoming the predominant ethnic group in Texas. While many secondary agriculture programs have seen increased participation by Hispanic students, in comparison to the demographics of Texas secondary school enrollment, Hispanics are underrepresented in agricultural education. As a result, agricultural education programs should continue to become more diverse and provide curriculum engaging to a wide variety of students. The purpose of this descriptive, correlational study was to determine the agricultural literacy rates and perceptions of agriculture among Hispanic and non-Hispanic high school agriculture students enrolled in agriculture programs in Texas counties bordering Mexico. Results showed both groups have agricultural literacy rates congruent with previous studies; however, Hispanic students tended to have lower knowledge scores in all areas except agricultural career knowledge, as well as lower perceptions of agriculture. Agricultural career knowledge scores were the lowest area for all respondents. Recommendations include: 1) more research should be conducted to better determine levels of agricultural literacy in minority agricultural education students in Texas and other areas, and 2) more emphasis on agricultural career knowledge should be incorporated into agriscience courses to better inform students about postsecondary education and career options within the agricultural industry.
Keywords: agricultural literacy, Hispanic students, agricultural perceptions, agricultural knowledge
The demographic makeup in the United States is rapidly changing; the National Research Council (NRC, 2006) forecasted the country’s population will be 25% Hispanic by 2030. What is more, according to Petersen and Assanie (2005), by the year 2040, over 50% of Texas’
Hispanic youth could exist, thus affecting individuals’ livelihood. With the demographic changes taking place in Texas, consideration of the implications from an agricultural education perspective is important. As Frick, Birkenholz, Gardner, and Machtmes (1995) stated, people “of all ages and ethnic groups have a vestedinterest in agriculture” (p. 1); thus, students’ knowledge and perceptions of agriculture according to race/ethnicity is an important variable to consider within the context of agricultural education programs.
In the 1988 publication Understanding Agriculture: New Directions for Education,
recommendations by the NRC focused on two areas: increasing students’ agricultural literacy and the inclusion of ethnically diverse students. Frick, Kahler, and Miller (1991) defined agricultural literacy as “possessing knowledge and understanding of our food and fiber system” (p. 52). However, previous studies examining agricultural literacy have shown that students in secondary agriculture programs possess low levels of agricultural knowledge, as well as neutral perceptions of agriculture (Frick et al., 1995; Riedel, 2006). Therefore, according to Frick et al.’s (1991) definition, many students enrolled in secondary agricultural education cannot be considered agriculturally literate.
Twenty years later, the NRC (2009) submitted that the need for agricultural literacy is more paramount as the agricultural industry faces new challenges, such as the globalization of
agriculture, food safety concerns, and changing consumer preferences. They recommended that colleges of agriculture must focus on preparing students to be leaders in the agricultural industry who are capable of addressing current and upcoming issues. As a result, the argument can be made that secondary agricultural education programs serve as a pipeline bringing students into colleges of agriculture; therefore, agricultural literacy must start before the postsecondary level.
Concerning the NRC’s (1988) second recommendation of increasing ethnic diversity, whereas agricultural education programs have become more diverse, there is room for improvement (Lawrence, Rayfield, Moore, & Outley, 2013; Marshall, Herring, & Briers, 1992; Roberts et al., 2009; Talbert & Larke, 1995a, 1995b). Roberts et al. (2009) reported that minority students have historically enrolled in agriculture courses at lower rates than White students. Lawrence et al. (2013) confirmed this with a national study that found the diversity in agricultural education programs did not match the demographics of the school in which the program existed. What is more, Marshall et al. (1992) found that the majority of agriculture students in Texas were White males.
they typically viewed agricultural jobs as low-paying and requiring minimal skills. While studies have suggested that minority students’ agricultural literacy is low, many of these studies are dated. More recent work by Mullinix, Garcia, Lewis-Lorentz, and Qazi (2006) reported Hispanics taking on expanded roles in the agricultural industry, as well as having more positive perceptions of agriculture. Therefore, it is plausible that perceptions have changed with new generations of Hispanic students; thus, new inquiries into the agricultural literacy and
perceptions of Hispanic students are warranted.
Theoretical Framework
The theoretical framework that guided this study was Bandura’s (1986) social cognitive theory. Social cognitive theory provides a model for the relationship between the various factors that have an influence on learning, referred to as triadic reciprocality (see Figure 1). He proposed that within social cognitive theory, “behavior, cognitive and other personal factors, and
environmental influences all operate interactively as determinants of each other” (Bandura, 1986, p. 22). Bandura (1986) further explained that the factors may be present in various strengths, though not necessarily of equal intensity. In the context of this study, experiences of Hispanic students, including culture and prior agricultural experience, could play roles in influencing students’ perceptions of agriculture and behaviors, such as acquisition of agricultural knowledge.
Figure 1. Triadic Reciprocality Model (Bandura, 1986)
Literature Review
Several studies have sought to define agricultural literacy. The NRC (1988) described agricultural literacy as “the goal of education about agriculture” (p. 1), which encompasses a “person’s understanding of the food and fiber system” (p. 8) including “its history and its current economic, social, and environmental significance” (p. 8). Later, Frick et al. (1991) worked to
Behaviors
Personal or Cognitive Factors Environmental
refine the definition of agricultural literacy in an educational context relevant to the public, expanding upon the NRC’s (1988) definition. Frick et al. (1991) defined agricultural literacy as not only possessing knowledge about the food and fiber system, but also being able to
synthesize, analyze, and communicate basic information about agriculture. According to their definition, the areas an agriculturally literate person should understand included: 1) the
production of plant and animal products; 2) the economic impact of agriculture; 3) agriculture’s societal significance; 4) agriculture’s important relationship with natural resources and the environment; 5) the marketing of agricultural products; 6) the processing of agricultural products; 7) public agricultural policies; 8) the global significance of agriculture; and 9) the distribution of agricultural products (Frick et al., 1991). In the context of this study, agricultural knowledge and perceptions were used to operationally define agricultural literacy.
In a continuation of the line of inquiry into agricultural literacy, several studies have been conducted to determine the levels of agricultural literacy among various populations. Results have shown that most students (agriculture vs. non-agriculture, rural vs. urban, and White vs. minority) possess lower than desired levels of agricultural literacy. Frick et al. (1995) created the Agricultural Awareness Survey based on the nine aforementioned areas of agricultural literacy. Their intent was to determine agricultural knowledge and perceptions among rural and urban high school students. Results showed that rural, Caucasian students possessed greater agricultural knowledge than the urban students who were predominately African-American. Additionally, they found that both groups had relatively positive perceptions of agriculture, especially in the area of natural resources, while their negative perceptions were mainly in the area of agricultural policy. Similar studies (Pense & Leising, 2004; Pense, Leising, Portillo, & Igo, 2005) found varied results. Pense and Leising (2004) found that urban and suburban students who had never been enrolled in an agriculture program scored higher in agricultural knowledge than rural agriculture students; however, all groups of students scored less than 50% correct. Conversely, Pense et al. (2005) found that students who had participated in Agriculture in the Classroom programs showed increases in agricultural knowledge. Recommendations from both studies were that agriculture should be integrated into the curriculum at the elementary level in an effort to increase knowledge and perceptions of the agricultural industry (Pense & Leising, 2004; Pense et al., 2005).
More recently, Riedel (2006) conducted a study investigating the effects of an introductory agriscience course on agricultural literacy among urban high school students in South Carolina. Riedel found an increase in agricultural literacy during the semester the students were enrolled in the course. However, the study concluded that while there was an increase in agricultural
Several studies have also examined minority students’ perceptions of agriculture by measuring their intent to pursue agricultural careers. Results showed that many minority students
considered themselves college bound; however, they did not consider an agricultural degree a viable option (Mallory & Sommer, 1986). Studies have shown that minority students possessed relatively negative views of agricultural careers and agricultural studies in college and had trouble relating to potential career opportunities in an agriculturally-related field (Mallory & Sommer, 1986; Talbert & Larke, 1995a, 1995b). In fact, Mallory and Sommer (1986) reported that about 60% of Black students and 51% of Hispanic students expressed they could not envision themselves pursuing agricultural careers. Their results showed that the majority of these students expressed a desire to have a career in a city involving modern technology, job security, and a good paycheck (Mallory & Sommer, 1986). Minority students have failed to acknowledge the possibility that the agricultural industry could provide them with such career satisfaction (Mallory & Sommer, 1986).
Several explanations can be offered as to why minority students may have lowered perceptions of agriculture. One is that minority students have historically been underrepresented in
secondary agriculture programs (Bowen & Rumberger, 2002; Lawrence et al., 2013; Roberts et al., 2009; Talbert & Larke, 1995a). What is more, Talbert and Larke (1995a) reported that among the minority students enrolled in agriscience courses, many expressed that they had been placed in these courses, as opposed to self-selecting them. Additionally, the availability of minority agricultural educators was low (Bowen & Rumberger, 2002; Lawrence et al., 2013; Talbert & Larke, 1995a). Recommendations consisted of exposing minority students to positive agricultural activities to widen their agricultural experience and providing ethnically diverse role models and educators in an effort to increase positive perceptions toward agriculture.
While some research points to lowered knowledge and perceptions of agriculture among minority students, newer studies have indicated that perceptions of minority students may be changing. A recent qualitative study by De Lay, Salomon, and Vargas (2014) found that
involvement of other ethnic minorities should also be conducted to ascertain what types of recruitment strategies are suitable to increase enrollment and retention (Roberts et al., 2009).
Purpose
According to Doerfert (2011), learning environments reaching a diverse selection of students in agricultural education programs are needed. An examination of the levels of agricultural literacy and perceptions of agriculture among minority students within the state is essential to providing agriculture teachers with current data to continue improving Texas agricultural education programs. Therefore, the purpose of this study was to determine the agricultural literacy of Hispanic and non-Hispanic high school students enrolled in agricultural education programs in Texas counties bordering Mexico. Consequently, the following research objectives guided the study:
1. Assess the level of agricultural knowledge and perceptions of agriculture among Hispanic and non-Hispanic students enrolled in agriscience programs in counties bordering Mexico, and
2. Examine the relationships among demographic variables and perceptions of agriculture and agricultural knowledge.
Methods
The population for this descriptive, correlational study was students enrolled in high school agriscience programs across the Rio Grande Valley region of Texas. Only agricultural education programs in counties that border Mexico were included in the population; a list of programs was provided by the Texas Education Agency. The sample for this study was drawn using multi-stage cluster sampling (McMillan & Schumacher, 2010). Agriculture programs were first clustered by the number of teachers; it was determined that 40% of the schools were 1 teacher programs, 40% of the schools were 2 teacher programs, 10% were 3 teacher programs, and the remaining 10% were 4 teacher programs. A random sample of students was drawn from schools within each cluster. One limitation of this study was that the random sampling was conducted by the teachers of the programs, as a list of individual students was not available to the researchers.
limitation of this study is the low response rate; thus, generalization of the results further than the respondents of this study should be approached with caution.
The Agricultural Awareness Survey (AAS; Frick et al., 1995) was used for this study. The AAS consisted of 70 items; the first 35 measured agricultural knowledge, while the next 35 items were statements gauging students’ perceptions of the agricultural industry. Three possible responses existed for the agricultural knowledge items: yes, no, or not sure. Scoring for the agricultural knowledge section consisted of a score of 1 assigned for a correct answer, while a score of 0 was assigned for an incorrect response or a response of not sure. The highest possible score for the overall agricultural knowledge section was 35. In addition to overall agricultural knowledge, the agricultural knowledge section measured four different areas of agricultural knowledge,
including general agricultural knowledge (13 items; total possible score of 13), agricultural career knowledge (5 items; total possible score of 5), agricultural public policy knowledge (10 items; total possible score of 10), and environmental and natural resource knowledge (7 items; total possible score of 7). The 35 Likert-type items measuring students’ perceptions of the agricultural industry ranged from 1 (strongly disagree) to 5 (strongly agree). Respondents could potentially score 175 on the agricultural perception scale; higher perception scores are related with more favorable perceptions of agriculture. Reliabilities reported by Frick et al. (1995) for the knowledge section of the instrument were .85, while reliabilities for the perceptions section were .90. Additional demographic items measuring gender, race, FFA membership, prior agriculture courses, relationship of parents to agriculture, family members with careers in
agriculture, involvement of the student with animals or pets, home location, 4-H experience, and rural agriculture experience were included in the instrument.
Data were analyzed using SPSS Version 22.0. For objective one, measures of central tendency (i.e., mean and standard deviation) were used to analyze the data. An overall agricultural knowledge summated mean was calculated, as well as a summated mean for each of the four areas of agricultural knowledge. A summated mean was also calculated for agricultural
Results
Respondents in this study were 42.5% male and 57.6% female. The overwhelming majority of respondents were Hispanic (88.6%), while the remaining 11.4% of respondents were classified as non-Hispanic. About 9% lived on a farm, and about 33% reported living in a rural area but not on a farm. The majority of respondents (57.6%) indicated they lived in a residence in a town or city. Many respondents reported having relatives who lived on a farm (57.3%), and 56% of respondents had relatives involved in an agriculturally-related business. The vast majority of respondents (76.7%) reported that they had been involved with raising animals or pets, while 53% reported having raised plants or a garden.
About 10% of participants were freshmen, followed by 22.6% sophomores, 26.3% juniors, and 40.6% seniors. The majority of respondents were FFA members (64.7%). Regarding the number of agricultural courses taken, about 40% indicated they were enrolled in their first agricultural education course, while almost 24% of students had taken 2 courses. About 13% of students had taken 3 agricultural education courses and the remaining 23% percent of students had taken 4 or more agricultural education courses. The maximum amount of courses any one student had taken was 10 agricultural education courses.
Objective one was to assess the level of agricultural knowledge and perceptions of agriculture among Hispanic and non-Hispanic students enrolled in agriculture programs in counties
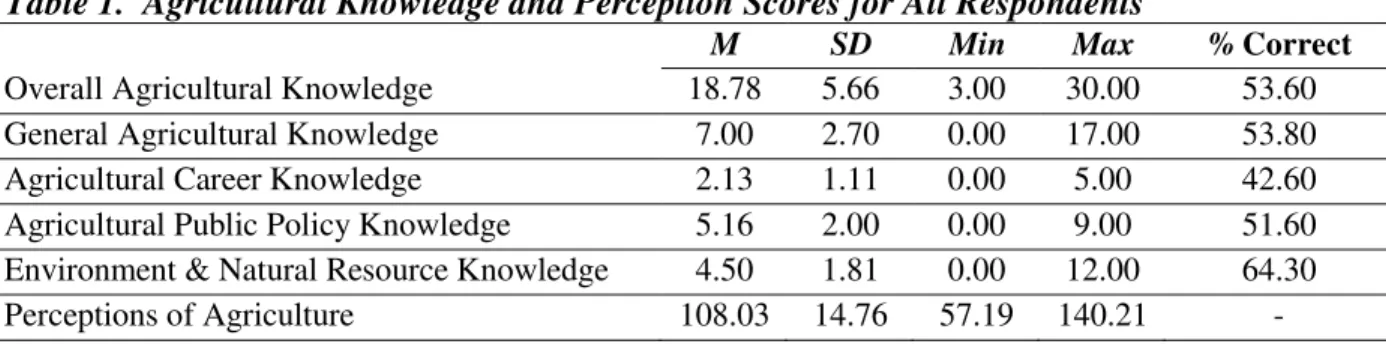
bordering Mexico. Table 1 illustrates the aggregated results for all students. The mean score for respondents’ overall agricultural knowledge was 18.78 out of a possible 35.00 (SD = 5.66). This represented a failing score of 53.60% correct answers for overall agricultural knowledge.
Respondents’ general agricultural knowledge mean was 7.00 out of a possible 13.00 (SD = 2.70), which represented a failing score of 53.80% correct. Agricultural career knowledge had the lowest percentage of correct answers at 42.60% (M = 2.13 out of possible 5.00; SD = 1.11). The mean score for agricultural public policy knowledge was 5.16 out of a possible 10.00 (SD = 2.00; 51.60% correct), and respondents’ mean score for environment and natural resource knowledge was 4.50 out of a possible 7.00 (SD = 1.81; 64.30% correct). Additionally, the summated mean for students’ perceptions of agriculture was 108.03 out of a possible 175.00 (SD = 14.76). The summated mean divided by the total number of items gives a neutral agricultural perception score of 3.09 on a 5-point scale.
Table 1. Agricultural Knowledge and Perception Scores for All Respondents
Table 2 shows the summated means disaggregated by ethnicity. Non-Hispanic students had higher mean scores for overall agricultural knowledge (M = 20.47; SD = 4.70), general
agricultural knowledge (M = 7.60; SD = 2.78), agricultural policy knowledge (M = 5.53; SD = 1.41), and environmental and natural resources knowledge (M = 5.27; SD = 1.16), while Hispanic students had a higher mean score for agricultural career knowledge (M = 2.13; SD = 1.16). Hispanic and non-Hispanic students had failing scores in all knowledge areas, except environmental and natural resources knowledge, where non-Hispanic students scored 75.29% correct. For overall perceptions of agriculture, both Hispanic and non-Hispanic students reported neutral perceptions. Non-Hispanic students’ summated mean was 109.00 (SD = 12.81), and Hispanic students had a summated mean of 107.92 (SD = 15.13). When the summated mean was divided by the total number of items, non-Hispanic students’ average perception score was 3.11 on a 5-point scale, and Hispanic students’ average perception score was 3.08 on a 5-point scale.
Table 2. Agricultural Knowledge and Perception Scores for Hispanic and Non-Hispanic Respondents
Hispanic Non-Hispanic
M SD % Correct M SD % Correct
Overall Agricultural Knowledge 18.50 5.81 52.90 20.47 4.70 58.49 General Agricultural Knowledge 6.90 2.72 53.08 7.60 2.78 58.46 Agricultural Career Knowledge 2.13 1.16 42.60 2.07 0.80 41.40 Agricultural Policy Knowledge 5.10 2.04 51.00 5.53 1.41 55.30 Environmental and Natural
Resources Knowledge 4.37 1.87 62.43 5.27 1.16 75.29
Perceptions of Agriculture 107.92 15.13 - 109.00 12.81 -
Objective two was to examine the relationships among demographic variables and perceptions of agriculture and agricultural knowledge. Table 3 shows the correlation matrix among the
variables. Negligible relationships were found between Hispanic versus non-Hispanic students and the knowledge and perception variables. The strongest associations were found between number of agriculture courses taken and overall agricultural knowledge (r = .31), general agricultural knowledge (r = .23), agricultural public policy knowledge (r = .29), and
Table 3. Correlations Among Demographic Variables and Agricultural Knowledge and Perceptions
1 2 3 4 5 6 7 8 9
1. Overall Agricultural Knowledge - .86 .48 .76 .73 .08 .11 .31 -.17 2. General Agricultural Knowledge - .27 .53 .46 .04 .08 .23 -.18 3. Agricultural Career Knowledge - .19 .27 .00 -.02 .07 -.06
4. Agricultural Policy Knowledge - .40 .05 .07 .29 -.12
5. Environmental/Natural Resource Knowledge - .15 .16 .30 -.10
6. Perceptions of Agriculture - .07 -.09 .19
7. Hispanic/non-Hispanic - .14 -.06
8. Number of Agriculture Courses -
9. FFA member -
Note:Hispanic = 0; Non-Hispanic = 1; FFA Member = 0; Non-FFA Member = 1
Conclusions, Recommendations, and Discussion
Because of the limitations of the study, conclusions should only be generalized to the
participants in this study. Based upon the demographic information, the participants in this study were predominantly Hispanic, FFA members, living in non-rural areas. Over half of the students involved in the study were Hispanic females, which is a positive finding, considering prior research has suggested that involvement in agricultural education has been mainly limited to Caucasian male students (Marshall et al., 1992). Previous research has shown that Hispanic students have been underrepresented in agriculture courses and FFA. Roberts et al. (2009) reported that Hispanic student involvement in the FFA was seemingly representative at the national level in comparison to national demographics; however, in states with a high Hispanic population, involvement by Hispanic students varies and can cause underrepresentation. The high rate of Hispanic students participating in agricultural education in this study is promising; however, the high numbers are likely a result of the local demographics, as the Rio Grande Valley region has a high concentration of Hispanic residents. It is recommended that further research be conducted to assess the involvement of Hispanic students in agricultural programs across Texas and nationally, especially in areas where a demographic disparity exists between the agricultural program, the school, and the community (Lawrence et al., 2013).
programs to determine the depth and breadth of agricultural knowledge being taught and how much agricultural knowledge students are retaining.
While both Hispanic and non-Hispanic students scored highest in the area of environmental and natural resource knowledge, one particular area of concern was students’ knowledge of
agricultural careers. Participants’ agricultural career knowledge scores were the lowest of all knowledge areas, even among students who had taken several agriculture courses. These findings are similar to reports by Mallory and Sommer (1986) and Riedel (2006). This is
particularly problematic as agricultural education falls under the umbrella of career and technical education; thus, educating students about career opportunities within the agricultural industry should be a primary focus. All secondary agriculture courses in Texas contain standards related to teaching students about career opportunities in agriculture. Further research might investigate agricultural students’ career knowledge among various populations to determine if a lack of agricultural career knowledge is prevalent. Additionally, secondary agriculture teachers should place more emphasis on the numerous agricultural careers available to students.
Regarding ethnicity, results of this study showed that non-Hispanic students possessed greater agricultural knowledge and more favorable perceptions of agriculture in all areas, except agricultural career knowledge. Whereas agricultural career knowledge scores were low among all students, this is a promising finding, as previous studies (Mallory & Sommer, 1986; Talbert & Larke, 1995a, 1995b) have shown that minority students possessed little knowledge of or interest in pursuing agricultural careers. However, while this study did not examine Hispanic students’ interest in agricultural careers, it showed that perhaps minority students are gaining more agricultural career knowledge than previous generations. It is plausible that increased
agricultural career knowledge might generate greater interest in these careers among students. The existing research on Hispanic students’ interest in agricultural careers is dated; accordingly, newer studies should examine this topic. Further qualitative inquiries might also examine the variables contributing to Hispanic students’ desire to pursue agricultural careers aiding in recruitment and retention of Hispanic students in agriculture.
The comparison among demographic factors, agricultural knowledge, and agricultural
perceptions revealed few strong relationships. One anticipated finding was students’ agricultural knowledge increased as they completed more agriculture courses. While theoretically, students’ prior experiences in agriculture courses should provide a foundation for the acquisition of further agricultural knowledge, undoubtedly, many other variables also contribute to knowledge
However, students’ perceptions of agriculture in this study remained neutral regardless of the amount of prior coursework. Undoubtedly, a myriad of other factors not addressed in this study are related to students’ perceptions of agriculture; subsequent studies might identify these variables. Adding to the complexity of this issue, non-FFA members exhibited slightly more favorable perceptions of agriculture than FFA members. Again, theoretically, FFA members should possess more favorable perceptions of agriculture, presumably because of their choice to participate in an agricultural organization. However, one possible factor contributing to these results may be that Texas has implemented an FFA affiliation fee. This fee allows schools to pay FFA dues for all students enrolled in an agriculture course; therefore, some students participating in this study may be FFA members but not active. Nonetheless, the agricultural perceptions of all students in this study were neutral. Secondary agricultural educators might examine their curriculum and determine how to improve agricultural perceptions among all students.
According to the correlations, little difference existed between Hispanic and non-Hispanic students in agricultural knowledge and perceptions of agriculture. Non-Hispanic students were associated with slightly higher scores in the following areas: 1) overall agricultural knowledge, 2) agricultural policy knowledge, 3) environmental knowledge, and 4) more favorable
perceptions of agriculture. Hispanic students were associated with slightly higher scores in agricultural career knowledge. Accordingly, results indicated that Hispanic and non-Hispanic students in agriculture programs in Texas share comparable perceptions of agriculture and possess similar amounts of agricultural knowledge. While previously mentioned that low agricultural knowledge and neutral perceptions are of concern, the conclusion that little difference exists between Hispanic and non-Hispanic students is encouraging. This finding is dissimilar from previous studies. Perhaps younger generations of Hispanic students are increasing their agricultural knowledge and improving their perceptions of the agricultural industry more than previous generations.
References
Bandura, A. (1986). Social foundations of thought and action: A social cognitive theory. Englewood Cliffs, NJ: Prentice-Hall.
Bechtold, R., & Hoover, T. S. (1997). Perceptions of agriculture and barriers to higher education among Hispanic and non-Hispanic high school students in South Florida. NACTA
Journal, 41(2), 4–9.
Bowen, B. E., & Rumberger, C. L. (2002). Advancing agricultural education within the context of an increasingly diverse society. Journal of Agricultural Education, 43(1), 1–11. doi:10.5032/jae.2002.01001
Davis, J. A. (1971). Elementary survey analysis. Englewood Cliffs, NJ: Prentice-Hall. De Lay, A. M., Salomon, K., & Vargas, J. (2014, May). Experiences of Hispanic students
enrolled in a secondary agricultural education program. Proceedings of the 2014 American Association for Agricultural Education Annual Research Conference, Salt Lake City, UT.
Dillman, D. A., Smyth, J. D., & Christian, L. M. (2009). Internet, mail, and mixed-mode surveys: The tailored design method (3rd ed.). Hoboken, NJ: John Wiley & Sons.
Doerfert, D. L. (Ed.). (2011). National research agenda: American Association for Agricultural Education’s research priority areas for 2011-2015. Lubbock, TX: Department of Agricultural Education and Communications, Texas Tech University.
Frick, M. J., Birkenholz, R. J., Gardner, H., & Machtmes, K. (1995). Rural and urban inner-city high school student knowledge and perception of agriculture. Journal of Agricultural Education, 36(4), 1–9. doi:10.5032/jae.1995.04001
Frick, M. J., Kahler, A. A., & Miller, W. W. (1991). A definition and the concepts of agricultural literacy. Journal of Agricultural Education, 32(2), 49–57. doi:10.5032/jae.1991.02049 Garcia, A. I. (2013). Developing recruitment messages for potential Hispanic students.
(Unpublished master’s thesis). Texas Tech University, Lubbock, TX.
Lawrence, S., Rayfield, J., Moore, L. L., & Outley, C. (2013). An analysis of FFA chapter demographics as compared to schools and communities. Journal of Agricultural Education, 54(1), 207–219. doi:10.5032/jae.2013.01207
Mallory, M. E., & Sommer, R. (1986). Students show low awareness of agricultural careers. California Agriculture, 40(3), 4–6. Retrieved from
http://ucanr.edu/repositoryfiles/ca4003p4-62934.pdf
Marshall, T., Herring, D., & Briers, G. (1992). Factors associated with enrollment in agricultural science and membership in the FFA in Texas. Journal of Agricultural Education, 33(4), 17–23. doi:10.5032/jae.1992.04017
McMillan, J. H., & Schumacher, S. (2010). Research in education: Evidence-based inquiry (7th ed.). Upper Saddle River, NJ: Pearson Education.
National Research Council (NRC). (1988). Understanding agriculture: New directions for education. Washington, DC: The National Academies Press.
National Research Council (NRC). (2006). Multiple origins, uncertain destinies: Hispanics and the American future. Washington, DC: The National Academies Press.
National Research Council (NRC). (2009). Transforming agricultural education for a changing world. Washington, DC: The National Academies Press.
Pense, S. L., & Leising, J. G. (2004). An assessment of food and fiber systems knowledge in selected Oklahoma high schools. Journal of Agricultural Education, 45(3), 86–96. doi:10.5032/jae.2004.03086
Pense, S. L., Leising, J. G., Portillo, M. T., & Igo, C. G. (2005). Comparative assessment of student agricultural literacy in selected Agriculture in the Classroom programs. Journal of Agricultural Education, 46(3), 107–118. doi:10.5032/jae.2005.03107
Petersen, D., & Assanie, L. (2005). The changing face of Texas: Population projections and implications. Dallas, TX: Federal Reserve Bank of Dallas. Retrieved from
https://www.dallasfed.org/assets/documents/research/pubs/fotexas/fotexas_petersen.pdf Riedel, J. S. (2006). Effects of an introductory agricultural education course on agricultural
literacy and perceptions of agriculture in urban students (Unpublished master’s thesis). North Carolina State University, Raleigh, NC.
Roberts, T. G., Hall, J. L., Briers, G. E., Gill, E., Shinn, G. C., Larke, A., Jr., & Jaure, P. (2009). Engaging Hispanic students in agricultural education and the FFA: A 3-year case study. Journal of Agricultural Education, 50(3), 69–80. doi:10.5032/jae.2009.03069
Talbert, B. A., & Larke, A., Jr. (1995a). Factors influencing minority and non-minority students to enroll in an introductory agriscience course in Texas. Journal of Agricultural
Education, 36(1), 38–45. doi:10.5032/jae.1995.01038
Talbert, B. A., & Larke, A., Jr. (1995b). Minority students’ attitudes toward agricultural careers. NACTA Journal, 39(1), 14–17.
Wiley, Z. Z., Bowen, B. E., Bowen, C. F., & Heinsohn, A. L. (1997). Attitude formulation of ethnic minority students toward the food and agricultural sciences. Journal of
Agricultural Education, 38(2), 21–29. doi:10.5032/jae.1997.02021
Isabel M. Whitehead is an undergraduate Agricultural Education student in the Department of Animal Science at Sul Ross State University, Alpine, Texas.
Dr. Christopher M. Estepp is an assistant professor of Agricultural Education in the Department of Animal Science at Sul Ross State University, Alpine, Texas.
Acknowledgements