The Physiological Response of Two Green
Calcifying Algae from the Great Barrier Reef
towards High Dissolved Inorganic and
Organic Carbon (DIC and DOC) Availability
Friedrich Wilhelm Meyer1*, Nikolas Vogel1,2, Mirta Teichberg1, Sven Uthicke2, Christian Wild1,3
1Department of Ecology, Leibniz Center for Tropical Marine Ecology (ZMT), Bremen, Germany,
2Australian Institute of Marine Science, Townsville, Queensland, Australia,3Faculty of Biology and Chemistry, University of Bremen, Germany
Abstract
Increasing dissolved inorganic carbon (DIC) concentrations associated with ocean acidifi-cation can affect marine calcifiers, but local factors, such as high dissolved organic carbon (DOC) concentrations through sewage and algal blooms, may interact with this global fac-tor. For calcifying green algae of the genusHalimeda, a key tropical carbonate producer that often occurs in coral reefs, no studies on these interactions have been reported. These data are however urgently needed to understand future carbonate production. Thus, we investigated the independent and combined effects of DIC (pCO2402μatm/ pHtot8.0 and 996μatm/ pHtot7.7) and DOC (added as glucose in 0 and 294μmol L-1) on growth, calcifica-tion and photosynthesis ofH.macrolobaandH.opuntiafrom the Great Barrier Reef in an incubation experiment over 16 days. High DIC concentrations significantly reduced dark calcification ofH.opuntiaby 130 % and led to net dissolution, but did not affectH. macro-loba. High DOC concentrations significantly reduced daily oxygen production ofH.opuntia
andH.macrolobaby 78 % and 43 %, respectively, and significantly reduced dark calcifica-tion ofH.opuntiaby 70%. Combined high DIC and DOC did not show any interactive effects for both algae, but revealed additive effects forH.opuntiawhere the combination of both factors reduced dark calcification by 162 % compared to controls. Such species-specific dif-ferences in treatment responses indicateH.opuntiais more susceptible to a combination of high DIC and DOC thanH.macroloba. From an ecological perspective, results further sug-gest a reduction of primary production forHalimeda-dominated benthic reef communities under high DOC concentrations and additional decreases of carbonate accretion under ele-vated DIC concentrations, whereH.opuntiadominates the benthic community. This may reduce biogenic carbonate sedimentation rates and hence the buffering capacity against further ocean acidification.
a11111
OPEN ACCESS
Citation:Meyer FW, Vogel N, Teichberg M, Uthicke S, Wild C (2015) The Physiological Response of Two Green Calcifying Algae from the Great Barrier Reef towards High Dissolved Inorganic and Organic Carbon (DIC and DOC) Availability. PLoS ONE 10(8): e0133596. doi:10.1371/journal.pone.0133596
Editor:Guillermo Diaz-Pulido, Griffith University, AUSTRALIA
Received:September 7, 2014
Accepted:June 29, 2015
Published:August 12, 2015
Copyright:© 2015 Meyer et al. This is an open access article distributed under the terms of the Creative Commons Attribution License, which permits unrestricted use, distribution, and reproduction in any medium, provided the original author and source are credited.
Data Availability Statement:Data are available from: (http://dx.doi.org/10.6084/m9.figshare. 1478016).
Introduction
Marine calcifiers are facing both global and local threats due to human induced environmental changes. On a global scale, increased emissions from fossil fuel combustion lead to an increased carbon dioxide (CO2) concentration in the atmosphere [1]. The dissolution of an increased
amount of CO2in the world’s ocean leads to an elevated bicarbonate concentration and a
low-ered pH of the oceans, causing ocean acidification (OA) and reducing the saturation state (Ω) of carbonates in seawater. Depending on different scenarios, the atmospheric concentration of CO2is predicted to rise from today’s level of app. 396μatm [2] to between 850 and 1370μatm
by the year 2100 [3]. This increase in CO2or dissolved inorganic carbon (DIC) in the water
affects marine life [4–6], and special focus has been put on the effects on marine calcifiers [7– 11] which may exhibit a resulting loss in calcification and a weakened carbonate structure [5,12].
Calcifying green algae of the genusHalimedaplay a major role in sediment formation and provide habitat for many species [13–16]. Because of their high abundance and fast growth [17],Halimeda opuntia(Linnaeus) J.V. Lamouroux, 1816 is one of the most prominent species of its genus, also in the Great Barrier Reef (GBR).H.opuntiarepresents the“sprawler”type, spreading out and growing attached to rock, sand or soft substrate; whereas another species of this genus,Halimeda macroloba, Decaisne, 1841, is a typical sand dweller, usual found in lagoon-like environments. Hence, recent studies investigated the effect of OA on the calcifica-tion of different species ofHalimedaand found that calcification was reduced in terms of nee-dle size of the calcium carbonate deposited or reduced inorganic carbon content, while photosynthetic activity was stable or increased by OA compared to controls [7,18–22].
In addition to the global threat OA, marine life is often also facing disturbances on a local scale, such as increased riverine runoff high in inorganic and organic nutrients and sediments. Reefs at inshore locations of the GBR are more exposed to these threats and already undergo changes leading to a shift from coral-dominated to more macro-algae-dominated reefs [23– 25]. An often underrepresented chemical parameter in monitoring of water quality is dissolved organic carbon (DOC) which can fuel bacterial and pathogen growth as observed under the addition of labile sugars [26,27] as well as natural DOC sources [28] and thereby has severe effects on corals [29,30], leading to bleaching, disease spread and eventually mortality [29,30]. Average DOC concentrations in the GBR are 66μmol L-1[31] and can increase in flood plume
to over 200μmol L-1[31] or even 583μmol L-1(7 mg L-1) [32] or higher in other reef settings
[29]. Elevated DOC concentrations, containing highly bioavailable molecules, such as sugars and amino acids, are a result of mostly two processes: increased sewage input connected with river runoff of agricultural land [32–34] and increased release of DOC into the surrounding water by primary producers, mainly benthic and/or planktonic algae [27,35–39]. As the latter is associated with dominance shifts from hard corals to algae during phase shifts, their contri-bution to the available DOC pool becomes more important [27,38,40]. Climate change and increased storm frequencies with more pronounced seasons and higher precipitation [41,42] may also cause higher discharge of rivers, very likely resulting in increased DOC inputs into inshore waters of the GBR that have been found to correlate with high water discharge rates of rivers to the GBR [31,43]. Higher river inputs of DOC into marine waters can also carry less labile, refractory material which is not metabolized as fast by bacteria like as labile sugars [28,44], but can be co-metabolized under the presence of additional labile organic carbon [45].
Keeping in mind the known severe effects of DOC on corals, such as increased bacterial growth and disease spread, bleaching and mortality [26,29,40,46], it is surprising that no com-parable studies have investigated the effects of elevated DOC onHalimedaor other calcifying algae. DOC as a local factor may occur simultaneously with other factors, such as DIC, which
data collection and analysis, decision to publish, or preparation of the manuscript.
occurs on a global scale. Such multi-factor settings may show additive or even synergistic effects of the individual factors. In addition, antagonistic interaction may occur, where one fac-tor reduces the effect of the other, resulting in a decreased organism response. To understand and predict the consequences of multiple factors on key reef species functioning, it is essential to conduct combined manipulation experiments.
Hence, in this study we investigated the independent and combined effect of high DIC and DOC concentrations on the physiology of two key calcifying green algae,H.opuntiaandH. macrolobaduring a 16 day laboratory experiment.
Under elevated DIC concentration, we expect the calcification of both green algae to decrease and alter the inorganic carbon content of the algae. In addition, photosynthesis and connected photosystem parameters such as Fv/Fmand chlorophyll a content will likely decrease. Nutrient
uptake may increase in order to compensate for decreased photosynthetic efficiency. Under ele-vated DOC concentrations, we hypothesise bacterial growth and connected bacterial respiration to increase and to negatively affect algal fitness, leading to reduced photosynthesis and chloro-phyll a contents and ultimately to a reduction of calcification rates. Due to the growing bacterial numbers, we predict nutrient cycling to be enhanced. Hence, uptake rates of organic and inor-ganic nutrients may increase. Under the combination of both factors, we anticipate additive and synergistic effects leading to further reduced primary production and calcification. In response to both treatments, the physiological parameters measured may show correlation and give indi-cation to what extent the physiology of the whole alga is altered.
Material and Methods
Specimen collection and preparation
Individual thalli of both speciesH.opuntia(50 to 100 segments per thallus) andH.macroloba (10–30 segments per thallus) were collected from reefs at Orpheus Island (S 18° 36.737’, E 146° 29.110’) under a GBMPA sampling permit G12/35236.1. Sand dwellingH.macrolobawere pot-ted into 80 mL plastic containers with ordinary beach sand. Both species were kept in 18 L experimental flow-through aquaria under controlled conditions (LED light, Aqua Illumination, 150μmol photons m-2s-1at 12h/12h light-dark cycle, temperature 25°C, salinity 34.3) for two
weeks prior to the start of the experimental treatments.
Experimental setup
Prior to the experiment, two thalli of each alga species were randomly re-allocated to each of the experimental treatments, as described in detail below. The experiment was conducted over 16 days between 24 July and 9 August 2012 at the Australian Institute of Marine Science (AIMS). Three replicate open glass tanks of 18 L volume for the two treatments with different treatment levels were placed in alternating order (a total of 12 tanks, 3 controls, 3 high DIC, 3 high DOC and 3 high DIC and DOC). The treatments werepCO2in ambient and high
avail-ability (403μatm and 996μatm, respectively) and DOC in ambient and high availability
(83 ± 10 and 294 ± 506μmol L-1with DOC added as glucose (D-glucose, Sigma Aldrich,
purity>99.5%). The targetpCO2was 1000μatm and was reached by pH manipulation via
pure CO2gas injection by a potentiometric pH sensors controlled pH stat system (Aqua
Medic, Germany) as described in Vogel and Uthicke [47]. The pH sensors were calibrated daily using Mettler Toledo NIST-/DIN- pH buffers. ThepCO2levels corresponded to
enrichment as it is easy obtainable, shows high bacterial availability and also eases replication. Other sources of DOC such as the collection of algal or coral exudates were not feasible for the extent of this study and quantification, as well as qualification of the DOC used for the treat-ment would be challenging. The DOC treattreat-ment was achieved by additions of 1170μmol L-1
DOC (Glucose, D-Glucose, Sigma Aldrich) twice daily at 8:00 and 20:00. Subsequent dilution resulted in average concentrations of 294μmol L-1over 12 h. To determine the resulting DOC
concentrations due to dilution in the treatments, we measured the DOC concentrations in duplicates from 8:00 after the glucose addition every hour for three hours and then every other hour for eight hours until 18:00. Flow-through rates for the tanks were adjusted to 150 mL min-1using freshly filtered (0.5μm) natural seawater to avoid accumulation of particles that
had not been previously captured by the settlement tanks. To provide additional water move-ment, aquaria pumps (AquaWorld, Australia, 250 L h-1) were placed in each specimen tank. To determine alkalinity (AT), a 50 ml water sample of each tank was drawn at the beginning,
middle and end of the experiment. It was measured by gran-point titration with a Metrohm 855 autosampler (Metrohm, Switzerland) using 0.5 M HCl [50] and was corrected to certified reference material (CRM Batch 106, A. Dickson, Scripps Oceanographic Institute). Carbonate system parameters were calculated with CO2calc software [51] from ATin combination with
pH readings obtained from a multiprobe (WTW 3430, Germany) calibrated with Mettler Toledo NIST-/DIN- pH buffers.
Measurement of water column Biological Oxygen Demand (BOD)
To assess effects of elevated organic or inorganic carbon availability on microbial respiration rates, BOD of the treatment water was measured at the end of the experiment for each treat-ment tank (n = 3). For this purpose, 200 mL of unfiltered seawater were incubated for 24 h in the dark under temperature conditions of the treatments in borosilicate bottles. The O2con-centration (mg L-1and % saturation) as well as salinity and temperature were recorded before and after the incubation, and O2consumption rates were calculated from these two values and
related to water volume and time to mg O2L-1h-1.
Quantification of algae surface area
In order to relate the measured rates of calcification, photosynthesis and nutrient fluxes to indi-vidual surface area of the thalli, the surface area was determined using images of the flattened algae and Image J software. Surface area varied forH.opuntia from5 to 35 cm² and forH. macrolobafrom 4 to 30 cm².
Quantification of Light-/ dark calcification and nutrient fluxes
After 16 days under experimental conditions, two algal thalli from each replicate tank were transferred into individual acid-washed nalgene chambers (200 mL) and incubated for 60 min in light and 60 min in darkness. Water for the incubations was taken from the treatments (fil-tered, 0.5μm) of the corresponding organisms. Therefore, pH of the incubations corresponded
to treatment conditions. DOC in the form of Glucose was added in the concentration of 940μmol L-1prior to each incubation to assure similar concentrations. The background
con-centration of DOC was checked before the incubation and was 83 ± 10μmol L-1. Incubations
movement during the incubation time was maintained using glass-coated magnetic stir bars driven by magnetic stir plates.
Light- and dark calcification rates were determined by the change of ATduring the
incuba-tion related to blanks using the alkalinity anomaly technique [52]. To achieve this, a sample of 50 mL incubation water was titrated as described above for the carbonate system parameters. ATwas calculated by non-linear regression fitting between pH 3.5 and pH 3.0. Calcium
carbon-ate precipitation or dissolution expressed inμM C h-1was calculated by half molar of the
differ-ence between the post incubation and the blank seawater ATreadings, volume of chamber,
time of incubation and organism surface area [53]. For the calculation of daily calcification rates, the data were extrapolated for a 12 h light and 12 h dark cycle using light calcification and dark calcification data obtained from one h incubations.
Nutrient fluxes in the chambers were determined by analysing sub-samples of seawater from light and dark incubations for dissolved inorganic nutrients (DIN) as ammonium (NH4+),
phos-phate (PO3-) and nitrite (NO2-) + nitrate (NO3-) as NOxand total organic carbon (TOC as Non
Particulate Organic Carbon) directly subsequent to the experimental runs. Samples for DIN were filtered using 0.45μm syringe filters and kept frozen at -20°C until measurement by
seg-mented flow analysis (Seal Analytical, USA). Samples for DOC were filtered through 0.45μm,
acidified with 150μL fuming HCl and frozen at -20°C until analysis on a Shimadzu
TOC-5000A (Shimadzu, USA). Nutrient fluxes were calculated and corrected for the fluxes of the blank incubations, related to organism surface area and expressed asμmol cm² h-1.
Measurement of photosynthetic maximum quantum efficiency and
oxygen production
Maximum quantum efficiency (Fv/Fm) of dark adapted algae was determined by Pulse
Ampli-tude Modulation (PAM) fluorometry using a diving PAM (Walz, Germany) and a 6 mm diam-eter fiber optic cable. Fv/Fmmeasurements were conducted, one hour after the lights turned off
automatically. Measurements were taken every evening during the course of the 16d experi-ment and during the acclimation phase before the experiexperi-ment, O2concentrations were
moni-tored continuously during the incubations by three 4-channel O2meters (Firesting,
Pyroscience, Germany), connected to each chamber with fiber optic cables. Net photosynthesis, respiration, and resulting gross photosynthesis were determined inμM O2h-1relative to
organ-ism surface area. In addition, O2consumption was corrected to blank readings from incubation
chambers containing only the respective treatment water. For the calculation of daily oxygen evolution rates, the data were extrapolated for a 12 h light and 12 h dark cycle using net photo-synthesis and respiration data obtained from one h incubations.
Quantification of growth rates
Growth was determined only forH.opuntiaasH.macroloba(a sand dweller) was kept attached to sediment during the course of the incubation, and this would have interfered with the buoyant weight technique [54]. Individual thalli ofH.opuntia(n = 6) were weighed (accu-racy: 0.1 mg, Mettler Toledo, USA) in a custom-build buoyant weight set-up with water jacket and seawater of constant temperature (25°C) and salinity (34.5) at the start and end of the experiment. Growth of the organisms was expressed as daily percentage of weight change over the course of the 16 d experiment.
Quantification of algae pigment content
algae were placed in 15 mL Falcon tubes on ice, and 4 mL of cold ethanol (95% EtOH) was added to extract chlorophyll. To break the inner skeleton of the algae, segments were crushed with a homogenizer, and the samples were heat-shocked in a water bath at 78°C for 5 min. Afterwards, samples were put in a fridge at 4°C for 24 h further extraction, and absorbencies of the supernatant were read at 750 nm and 664 nm on a Powerwave microplate reader (BioTek, USA). Chlacontent of algal thalli were calculated after equations by Nusch [56] and standard-ized to segment fresh weight.
Quantification of carbon and nitrogen contents in algal tissues
Apical segments ofH.opuntiaandH.macroloba(n = 6) were dried at 60°C for 48 h immedi-ately after the incubation. Segments were ground to homogenous powder with a mortar and pestle, and pre-balanced amounts of the homogenate (MX-5 microbalance accuracy: 1μg,
Met-tler Toledo, Germany) were analysed for total nitrogen and total carbon content on a Euro EA elemental analyser (HEKAtech, Germany). Organic carbon was determined on pre-weighted samples after removing Cinorgby acidifying the sample with 300μL concentrated (37%) HCl.
Inorganic carbon content was calculated by subtracting Corgfrom Ctot.
Statistical analyses
All data are given with averages and standard deviation in parentheses. We tested all individual responses for significant differences of the individual and combined treatments using a Two-Way-ANOVA. Data was tested for normality using the Shapiro-Wilk test and for equal vari-ance using the Levene median test. Data of net and gross photosynthesis were log10
trans-formed to meet the criteria of equal variance. The Two Way ANOVA was pertrans-formed with the treatments DIC and DOC as fixed factors and“aquarium”as nested factor. In case the interac-tion term was significant, differences between individual treatment combinainterac-tions were evalu-ated, using a Pairwise Multiple Comparison Procedure (Holm-Sidak method). To further elucidate correlations between response variables, a Pearson product moment correlation was performed and a correlation based Principal Component Analysis (PCA) of all grouped response variables was used to identify covariance among response variables. We considered strong correlation (loadings) of the PC and the response variable to be higher than 0.69. In addition the correlation of NOxfluxes, PO4fluxes and DOC fluxes were plotted in relation to
the respiration rate forH.opuntiaand the Pearson product moment correlation was given. All statistical analyses were conducted using SigmaPlot 12.5, NCSS Statistical Software and Statis-tika 12.0.
Results
Effects of DIC
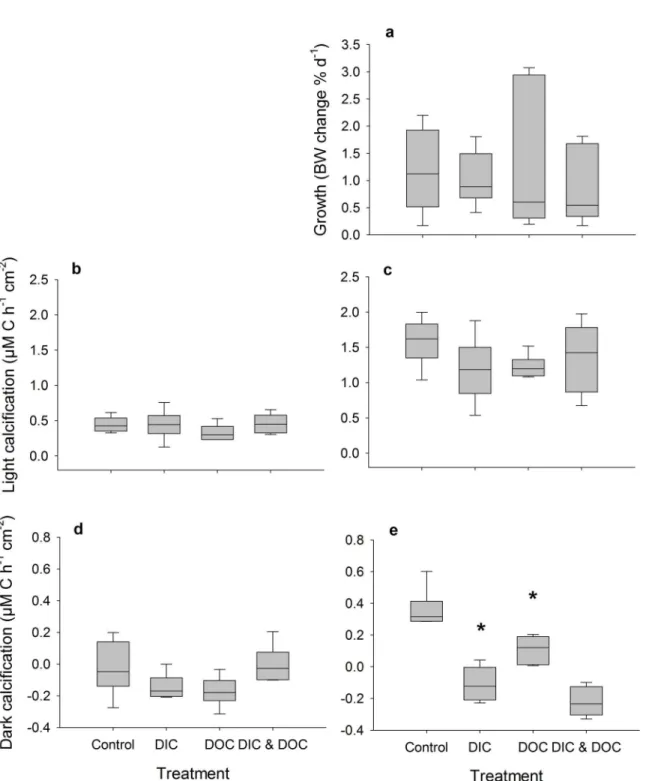
The biological oxygen demand was relatively low and did not differ between control and high DIC conditions. Elevated DIC conditions (Table 1) did not affect the growth rate ofH.opuntia, or light calcification of both species, but significantly reduced dark calcification rate ofH. opun-tiaby 130% (Fig 1, p<0.001, F = 55.05) although there was a tank effect (p = 0.033, F = 3.25).
yield as Fv/Fmor Chlacontent along with inorganic carbon, organic carbon and nitrogen
con-tent were not affected in either species (Figs4and5).
NOxuptake under both dark and light conditions were not affected by high DIC forH.
macroloba, but significantly increased by 45% forH.opuntiaunder dark conditions (S1 Fig, p = 0.02, F = 12.76). A similar pattern was observed for NH4uptake where high DIC did not
affect the uptake of NH4byH.macrolobaunder both light and dark conditions, but
signifi-cantly increased the uptake of NH4byH.opuntiaunder light conditions by 25% (S2 Fig,
p = 0.002, F 12.68) including a tank effect (p = 0.007, F = 5.02). Under dark conditions how-ever, NH4uptake ofH.opuntiawas reduced by 85% (p = 0.003, F = 18.44). Under high DIC
conditions, the PO4uptake of both species was affected. ForH.macroloba, PO4uptake was
reduced under light conditions by 17% and increased under dark conditions by 27% compared to the controls (S3 Fig, p = 0.027, F = 7.27). ForH.opuntia, PO4uptake was significantly
increased under light conditions by 93% (p = 0.01, F = 4.99) and under dark conditions by 42% compared to the controls where also a tank effect (p = 0.048, F = 2.89) was detected. The DOC uptake rates were not significantly affected by DIC for both species and were only slightly reduced forH.macrolobaby 86% and increased forH.opuntiaby about one order of magni-tude under light conditions (S4 Fig).
Effects of DOC
The biological oxygen demand increased by 115% in the high DOC treatment compared to the controls. High DOC concentrations (Table 1) did not affect the growth ofH.opuntia(Fig 1). Light calcification of both species was also not affected by high DOC, but the dark calcification rate was reduced forH.opuntiaby 70% (Fig 1, p<0.001, F = 11.42) and a tank effect was
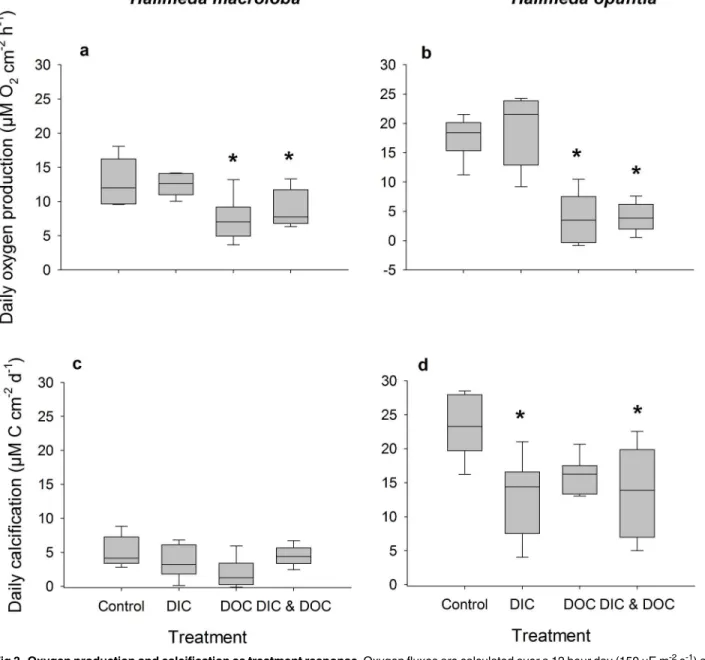
detected (p = 0.033, F = 3.25). Net and gross photosynthesis ofH.macrolobawere also reduced under the DOC treatment by 32 and 25%, respectively (p = 0.005, F = 14.25 for net photosyn-thesis, p = 0.009, F = 11.39 for gross photosynthesis) (Fig 2). Similar results were observed for H.opuntiawith a reduction of only net photosynthesis of 45 and 46%, (p = 0.002, F = 20.5). Respiration was only affected by the high DOC treatment forH.opuntiaand resulted in an increased respiration of 37% (p = 0.004, F = 16.38). As a result of the reduced photosynthesis rates of both species under high DOC, daily oxygen production rates of both species were sig-nificantly reduced by 78% forH.macroloba(p 0.004, F = 15.85) and by 32% fromH.opuntia
(Fig 3, p<0.001, F = 57.97). In contrast, the daily calcification rate of both algal species was
not affected (Fig 3).
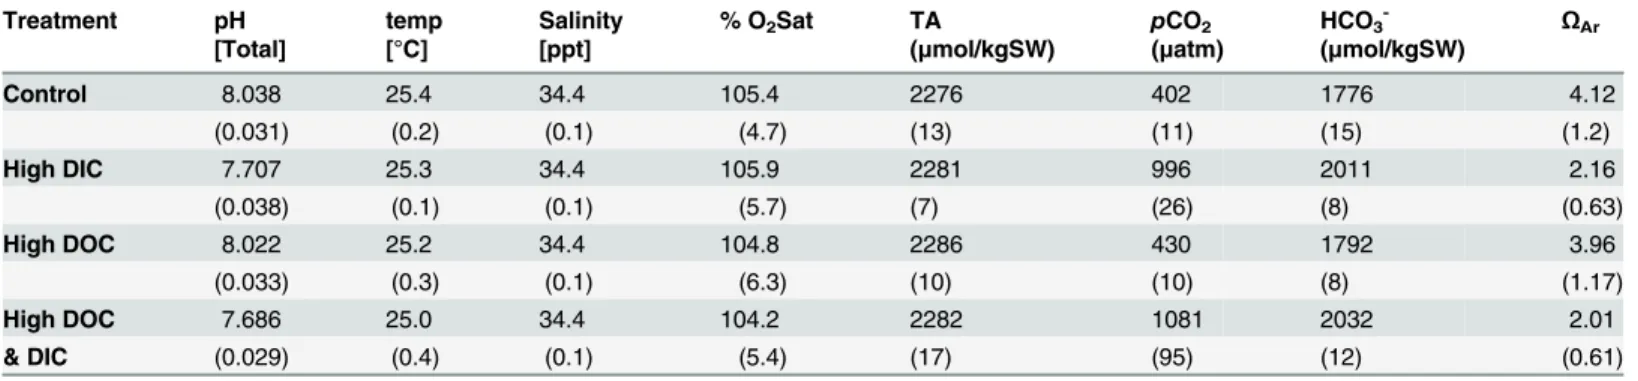
Table 1. Carbonate system parameters.Values calculated using CO2Calc with total alkalinity and pHtotas input parameters.
Treatment pH temp Salinity % O2Sat TA pCO2 HCO3- ΩAr
[Total] [°C] [ppt] (μmol/kgSW) (μatm) (μmol/kgSW)
Control 8.038 25.4 34.4 105.4 2276 402 1776 4.12
(0.031) (0.2) (0.1) (4.7) (13) (11) (15) (1.2)
High DIC 7.707 25.3 34.4 105.9 2281 996 2011 2.16
(0.038) (0.1) (0.1) (5.7) (7) (26) (8) (0.63)
High DOC 8.022 25.2 34.4 104.8 2286 430 1792 3.96
(0.033) (0.3) (0.1) (6.3) (10) (10) (8) (1.17)
High DOC 7.686 25.0 34.4 104.2 2282 1081 2032 2.01
& DIC (0.029) (0.4) (0.1) (5.4) (17) (95) (12) (0.61)
(n = 3 for TA measurements, n = 10 for pH, temp, salinity and O2). Number in parenthesis are standard deviation.
Fig 1. Growth parameters as treatment response after experimental duration of 16 d.Treatments were controls (ambient DIC and DOC), DIC (high DIC and ambient DOC), DOC (ambient DIC and high DOC) and DIC &DOC. Growth is expressed as % change of buoyant weight (a) ofHalimeda opuntia(n = 6). Calcification during light (b, c; 150μE m-2s-1) and dark condition (d, e) ofHalimeda macroloba(b, d, n = 6) andHalimeda opuntia(c, e, n = 6) measured via alkalinity anomaly technique and standardized to surface area. Significant differences compared to controls (p<0.05) are marked with an asterisk. Box plots show the median as well as the upper and lower quartile. Whiskers indicate the 95 percentile.
Fig 2. Oxygen fluxes as treatment response.Oxygen fluxes as net photosynthesis (a, b), respiration (c, d) and growth photosynthesis (e, f) ofHalimeda macroloba(a, c, e; n = 6) andHalimeda opuntia(b, d, f; n = 6). Net photosynthesis measured during light (150μE m-2s-1) conditions and respiration during dark condition and standardized to surface area. Significant differences compared to control (p<0.05) are marked with an asterisk.
Chlacontent was reduced by 13%, forH.opuntiaonly (Fig 4, p = 0.01, F = 8.16). For the elemental composition no significant effects of the DOC treatment was observed, the Corg/N
ratio was slightly increased for both species under the high DOC treatment compared to the controls (Fig 5). ForH.macroloba, Corg/N was increased by 28% from and forH.opuntiaby
21% (Fig 5). NOxuptake of both algae species was increased only under dark conditions by
51% forH.macroloba(p = 0.0027, F = 18.27) and by 117% forH.opuntia(S1 Fig, p = 0.002, F = 3.28). Ammonia uptake rates of both species in light and dark conditions were not affected by elevated DOC concentrations (S2 Fig). PO4fluxes ofH.opuntiaonly increased by 45%
dur-ing dark (S3 Fig, p = 0.03, F = 7.42).
Fig 3. Oxygen production and calcification as treatment response.Oxygen fluxes are calculated over a 12 hour day (150μE m-2s-1) and 12 hour night cycle, ofHalimeda macroloba(a, n = 6) andHalimeda opuntia(b, n = 6). Calcification calculated over a 12 hour day (150μE m-2s-1) and 12 hour night cycle (c, d). Both responses were standardized to surface area. Significant differences compared to control (p<0.05) are marked with an asterisk.
DOC uptake rates forH.macrolobaandH.opuntiawere affected under both dark and light conditions and increased by 458% from (p = 0.032, F = 6.76) in the light and by 369%
(p = 0.007, F = 1.17) in the dark forH.macroloba. ForH.opuntia, DOC uptake rates were highly increased by 6854 and 331% (p<0.001, F = 38.88 and p<0.001, F = 35.59) (S4 Fig) but
a tank effect was detected (p = 0.016, F = 4.00).
Effects of the combined treatment
The biological oxygen demand was significantly increased by the combined treatment com-pared to the DOC treatment by another 81%. In the combined treatment, response variables of the individual treatments showed additive effects as well as synergistic effects. For the dark cal-cification rate ofH.opuntia, negative effects of both DOC and DIC treatment alone were
Fig 4. Photosynthetic efficiency and chlorophyll tissue contents as treatment response.Maximum quantum yield (a, b) of dark- adapted individuals Halimeda macroloba(a, c; n = 6) andHalimeda opuntia(b, d; n = 6). Chlorophyll content (c, d) of both species are standardized to fresh weight. Significant differences compared to control (p<0.05) are marked with an asterisk.
Fig 5. Inorganic and organic C and N algae tissue contents as treatment response.Percent inorganic carbon content (a, b), ratio of organic and inorganic carbon content (c, d) and ratio of organic carbon content to total nitrogen content (e, f) ofHalimeda macroloba(a, c, e; n = 6) andHalimeda opuntia (b, d, f; n = 6).Significant differences compared to control (p<0.05) are marked with an asterisk.
additive and resulted in further decrease of dark calcification by another 30% compared to the DIC and 100% compared to the DOC treatment (Figs1and3). Similarly, NOxuptake ofH.
opuntiaunder dark conditions increased by 90% compared to the DIC treatment and by 48% compared to the DOC treatment (S1 Fig). This effect was synergistic, leading to a higher effect as the sum of both individual treatment effects alone. Antagonistic effects and increase of NH4
uptake was observed forH.opuntiaunder dark conditions where the uptake rate was increased in the presence of both, high DIC and DOC concentrations by 236% (S2 Fig). PO4uptake in
the dark showed additive effects of the individual treatments which lead to a higher PO4uptake
rate of 33% compared to the DIC treatment and 30% compared to the DOC treatment alone
(S3 Fig). DOC uptake rates ofH.opuntiain the dark were 390% higher than in the DIC
treat-ment alone and 90% higher than in the DOC treattreat-ment resulting in an increase of 420% com-pared to the control conditions (S4 Fig).
Connection between the different response variables
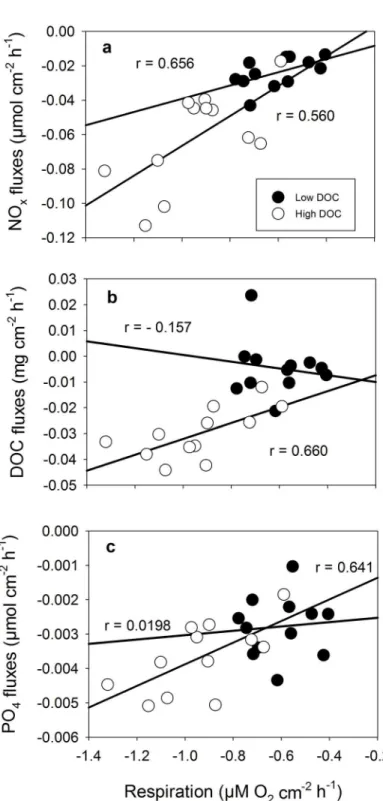
The correlation of nutrient and DOC fluxes against the respiration rate ofH.opuntiashowed that with increasing respiration rates, NOx, PO4and DOC uptake rates increased under high
DOC concentrations (Fig 6). For the uptake of DOC (Fig 6b) as well as PO4(Fig 6c) no
signifi-cant correlation to the respiration rate was detected under low DOC conditions but NOx
uptake rates showed that with increasing respiration rates less NOxis taken up under low DOC
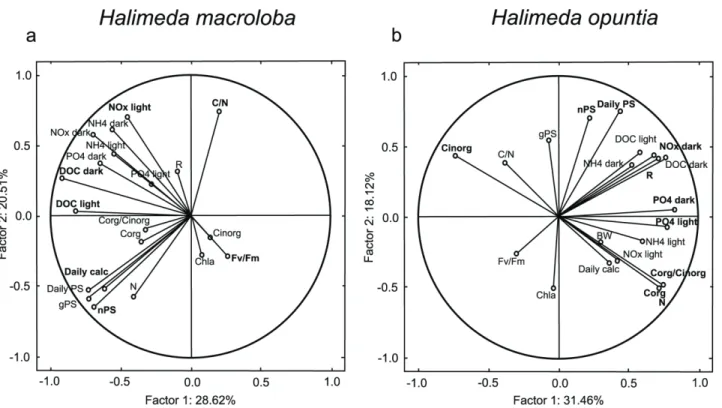
conditions compared to high DOC conditions. The PCA of all data fromH.macroloba com-bined for the DIC treatment and DOC treatment showed that 29 and 21% of the total variance among the response variables could be explained by principal component (PC) 1 and PC2, respectively (Table 2,Fig 7a). The highest correlations (factor loadings) with PC 1 were found in DOC fluxes in the dark and light, the daily calcification rate and net photosynthesis. On PC 2, only the carbon to nitrogen ratio and the total nitrogen content made a significant contribu-tion. ForH.opuntia, 21 and 18% of the total variance among the response variables was found in PC1 and PC2, respectively (Table 3,Fig 7b). The highest factor loadings on PC 1 were found in PO4fluxes under dark and light conditions, NOxfluxes in the dark as well as total nitrogen
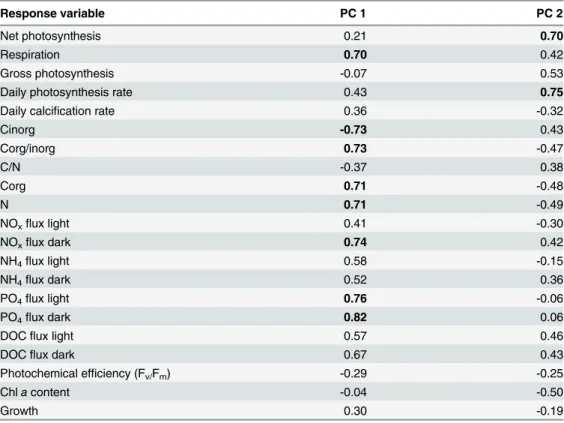
and organic carbon content and inorganic carbon content and the respiration rate. For PC 2, net photosynthesis and the daily photosynthesis rate made a significant contribution.
Discussion
Experimental settings
The treatment values reached during the incubation experiment for both high DIC and DOC, as well as the controls were within natural ranges. For the DIC treatment, the resultingpCO2of
996μatm and 1081μatm (Table 1) for the combined treatment is well represented in the
mid-dle of the most recent RCP’s for the year 2100 that predict ranges of 850 (RCP 6.0) to 1370 (RCP 8.5)μatm CO2[3]. Due to the use of natural seawater, the resulting natural ATof 2280
and a saturation of aragonite of 4.1 under the control conditions well represents present day aragonite saturation states in coral reefs. Due to the higher CO2content of the DIC treatment,
the saturation was reduced by 50% resulting inΩArag= 2.0, well above under-saturated condi-tions, but below thresholds for projected reef growth [57]. Hence, the manipulated conditions of ocean acidification resemble well the potential OA conditions of the year 2100 in both CO2
content as well asΩArag.
For the DOC treatment, comparable data from other studies are scarce, however the result-ing treatment concentration of 294 ± 506μmol L-1(Table 1) lies within or even below those
Fig 6. Correlation of response variables in for different DOC concentrations ofHalimeda opuntia.(a) NOxfluxes, (b) DOC fluxes and (c) PO4fluxes versus respiration at low (filled circles) and high (empty circles) DOC concentration. Pearson’s correlation coefficient (r) is given for each relationship for low and high DOC concentration.
compared to reported DOC concentrations in the GBR between 66μmol L-1[31] and
583μmol L-1(7 mg L-1) [32], the DOC concentration in our study (294 to 800μmol L-1) are
well within described ranges for DOC concentrations. Although in natural reef settings, the DOC pool might be composed of a multitude of substances, the part of labile DOC used in this study reflects upper ranges of concentrations found under disturbed reef conditions [29]. The average treatment level, therefore was low compared to studies and environmental settings named above.
Effects of DIC
Our results show that under elevated DIC conditions, the process of calcification is the most influenced, while primary production and photosynthetic performance stay relatively stable. We could not find an effect of high DIC on the calcification or photosynthesis ofH.macroloba, butH.opuntiashowed a decreased daily calcification rate, primarily due to the reduction in the dark calcification rate. This is in line with recent research onH.opuntiathat showed a reduction in calcification ofH.opuntiaunder OA conditions, but no reduction of calcification of a relatedHalimedaspecies (Halimeda taenicola)[22]. Other studies however did not find an effect of OA on the calcification ofH.opuntia[19], but showed that inorganic carbon content was reduced. This could indicate an effect of reduced calcification. Another study however found high reduction in calcification, photosynthesis, and photochemical efficiency ofH. macrolobaunder OA conditions [20]. One explanation for the different responses towards OA we observed forH.macrolobaandH.opuntiacould be the different morphology as already dis-cussed for other species comparisons [18,20,22]. In addition we detected a tank effect for this parameter measured which could have altered the effect of DIC and DOC on calcification and
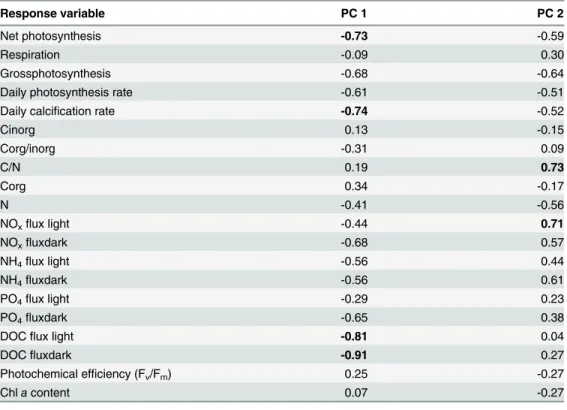
Table 2. Factor loadings of principal components (PC) 1 (28.62% total variance) and PC 2 (20.51% total variance) for all response variable measured forHalimeda macroloba.Values were obtained using a correlation based PCA and values considered to weigh heavy (>0.69) are marked in bold.
Response variable PC 1 PC 2
Net photosynthesis -0.73 -0.59
Respiration -0.09 0.30
Grossphotosynthesis -0.68 -0.64
Daily photosynthesis rate -0.61 -0.51
Daily calcification rate -0.74 -0.52
Cinorg 0.13 -0.15
Corg/inorg -0.31 0.09
C/N 0.19 0.73
Corg 0.34 -0.17
N -0.41 -0.56
NOxflux light -0.44 0.71
NOxfluxdark -0.68 0.57
NH4flux light -0.56 0.44
NH4fluxdark -0.56 0.61
PO4flux light -0.29 0.23
PO4fluxdark -0.65 0.38
DOCflux light -0.81 0.04
DOCfluxdark -0.91 0.27
Photochemical efficiency (Fv/Fm) 0.25 -0.27
Chlacontent 0.07 -0.27
reduced or increased the effect we measured.H.macrolobaexhibits lower photosynthetic and calcification rates compared toH.opuntia. The demand for energy to keep the calcification process high is therefore likely higher inH.opuntia. Hence, respiration under dark conditions is also likely to be higher which may enhance effects of DIC due to the addition of respiratory CO2and thereby explain the observed dissolution under dark conditions. Observations of
flume experiments withHalimedashowed similar results, where under ambient CO2
condi-tions, calcification during day-time was balanced out during night-time [58]. In order to main-tain high photosynthetic activity, more inorganic nutrients may also be taken up. This may explain the higher NOxas well as NH4uptake observed during dark conditions. This effect has
not been described before, but evidence from nutrient enrichment experiments suggest a better performance ofH.opuntiaunder inorganic nutrient-enriched OA conditions [19].
Effects of DOC
Compared to the more species-specific effect of high DIC, elevated DOC had a negative effect on both algae species. To our knowledge this is the first study that revealed effects of organic carbon enrichment on macroalgae. We were able to show that elevated DOC conditions have a strong negative impact on the photosynthetic performance of bothHalimedaspecies and on dark calcification forH.opuntia. A species-specific trend appears under elevated DOC condi-tions asH.opuntiaalso suffers from a reduction in photochemical efficiency and Chlacontent. Together with the reduction in photosynthesis, the elevated DOC conditions may favor non-beneficial or even harmful bacterial growth on the algae itself as also observed by Kuntz et al. [26] on corals. This is supported by higher uptake rates of DOC by bacteria under the high DOC treatment, which may lead to a reduction of the photosynthetic apparatus via proteolysis from bacterial-derived enzymes and also co-competition for space and nutrients and reduction
Fig 7. Principal components (PC) 1 and PC 2 ofHalimeda macroloba(a) andH.opuntia(b) for all response variable measured.Values were obtained using a correlation based PCA and values considered to weigh heavy (>0.69) are marked in bold.
of the nutrient/gas exchange over the algae tissue [59]. Net uptake of DOC most likely took place by bacteria, asHalimedahas been shown to release very little DOC or show net uptake compared to rapid uptake of labile DOC by bacteria [35,36]. The bacteria were introduced with the algae to the experimental tanks, were not removed, and therefore showed a strong treat-ment response. Less filtration of the flow through water could have increased the overall O2
consumption, however under high flowthrough rates, accumulation is assumed to be minimal. As different studies have shown,Halimedacan also exhibit net release of DOC [27,60] which does not lead to the loss of primary production as observed in the present study. The composi-tion of DOC however is very different from pure glucose as used in this study and my favour its own, beneficial bacterial community [39,61]. The different metabolic rates of the algae may explain the different intensity of reaction towards the treatment in which the more structured morphology ofH.opuntiamay favor more bacterial growth due to higher substrate availability. This is supported by the correlation analysis of the response variables for this species which shows that as respiration rates increase, the uptake rates of NOx, PO4and also DOC increase
under high DIC conditions (Fig 6). Under a future scenario where elevated DOC from river runoff concentrations are connected to elevated N and P concentration, a N and P surplus may in low concentrations benefit the algal fitness and compensate for a loss in primary productiv-ity. However, nutrient uptake under high N and P conditions also increases [18], which leads to a higher demand for energy which may not be compensated by the negative effect of high DOC concentrations on the primary production of the alga. In addition, elevated P and N con-centrations may favour fast growing, turf and fleshy algae that are in direct competition with Halimeda[60].
Table 3. Factor loadings of principal components (PC) 1 (31.46% of total variance) and PC 2 (18.12% of total variance) for all response variable measured forHalimeda opuntia.Values were obtained using a correlation based PCA and values considered to weigh heavy (>0.69) are marked in bold.
Response variable PC 1 PC 2
Net photosynthesis 0.21 0.70
Respiration 0.70 0.42
Gross photosynthesis -0.07 0.53
Daily photosynthesis rate 0.43 0.75
Daily calcification rate 0.36 -0.32
Cinorg -0.73 0.43
Corg/inorg 0.73 -0.47
C/N -0.37 0.38
Corg 0.71 -0.48
N 0.71 -0.49
NOxflux light 0.41 -0.30
NOxflux dark 0.74 0.42
NH4flux light 0.58 -0.15
NH4flux dark 0.52 0.36
PO4flux light 0.76 -0.06
PO4flux dark 0.82 0.06
DOCflux light 0.57 0.46
DOCflux dark 0.67 0.43
Photochemical efficiency (Fv/Fm) -0.29 -0.25
Chlacontent -0.04 -0.50
Growth 0.30 -0.19
Effects of the combined treatment
Under the combination of both treatments, this study observed additive effects for dark calcifi-cation, respiration, and DOC fluxes, indicating that exposure to both factors increases the stress on the algae. As dark calcification further decreased under the presence of both factors com-pared to the individual factors, it is likely that under future conditions when both factors are present, the investigated algae species will experience loss in total calcification. Over the course of the relatively short experiment, however, we could not observe an interactive negative effect on calcification. The positive interaction, leading to a synergism in NOxuptake indicates that
physiological responses are not always additive, but depend on the level of the other factor pres-ent. The observed additive effect on DOC uptake may be explained by DOC-facilitated bacterial growth on the algae [38] which was further enhanced under the high DIC treatment. An increased degradation of polysaccharides has been described under elevated DIC conditions [61] which could explain the increase of DOC uptake rates under the combined treatment com-pared to the high DOC treatment alone. These changes in microbial degradation processes have been assigned to altered catabolic enzymatic activities [61] while rates of primary productions remain stable [62]. This is also in line with the observations of the biological oxygen demand which also showed an interactive effect of the combined treatment and further increased com-pared to the high DOC treatment, but did not change under high DIC concentrations alone.
Connection and correlation between the different response variables
We found that many response variables were highly correlated. Daily calcification, photosyn-thesis, Cinorg, Corg, Chlacontent and photochemical efficiency had a high contribution on theprincipal components (PC) of both algal species, indicating that the responses towards both environmental factors were strongly associated with those variables. This is in line with our observations that the photosynthetic performance under elevated DOC conditions and the cal-cification process under elevated DIC conditions were primarily affected.
Ecological perspective and outlook
The present study showed that there are strong species-specific responses by macroalgae of the genusHalimedatowards both applied environmental factors. Depending on the metabolic activity, expressed as the respiration rates, the effect of high and combined DIC and DOC exposure onH.opuntiawas much more pronounced than onH.macroloba. This is the first study that indicates potential reduction of primary production for algae-dominated benthic communities under high DOC concentrations. Under the presence of both factors, additive as well as synergistic effects further reduced primary production and increased nutrient uptake rates. For further assessment of carbon production rates in coral reefs, not only different factors have to be considered, but also their interactive physiological effects.
shift of species with heavily calcified (in this caseH.opuntia) domination to a less calcified, less productive species (in our caseH.macroloba) which may have severe impacts on the overall carbon budget of reefs, carbon fixation rates and future buffer capacities against further acidification.
Supporting Information
S1 Fig. NOxfluxes as treatment response.Fluxes are calculated from light (150μE m-2s-1) (a,
b) and dark incubations (c, d) ofHalimeda macroloba(a, c; n = 6) andHalimeda opuntia(a, b; n = 6).Significant differences compared to control (p<0.05) are marked with an asterisk.
(TIF)
S2 Fig. NH4fluxes as treatment response.Fluxes calculated from light (150μE m-2s-1) (a, b)
and dark incubations (c, d) ofHalimeda macroloba(a, c; n = 6) andHalimeda opuntia(a, b; n = 6).Significant differences compared to control (p<0.05) are marked with an asterisk.
(TIF)
S3 Fig. PO4fluxes as treatment response.Fluxes calculated from light (150μE m-2s-1) (a, b)
and dark incubations (c, d) ofHalimeda macroloba(a, c; n = 6) andHalimeda opuntia(b, d; n = 6).Significant differences compared to control (p<0.05) are marked with an asterisk.
(TIF)
S4 Fig. DOC fluxes as treatment response.Fluxes calculated from light (150μE m-2s-1) (a, b)
and dark incubations (c, d) ofHalimeda macroloba(a, c; n = 6) andHalimeda opuntia(b, d; n = 6).Significant differences compared to control (p<0.05) are marked with an asterisk.
(TIF)
S5 Fig. DOC concentrations over 12 hours in the high DOC treatment.Time series mea-surement (08:00 am until 07:00 pm) after addition of 1170μmol L-1DOC as glucose and a
background concentration (unfilled circles) of 76 and 97μmol L-1DOC. Filled circles indicate
sampling points (n = 2) for DOC analysis of the high DOC treatment and unfilled circles of the controls (n = 2 for each point).
(TIF)
S1 Table. Statistical results.Results of Two Way ANOVA for both species: Halimeda opuntia and H. macroloba with DIC and DOC as fixed factors and aquaria as nested factor. Significant results are marked bold with an asterisk ().
(DOCX)
Acknowledgments
The authors would like to thank Jane Wu Won at AIMS for the support with the analysis of the TOC samples. In addition, we thank Florita Flores (general assistance), Michelle Liddy (field + lab assistance), and Dorothea Dasbach for the analysis of the C/N samples.
Author Contributions
References
1. Rogelj J, Meinshausen M, Knutti R (2012) Global warming under old and new scenarios using IPCC cli-mate sensitivity range esticli-mates. Nat Clim Chang 2: 248–253. Available:http://www.nature.com/ doifinder/10.1038/nclimate1385. Accessed 12 March 2012.
2. Dlugokencky E, Tans P (2013) Trends in Atmospheric Carbon Dioxide: Recent Global CO2. Available: www.esrl.noaa.gov/gmd/ccgg/trends/.
3. Moss RH, Edmonds JA, Hibbard KA, Manning MR, Rose SK, van Vuuren D,P et al. (2010) The next generation of scenarios for climate change research and assessment. Nature 463: 747–756. Available: http://dx.doi.org/10.1038/nature08823. Accessed 9 January 2014. doi:10.1038/nature08823PMID: 20148028
4. Fabricius KE, Langdon C, Uthicke S, Humphrey C, Noonan S, De'ath G et al. (2011) Losers and win-ners in coral reefs acclimatized to elevated carbon dioxide concentrations. Nat Clim Chang 1: 165– 169. Available:http://www.nature.com/doifinder/10.1038/nclimate1122. Accessed 10 June 2011.
5. Manzello D, Kleypas J (2008) Poorly cemented coral reefs of the eastern tropical Pacific: Possible insights into reef development in a high-CO2world. Proc Natl Acad Sci U S A 105: 10450–10455. Avail-able:http://www.pnas.org/content/105/30/10450.abstract. Accessed 10 July 2013. doi:10.1073/pnas. 0712167105PMID:18663220
6. Crook ED, Cohen AL, Rebolledo-Vieyra M, Hernandez L, Paytan A (2013) Reduced calcification and lack of acclimatization by coral colonies growing in areas of persistent natural acidification. Proc Natl Acad Sci U S A 110: 11044–11049. Available:http://www.ncbi.nlm.nih.gov/pubmed/23776217. Accessed 7 November 2013. doi:10.1073/pnas.1301589110PMID:23776217
7. Ries JB, Cohen AL, McCorkle DC (2009) Marine calcifiers exhibit mixed responses to CO2-induced ocean acidification. Geology 37: 1131–1134. Available:http://www.unc.edu/~jries/Ries_2010_ EARTH_ShellShocked_Biolgical_Effects_of_Ocean_Acidification.pdf. Accessed 6 July 2011.
8. Fabry VJ, Seibel B a, Feely R a, Orr JC (2008) Impacts of ocean acidification on marine fauna and eco-system processes. ICES J Mar Sci 65: 414–432. Available:http://icesjms.oxfordjournals.org/cgi/doi/ 10.1093/icesjms/fsn048.
9. Doney SC, Fabry VJ, Feely RA, Kleypas J a. (2009) Ocean Acidification: The Other CO2Problem. Ann Rev Mar Sci 1: 169–192. Available:http://www.annualreviews.org/eprint/QwPqRGcRzQM5ffhPjAdT/ full/10.1146/annurev.marine.010908.163834. Accessed 28 April 2014. PMID:21141034
10. Dupont S, Ortega-Martínez O, Thorndyke MC (2010) Impact of near-future ocean acidification on echi-noderms. Ecotoxicology 19: 449–462. Available:http://www.ncbi.nlm.nih.gov/pubmed/20130988. Accessed 28 June 2011. doi:10.1007/s10646-010-0463-6PMID:20130988
11. Anthony KRN, Kline DI, Diaz-Pulido G, Dove SG, Hoegh-Guldberg O (2008) Ocean acidification causes bleaching and productivity loss in coral reef builders. Proc Natl Acad Sci U S A 105: 17442– 17446. Available:http://www.ncbi.nlm.nih.gov/pubmed/18988740. doi:10.1073/pnas.0804478105 PMID:18988740
12. Kleypas J a, Feely R, Fabry V, Langdon C (2005) Impacts of ocean acidification on coral reefs and other marine calcifiers: a guide for future research. Rep a Work held 18–20 April 2005, St Petersburg, FL, Spons by NSF, NOAA, US Geol Surv: 88. Available:http://scholar.google.com/scholar?hl = en&btnG=Search&q = intitle:Impacts+of+Ocean+Acidification+on+Coral+Reefs+and+Other+Marine +Calcifiers+:+A+Guide+for#0. Accessed 10 August 2011.
13. Wefer G (1980) Carbonate production by algae Halimeda, Penicillus and Padina. Nature 285: 323– 324. Available:http://www.nature.com/nature/journal/v285/n5763/abs/285323a0.html. Accessed 11 November 2011.
14. Multer HG (1988) Growth rate, ultrastructure and sediment contribution ofHalimeda incrassataand Halimeda monile, Nonsuch and Falmouth Bays, Antigua, W.I. Coral Reefs 6: 179–186. Available: http://www.springerlink.com/index/10.1007/BF00302014.
15. Freile D, Milliman JD, Hillis L (1995) Leeward bank margin Halimeda meadows and draperies and their sedimentary importance on the western Great Bahama Bank slope. Coral Reefs 14: 27–33. Available: http://link.springer.com/10.1007/BF00304068. Accessed 21 February 2014.
16. Rees S a, Opdyke BN, Wilson P a, Henstock TJ (2006) Significance ofHalimedabioherms to the global carbonate budget based on a geological sediment budget for the Northern Great Barrier Reef, Austra-lia. Coral Reefs 26: 177–188. Available:http://link.springer.com/10.1007/s00338-006-0166-x. Accessed 21 February 2014.
18. Robbins LL, Knorr PO, Hallock P (2009) Response ofHalimedato ocean acidification: field and labora-tory evidence. Biogeosciences Discuss 6: 4895–4918. Available:http://www.biogeosciences-discuss. net/6/4895/2009/.
19. Hofmann LC, Heiden J, Bischof K, Teichberg M (2014) Nutrient availability affects the response of the calcifying chlorophyte Halimeda opuntia (L.) J.V. Lamouroux to low pH. Planta 239: 231–242. Avail-able:http://www.ncbi.nlm.nih.gov/pubmed/24158465. Accessed 23 January 2014. doi:10.1007/ s00425-013-1982-1PMID:24158465
20. Sinutok S, Hill R, Doblin MA, Wuhrer R, Ralph PJ (2011) Warmer more acidic conditions cause decreased productivity and calcification in subtropical coral reef sediment-dwelling calcifiers. Limnol Oceanogr 56: 1200–1212. Available:http://cat.inist.fr/?aModele = afficheN&cpsidt=24362064. Accessed 21 February 2014.
21. Sinutok S, Hill R, Doblin MA, Kühl M, Ralph PJ (2012) Microenvironmental changes support evidence of photosynthesis and calcification inhibition in Halimeda under ocean acidification and warming. Coral Reefs 31: 1201–1213. Available:http://link.springer.com/10.1007/s00338-012-0952-6. Accessed 21 February 2014.
22. Price N, Hamilton S, Tootell J, Smith J (2011) Species-specific consequences of ocean acidification for the calcareous tropical green algaeHalimeda. Mar Ecol Prog Ser 440: 67–78. Available:http://www. int-res.com/abstracts/meps/v440/p67-78/. Accessed 31 October 2011.
23. Cooper TF, Uthicke S, Humphrey C, Fabricius KE (2007) Gradients in water column nutrients, sediment parameters, irradiance and coral reef development in the Whitsunday Region, central Great Barrier Reef. Estuar Coast Shelf Sci 74: 458–470. Available:http://www.sciencedirect.com/science/article/pii/ S0272771407001412.
24. Fabricius KE, De’ath G, McCook LJ, Turak E, Williams DM (2005) Changes in algal, coral and fish assemblages along water quality gradients on the inshore Great Barrier Reef. Mar Pollut Bull 51: 384– 398. Available:http://www.sciencedirect.com/science/article/pii/S0025326X04003923. PMID:15757737
25. Fabricius KE, De’ath G, De’Ath G (2004) Identifying ecological change and Its causes: A case study on coral reefs. Ecol Appl 14: 1448–1465. Available:http://www.esajournals.org/doi/abs/10.1890/03-5320. Accessed 27 July 2011.
26. Kuntz NM, Kline DI, Sandin SA, Rohwer F (2005) Pathologies and mortality rates caused by organic carbon and nutrient stressors in three Caribbean coral species. Mar Ecol Prog Ser 294: 173–180. Available:http://www.int-res.com/abstracts/meps/v294/p173-180/.
27. Haas AF, Nelson C, Kelly L, Carlson C (2011) Effects of coral reef benthic primary producers on dis-solved organic carbon and microbial activity. PLoS One 6. Available:http://dx.plos.org/10.1371/ journal.pone.0027973. Accessed 17 January 2014.
28. Gregg A, Hatay M, Haas AF, Robinett N, Barott KL, Vermeij M, et al. (2013) Biological oxygen demand optode analysis of coral reef-associated microbial communities exposed to algal exudates. PeerJ 1: e107. Available:http://www.pubmedcentral.nih.gov/articlerender.fcgi?artid=3719127&tool = pmcentrez&rendertype = abstract. Accessed 25 April 2014. doi:10.7717/peerj.107PMID:23882444
29. Kline DI, Kuntz NM, Breitbart M, Knowlton N, Rohwer F (2006) Role of elevated organic carbon levels and microbial activity in coral mortality. Mar Ecol Prog Ser 314: 119–125. Available:http://www.int-res. com/abstracts/meps/v314/p119-125/.
30. Haas AF, Al-Zibdah M, Wild C (2009) Effect of inorganic and organic nutrient addition on coral—algae assemblages from the Northern Red Sea. J Exp Mar Bio Ecol 380: 99–105. Available:http:// linkinghub.elsevier.com/retrieve/pii/S0022098109003712. Accessed 22 June 2011.
31. Schaffelke B, Carleton J, Skuza M, Zagorskis I, Furnas MJ (2012) Water quality in the inshore Great Barrier Reef lagoon: Implications for long-term monitoring and management. Mar Pollut Bull 65: 249– 260. Available:http://www.ncbi.nlm.nih.gov/pubmed/22142496. Accessed 6 September 2014. doi:10. 1016/j.marpolbul.2011.10.031PMID:22142496
32. Ford P, Tillman P, Robson B, Webster IT (2005) Organic carbon deliveries and their flow related dynamics in the Fitzroy estuary. Mar Pollut Bull 51: 119–127. Available:http://www.ncbi.nlm.nih.gov/ pubmed/15757714. Accessed 22 August 2014. PMID:15757714
33. Painter HA, Viney M (1959) Composition of a domestic sewage. J Biochem Microbiol Technol Eng 1: 143–162. Available:http://doi.wiley.com/10.1002/jbmte.390010203. Accessed 28 November 2014.
34. Packett R, Dougall C, Rohde K, Noble R (2009) Agricultural lands are hot-spots for annual runoff pollut-ing the southern Great Barrier Reef lagoon. Mar Pollut Bull 58: 976–986. Available:http://www.ncbi. nlm.nih.gov/pubmed/19303607. Accessed 6 September 2014. doi:10.1016/j.marpolbul.2009.02.017 PMID:19303607
36. Wild C, Haas AF, Naumann MS, Mayr C, El-Zibdah M (2008) Comparative investigation of organic mat-ter release by corals and benthic reef algae—implications for pelagic and benthic microbial metabolism. 11th International Coral Reef Symposium. pp. 7–11. Available:http://www.nova.edu/ncri/11icrs/ proceedings/files/m25-10.pdf. Accessed 20 July 2011.
37. Haas AF, Jantzen C, Naumann MS, Iglesias-Prieto R, Wild C (2010) Organic matter release by the dominant primary producers in a Caribbean reef lagoon: implication for in situ O2 availability. Mar Ecol Prog Ser 409: 27–39. doi:10.3354/meps08631
38. Nelson CE, Goldberg SJ, Wegley Kelly L, Haas AF, Smith JE, Rohwer F, et al. (2013) Coral and macro-algal exudates vary in neutral sugar composition and differentially enrich reef bacterioplankton line-ages. ISME J 7: 962–979. Available:http://www.ncbi.nlm.nih.gov/pubmed/23303369. Accessed 19 November 2013. doi:10.1038/ismej.2012.161PMID:23303369
39. Haas AF, Wild C (2010) Composition analysis of organic matter released by cosmopolitan coral reef-associated green algae. Aquat Biol 10. Available: http://www.int-res.com/abstracts/ab/v10/n2/p131-138/. Accessed 17 January 2014.
40. Hauri C, Fabricius KE, Schaffelke B, Humphrey C (2010) Chemical and physical environmental condi-tions underneath mat- and canopy-forming macroalgae, and their effects on understorey corals. PLoS One 5: e12685. Available:http://dx.doi.org/10.1371/journal.pone.0012685. doi:10.1371/journal.pone. 0012685PMID:20856882
41. Webster PJ, Holland GJ, Curry J a, Chang H-R (2005) Changes in tropical cyclone number, duration, and intensity in a warming environment. Science 309: 1844–1846. Available:http://www.ncbi.nlm.nih. gov/pubmed/16166514. Accessed 5 June 2013. PMID:16166514
42. Knutson TR, McBride JL, Chan J, Emanuel K, Holland G, Landsea C, et al. (2010) Tropical cyclones and climate change. Nat Geosci 3: 157–163. Available:http://www.nature.com/doifinder/10.1038/ ngeo779. Accessed 24 May 2013.
43. Schaffelke B, Thompson A, Carleton J, Cripps E, Davidson J, Doyle J, et al. (2008) Water quality and ecosystem monitoring program: Reef Water Quality Protection Plan: final report. Available:http:// elibrary.gbrmpa.gov.au/jspui/handle/11017/406. Accessed 6 September 2014.
44. Rusch A, Huettel M, Wild C, Reimers CE (2006) Benthic oxygen consumption and organic matter turn-over in organic-poor, permeable shelf sands. Aquat Geochemistry 12: 1–19. doi: 10.1007/s10498-005-0784-x
45. Dinsdale E a, Pantos O, Smriga S, Edwards R a, Angly F, Wegley L, et al. (2008) Microbial ecology of four coral atolls in the Northern Line Islands. PLoS One 3: e1584. Available:http://www.
pubmedcentral.nih.gov/articlerender.fcgi?artid=2253183&tool = pmcentrez&rendertype = abstract. Accessed 10 July 2014. doi:10.1371/journal.pone.0001584PMID:18301735
46. Smith JE, Shaw M, Edwards RA, Obura DO, Pantos O, Sala e, et al. (2006) Indirect effects of algae on coral: algae-mediated, microbe-induced coral mortality. Ecol Lett 9: 835–845. Available:http://www. ncbi.nlm.nih.gov/pubmed/16796574. Accessed 17 January 2014. PMID:16796574
47. Vogel N, Uthicke S (2012) Calcification and photobiology in symbiont-bearing benthic foraminifera and responses to a high CO2environment. J Exp Mar Bio Ecol 424–425: 15–24. Available:http:// linkinghub.elsevier.com/retrieve/pii/S0022098112001736. Accessed 8 August 2012.
48. Meehl GAG, Stocker TF, Collins WD, Friedlingstein P, Gaye T, Gregory JM, et al. (2007) Global climate projections. In: Solomon S, Qin D, Manning M, Chen Z, Marquis M, et al., editors. IPCC, 2007: Climate Change 2007: the physical science basis. contribution of Working Group I to the Fourth Assessment Report of the Intergovernmental Panel on Climate Change. Cambridge University Press, Cambridge, United Kingdom and New York, NY, USA. pp. 747–846. Available:https://publications.csiro.au/rpr/ pub?list=BRO&pid = procite:1452cb7a-9f93-44ea-9ac4-fd9f6fd80a07. Accessed 18 July 2013.
49. Vuuren DP, Edmonds J, Kainuma M, Riahi K, Thomson A, Hibbard K, et al. (2011) The representative concentration pathways: an overview. Clim Change 109: 5–31. Available:http://link.springer.com/10. 1007/s10584-011-0148-z. Accessed 9 January 2014.
50. Uthicke S, Fabricius KE (2012) Productivity gains do not compensate for reduced calcification under near-future ocean acidification in the photosynthetic benthic foraminifer species Marginopora vertebra-lis. Glob Chang Biol 18: 2781–2791. Available:http://doi.wiley.com/10.1111/j.1365-2486.2012.02715. x. Accessed 28 March 2013. doi:10.1111/j.1365-2486.2012.02715.xPMID:24501056
51. Robbins L, Hansen M, Kleypas J, Meylan S (2010) CO2calc—a user-friendly seawater carbon calcula-tor for Windows, Max OS X, and iOS (iPhone). US Geol Surv Open-File Rep 2010–1280: 17. Available: http://scholar.google.com/scholar?q=CO2calc—A+user-friendly+seawater+carbon+calculator+for +Windows,+Max+OS+X,+and+iOS+(iPhone)#0. Accessed 18 July 2013.
53. Gao K, Zheng Y (2009) Combined effects of ocean acidification and solar UV radiation on photosynthe-sis, growth, pigmentation and calcification of the coralline algaCorallina sessilis(Rhodophyta). Glob Chang Biol 16: 2388–2398. Available:http://doi.wiley.com/10.1111/j.1365-2486.2009.02113.x. Accessed 22 July 2011.
54. Jokiel P, Maragos J, Franzisket L (1978) Coral growth: buoyant weight technique. Coral reefs Res methods UNESCO, Paris. Available:http://scholar.google.com/scholar?q=Jokiel+P,+Maragos+J, +Franzisket+L+(1978)+Coral+growth:+buoyant+weight+technique&btnG=&hl = en&as_sdt=0,5#0. Accessed 17 January 2014.
55. Schmidt C, Heinz P, Kucera M, Uthicke S (2011) Temperature-induced stress leads to bleaching in larger benthic foraminifera hosting endosymbiotic diatoms. Limnol Oceanogr 56: 1587–1602. Avail-able:http://www.aslo.org/lo/toc/vol_56/issue_5/1587.html. Accessed 7 June 2013.
56. Nush E (1980) Comparison of different methods for chlorophyll and phaeopigment determination. Arch Hydrobiol Beih 14: 14–36. Available:http://bases.bireme.br/cgi-bin/wxislind.exe/iah/online/? IsisScript = iah/iah.xis&src = google&base=REPIDISCA&lang = p&nextAction = lnk&exprSearch= 144518&indexSearch=ID. Accessed 18 July 2013.
57. Hoegh-Guldberg O, Mumby PJ, Hooten a J, Steneck RS, Greenfield P, Gomez E, et al. (2007) Coral reefs under rapid climate change and ocean acidification. Science 318: 1737–1742. Available:http:// www.ncbi.nlm.nih.gov/pubmed/18079392. Accessed 5 July 2011. PMID:18079392
58. Anthony KRN, Diaz-Pulido G, Verlinden N, Tilbrook B, Andersson a. J (2013) Benthic buffers and boosters of ocean acidification on coral reefs. Biogeosciences 10: 4897–4909. Available:http://www. biogeosciences.net/10/4897/2013/. Accessed 28 November 2014.
59. Cole J (1982) Interactions between bacteria and algae in aquatic ecosystems. Annu Rev Ecol Syst 13: 291–314. Available:http://www.jstor.org/stable/2097070. Accessed 25 May 2014.
60. Delgado O, Lapointe BE (1994) Nutrient-limited productivity of calcareous versus fleshy macroalgae in a eutrophic, carbonate-rich tropical marine environment. Coral Reefs 13: 151–159. Available:http:// link.springer.com/10.1007/BF00301191. Accessed 28 November 2014.
61. Piontek J, Lunau M, Händel N, Borchard C, Wurst M, Engel A (2010) Acidification increases microbial polysaccharide degradation in the ocean. Biogeosciences 7: 1615–1624. Available:http://www. biogeosciences.net/7/1615/2010/. Accessed 26 August 2014.
62. Witt V, Wild C, Anthony KRN, Diaz-Pulido G, Uthicke S (2011) Effects of ocean acidification on micro-bial community composition of, and oxygen fluxes through, biofilms from the Great Barrier Reef. Envi-ron Microbiol 13: 2976–2989. Available:http://www.ncbi.nlm.nih.gov/pubmed/21906222. Accessed 17 January 2014. doi:10.1111/j.1462-2920.2011.02571.xPMID:21906222
63. Wild C, Woyt H, Huettel M (2005) Influence of coral mucus on nutrient fluxes in carbonate sands. Mar Ecol Prog Ser 287: 87–98. Available:http://www.int-res.com/abstracts/meps/v287/p87-98/.