Blood Flow
Khandakar Niaz Morshed1, David Bark Jr.1,2, Marcio Forleo2, Lakshmi Prasad Dasi1,2*
1Department of Mechanical Engineering, Colorado State University, Fort Collins, Colorado, United States of America,2School of Biomedical Engineering, Colorado State University, Fort Collins, Colorado, United States of America
Abstract
Shear stress on blood cells and platelets transported in a turbulent flow dictates the fate and biological activity of these cells. We present a theoretical link between energy dissipation in turbulent flows to the shear stress that cells experience and show that for the case of physiological turbulent blood flow: (a) the Newtonian assumption is valid, (b) turbulent eddies are universal for the most complex of blood flow problems, and (c) shear stress distribution on turbulent blood flows is possibly universal. Further we resolve a long standing inconsistency in hemolysis between laminar and turbulent flow using the theoretical framework. This work demonstrates that energy dissipation as opposed to bulk shear stress in laminar or turbulent blood flow dictates local mechanical environment of blood cells and platelets universally.
Citation:Morshed KN, Bark D Jr, Forleo M, Dasi LP (2014) Theory to Predict Shear Stress on Cells in Turbulent Blood Flow. PLoS ONE 9(8): e105357. doi:10.1371/ journal.pone.0105357
Editor:Dermot Cox, Royal College of Surgeons, Ireland
ReceivedJanuary 8, 2014;AcceptedJuly 23, 2014;PublishedAugust 29, 2014
Copyright:ß2014 Morshed et al. This is an open-access article distributed under the terms of the Creative Commons Attribution License, which permits unrestricted use, distribution, and reproduction in any medium, provided the original author and source are credited.
Funding:Funding from National Institutes of Health (NIH) under Award Number R01HL119824, and the American Heart Association under award 11SDG5170011. The funders had no role in study design, data collection and analysis, decision to publish, or preparation of the manuscript.
Competing Interests:The authors have declared that no competing interests exist. * Email: [email protected]
Introduction
Turbulence is ubiquitous, and is particularly prominent in engineered cardiovascular devices as well as pathophysiological blood flow. There is strong evidence that turbulence impacts the environments of erythrocytes and platelets on the cellular level [1,2] in a manner physically distinct from that known in simple laminar shear flows such as in a viscometer. While our physical understanding of the structure of turbulence and its universal properties has received significant attention in the past [3–7], there is no theory that links the statistical properties of turbulence to shear stresses physically experienced by cells transported in whole blood flow. Shear stress acting on cell membranes is a critical mechanical cue that regulates biological activity [7–10] and therefore a theory relating turbulence to shear stress environment of cells is necessary.
In turbulent blood flow, the complex spatio-temporal fluctua-tions of shear stress leads to hemolysis and platelet activation [11,12]. Such phenomena are critical when designing life saving devices such as artificial hearts, ventricular assist devices, stents, grafts, and heart valves. The phenomena can further impact disease such as in the case of an aortic stenosis or atherosclerosis. Current models that predict stress experienced by blood cells are purely empirical and based on classic experiments [12] that yield paradoxical results under laminar and turbulent conditions [13]. For a comprehensive review of studies on turbulent blood flow related hemolysis and platelet activation, the reader is directed to Refs [12,14–17]. As discussed in Ref [12], despite many of these studies, there has not been a solid physically justifiable connection made between turbulence and the shear stress acting on blood cells and platelets. A strong requirement of a physical theory is that it should make a link, in a manner independent of laminar and
turbulent regimes of flow because the pertinent parameter is flow at the length scale of individual cells, where it is considered laminar. Another aspect that is important to consider is the notion of universality of turbulent structures despite the intermittency issue [6]. Do the universality properties of turbulence hold in the most complex of blood flows considering Newtonian and non-Newtonian properties of blood? If so, will the distribution of shear stress acting on blood cells and platelets be universal? Here the term ‘‘universal’’ is used not to imply homogeneous isotropic turbulence (HIT), but rather loosely to emphasize the significant agreement between the distributions of instantaneous dissipative scales in complex in-homogeneous shear flows with the distribu-tions observed in HIT as well as the robust presence of inertial range scaling[18–21].
surrogate validation of the theory. Finally, we note that the theoretical framework presented in this work is not limited only to blood cells, but applies to any case of suspended cells that are sufficiently smaller than the smallest scales of turbulent motion.
Methods: Theoretical Construction
Theoretical development is initially constrained to turbulent flows where the smallest turbulent eddies are greater than the size of the red blood cell (RBC), i.e. the instantaneous minimum size of turbulent eddy is always.O(10mm). This is an important limit, as it is not possible to physically represent turbulent eddies smaller than the size of the biggest cells with the single-phase approxima-tion of blood. In fact, the single-phase approximaapproxima-tion may very well be susceptible to errors even when local eddies are within two or three times the size of the red-blood cell, i.e.,25mm. For now, let us accept this as a limitation and later discuss repercussions of this assumption. Nevertheless, for turbulent eddies.25mm, the single-phase continuum representation of blood may be consid-ered valid [12]. It is also important to underscore that using a continuum single-phase model of blood cannot be equated to the assumption of RBCs passively seeded on to a continuous medium.
On the contrary, the single-phase representation of blood ‘‘lumps’’ all effects of the physical reality into the constitutive rheology of blood.
The theoretical construction is next focused on whether small scale (dissipative) turbulent structures may be considered Newto-nian or non-NewtoNewto-nian. This is done through order of magnitude arguments combined with existing knowledge about blood rheology. Subsequently, we introduce basic arguments with respect to the nature of turbulent scales of motion in turbulent blood flows expected in the cardiovascular system and artificial devices. Finally, physical arguments are introduced that link turbulence statistics to the distribution of laminar shear stresses acting directly on cells.
Newtonian vs Non-Newtonian
It is well known that whole blood significantly deviates from Newtonian behavior when local bulk shear rates are below the order of 100 s21
[22–24] or when a vessel diameter is less than 100mm [25]. Now, consider the instantaneous turbulent dissipa-tive length scale, g, defined such that the local instantaneous velocity increment (difference), dug, across two points in space separated bygis such that the local Reynolds number defined as
Figure 1. Schematic of blood cells in a turbulent ‘‘eddy’’.
gdug
n *1. This instantaneous length scale is the definition of the
local turbulent dissipative scale and may be regarded as an ‘‘instantaneous’’ Kolmogorov scale [18–20,24,26,27]. Note that no assumptions of local isotropy or homogeneous turbulence are being made in this framework. For such a small dissipative length scale, which in a way is the true measure of the actual size of the smallest eddy, the shear rate within such an eddy can be estimated
ascc_g* dug
g * n
g2. Thus the shear rate within such an eddy is set
purely bynandg. Now, non-Newtonian behavior of blood dictates thatnis dependent oncc_g, which is physiologically O(1) cSt. It is
easy to show that the range ofcc_g* n
g2corresponding to eddies of
sizes 10mmvgv100mm is O102s{1vccgvO105s{1. Based on these order of magnitude estimates, it follows that instanta-neous turbulent eddies in the range 10mmvgv100mm in any cardiovascular blood flow will always be in the Newtonian regime consideringcc_gwO 100s{1
. In other words, any consequence or damage occurring to the cells within these eddies happens while the eddy itself behaves as a Newtonian fluid.
Scales of Motion
With the notion of blood being Newtonian for turbulent eddies 10mm and above, let us examine the scales of turbulent motion for the smallest scales, without the assumption of isotropy or homogeneity. Recall that turbulent flow is characterized by complex spatio-temporal fluctuations,ui, superimposed with the mean velocity field,Ui. These spatio-temporal fluctuations have been phenomenologically represented as turbulent eddies of
varying length scales. It is important to clarify that physically there are no circular ‘‘eddies’’, but the term eddies only refer to the Fourier analogy of representing the fluctuating field as an summation of kinetic energy over ‘‘eddies’’ ranging from the smallest possible scales to the integral length scale. The turbulent
kinetic energy (per unit mass),k~1
2SuiuiT, is transferred across
from large to the small scales (so called energy cascade) with viscous dissipation occurring at the smallest eddies. The Kolmogorov length scale, gK:n3=SET1=4, where n is the
kinematic viscosity and e is the average local kinetic energy dissipation rate (per unit mass), corresponds to the characteristic eddy size based on e. The velocity scale of this eddy equals
ugK~n=gK, and therefore the Reynolds number, ugKgK
n of the
Kolmogorov eddy is unity. In the context of blood damage, several studies have focused on the relevance of the Kolmogorov eddy to predict the capacity of turbulent flow to damage blood cells (reviewed in [12]). WhilegKin theory represents theaveragesize
of the dissipative eddies (for the case of HIT), it does not, in itself, reflect the smallest eddy in a turbulent flow in realistic turbulent flows. In fact, there exist eddies that are a fraction of the Kolmogorov eddy, so called sub-Kolmogorov eddies, arising from the inherently intermittent nature of the instantaneous energy dissipation rate field [5,6]. Intermittency is a property of all turbulent flows which broadly refers to the fluctuations of the
fluctuating velocity gradient tensorsij:1
2 Lui=LxjzLuj=Lxi
and consequently fore~2nsijsij. With energy dissipation rates propor-tional to the square of velocity gradient tensor, the fluctuations ine
Figure 2. Shear Stress (tp) as a function of eddy sizegplotted for increasing hematocrit based on the equation derived using
energy balance.
are far greater and intense, with very large departures from its average. Physically these large positive fluctuations in energy dissipation occur due to local vortex stretching that generate momentarily intense shear regions over very small length scales, much smaller than the Kolmogorov scale itself. In other words, when the energy dissipation rate is locally above the mean energy dissipation magnitude, the corresponding eddy size is sub-Kolmogorov. Thus, the true depiction of micro-environment of cells in realistic turbulent flows corresponds to their tumultuous experiences in a spectrum of dissipative eddies ranging from sub-Kolmogorov scales all the way to the Taylor micro-scale that demarks the largest of the dissipative eddies [6]. Recent turbulence literature estimate the smallest sub-Kolmogorov scales to be of roughly Re1L=4 times smaller than the Kolmogorov scale
[23,26,28]. Here ReL~k 1=2L
n is the local turbulence Reynolds
number defined by the integral length scale, L, and the local turbulent kinetic energy. To date, studies addressing turbulence in blood flow have not taken into consideration the issue of intermittency or the sub-Kolmogorov fluctuations thereby ignor-ing the most damagignor-ing aspects of turbulent flow. In this study, we will consider sub-Kolmogorov fluctuations using direct measure-ments through the definition of the instantaneous turbulent dissipative length scale, g[18–20,24,26,27], while constraining our analysis only to flows where the smallest sub-Kolmogorov
gw10mm.
Local Energy Dissipation and Shear Stress Acting on Cells. Based on the above picture of scale distributions without invoking assumptions of isotropy or homogeneity, and introducing
the notion of sub-Kolmogorov scales, it is now possible to consider a link between macroscopic properties of blood dynamics or eddy scales to the local shear stress acting on blood cells. Figure 1 illustrates a schematic of RBCs in a hypothetical dissipative scale eddy of sizeg. Recall that the velocity scale of this eddy isdug~n g
to yield the condition of locally unit Reynolds number. Given the length scale and velocity scale, the instantaneous energy
dissipa-tion rate corresponding to this smallest eddy isdu
3 g g ~
n3 g4.
Looking at Figure 1, let us now assume that almost all of this energy dissipation physically occurs through viscous straining of plasma fluid between cells and that the rate of energy lost in lysing or activating cells is negligible in comparison to heat generation within plasma. This is a valid assumption if (a) it is known that a very small fraction of cells lyse/activate per unit time, and (b) the strain rate of cell membrane deformation is much smaller (by at least an order of magnitude) than the strain rate of plasma surrounding the cell. The relative difference in the strain rates of the cell membrane and the surrounding plasma represents the efficiency of energy transfer from the fluid to strain-energy stored into the cell membrane. Both (a) and (b) seem valid as hemolysis/ activation in most device and physiological flows occur over prolonged duration and the magnitude of free hemoglobin released is relatively very small compared to the total hemoglobin. In particular, the second condition is valid for cases when blood cells are lysed over a prolonged exposure to shearing forces as opposed to instantaneous lysis which has been observed for whole blood shear stresses .450 Pa [29,30]. Complex cardiovascular devices such as the bileaflet mechanical heart valves imposes shear
Figure 3. Schematic of the valve and points of interest upstream and downstream of the valve.
stresses in the range,15 Pa [14]. Furthermore, (b) is supported by the relatively low energy dissipation for both cytoplasm and membrane deformation in a RBC tank treading in flow, corresponding to O(10215–10213 watts) for shear rates O(102), which extrapolates to O(1028 watt) for shear rates reaching 105s21[31,32].
Given these assumptions, which appear reasonably valid, the rate of energy dissipated within the eddy shown in Figure 1,e, may be approximated to the rate of energy dissipated in the fluid that surrounds cells. The following equation represents the energy balance in watts:
erBVg*mpcc_p2ð1{HÞVg ð1Þ
WhererBis the density of whole blood,Vgis the volume of the eddy,mpis the dynamic viscosity of plasma,cc_pis the strain rate in
the plasma surrounding blood cells, and0vHv1is the fractional hematocrit. It is easy to verify that both sides of the equation have units of power. In the above equation, if the plasma dynamic viscosity is known, then it is straight forward to estimate the viscous shear stress,tp~mpcc_p, within the plasma surrounding the cells as a
function of energy dissipation rate. Strictly, the cells experiencetp,
nottBwhich can be estimated astB~mBcc_B~mB nB
g2. Clearly, it is
evident from a physical basis that the relevant dynamical property of blood flow that dictatestpis the local energy dissipation rate,e.
Recognizing that it is easier to measuregrather thane, we solve
equation 1 fortp~mpcc_pafter substitutinge~ n3
B g4to give:
tp~nB g2
ffiffiffiffiffiffiffiffiffiffiffiffiffiffiffiffim Bmp 1{H
ð Þ
r
ð2Þ
The above equation relates the instantaneous dissipative scaleg
in a general turbulent blood flow to the corresponding shear stress acting on cells. It is important to note thattpandtBare off by a
factortp=tB~ mp mBð1{HÞ
1=2
. For typical values,tpis about 80%
of tB but may easily exceed tB if locallyHw1{
mp mB
. Local
variations in hematocrit under turbulent straining may produce large discrepancies betweentpandtB.
Figure 2 presents the theoretical estimate of shear stresstpusing equation 2 over a range of turbulent eddy sizes10mmvgv103mm and hematocrit 0vHv0:8. As shown in this figure, tp ranges 1021–105dyne/cm2. We must note here that we extrapolate equation 1 forgas low as half the size of the RBC. It is interesting to note that for angabout 5–6mm, equation 1 predicts a shear stress between 400–500 N/m2, a magnitude well known to instantly lyse RBCs [29,30]. This illustrates that thetpprediction of equation 1 upgapproaching 10mm appears to asymptotically
reach the instantaneous lysis value of 400–500 N/m2 [29,30]. Furthermore these shear stresses correspond to the release of serotonin from platelets, demonstrating granule release, a process involved in platelet activation [33].
In real turbulent flows,gis a dynamically fluctuating quantity in space and time, around the statistical measuregK: n3B=SET
1=4
. SubstitutinggKin equation 2 will only represent an average shear
Table 1.Basic Turbulence Parameters Upstream.
y/R k (m2/s2) L (mm) Re
L g0(mm) gk(mm)
Acceleration 20.04 8.06E-03 521 13.35 81 75
20.15 8.81E-03 561 15.05 80 73
20.25 7.83E-03 580 14.66 84 77
20.36 9.24E-03 485 13.33 75 70
Peak 20.04 5.25E-03 416 8.61 88 83
20.15 4.76E-03 283 5.58 82 78
20.25 5.39E-03 338 7.09 82 78
20.36 5.50E-03 303 6.42 79 75
Deceleration 20.04 8.38E-03 512 13.38 79 73
20.15 9.04E-03 447 12.14 74 69
20.25 7.40E-03 491 12.07 81 76
20.36 7.43E-03 595 14.64 86 79
Regurgitation 20.04 7.53E-03 365 9.06 74 70
20.15 9.11E-03 285 7.77 65 61
20.25 7.48E-03 346 8.56 74 69
20.36 7.57E-03 317 7.89 72 67
Diastole 20.04 9.46E-02 7396 650.03 70 57
20.15 9.55E-02 4004 353.50 59 49
20.25 9.60E-02 7438 658.48 70 57
20.36 5.60E-02 2746 185.69 64 55
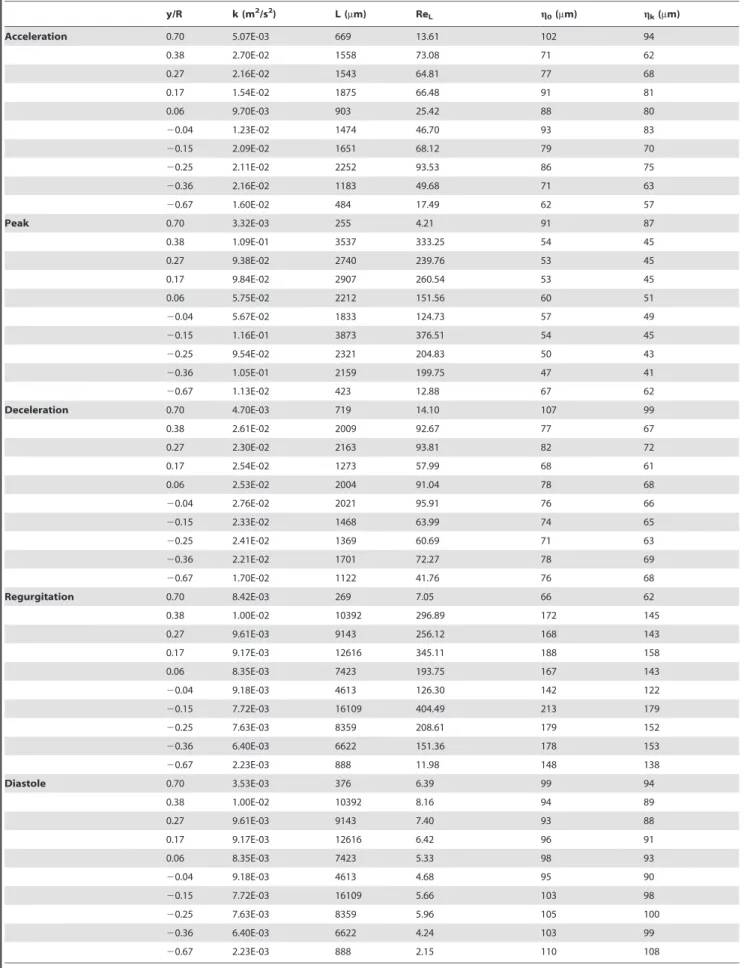
Table 2.Basic Turbulence Parameters Downstream.
y/R k (m2/s2) L (mm) Re
L g0(mm) gk(mm)
Acceleration 0.70 5.07E-03 669 13.61 102 94
0.38 2.70E-02 1558 73.08 71 62
0.27 2.16E-02 1543 64.81 77 68
0.17 1.54E-02 1875 66.48 91 81
0.06 9.70E-03 903 25.42 88 80
20.04 1.23E-02 1474 46.70 93 83
20.15 2.09E-02 1651 68.12 79 70
20.25 2.11E-02 2252 93.53 86 75
20.36 2.16E-02 1183 49.68 71 63
20.67 1.60E-02 484 17.49 62 57
Peak 0.70 3.32E-03 255 4.21 91 87
0.38 1.09E-01 3537 333.25 54 45
0.27 9.38E-02 2740 239.76 53 45
0.17 9.84E-02 2907 260.54 53 45
0.06 5.75E-02 2212 151.56 60 51
20.04 5.67E-02 1833 124.73 57 49
20.15 1.16E-01 3873 376.51 54 45
20.25 9.54E-02 2321 204.83 50 43
20.36 1.05E-01 2159 199.75 47 41
20.67 1.13E-02 423 12.88 67 62
Deceleration 0.70 4.70E-03 719 14.10 107 99
0.38 2.61E-02 2009 92.67 77 67
0.27 2.30E-02 2163 93.81 82 72
0.17 2.54E-02 1273 57.99 68 61
0.06 2.53E-02 2004 91.04 78 68
20.04 2.76E-02 2021 95.91 76 66
20.15 2.33E-02 1468 63.99 74 65
20.25 2.41E-02 1369 60.69 71 63
20.36 2.21E-02 1701 72.27 78 69
20.67 1.70E-02 1122 41.76 76 68
Regurgitation 0.70 8.42E-03 269 7.05 66 62
0.38 1.00E-02 10392 296.89 172 145
0.27 9.61E-03 9143 256.12 168 143
0.17 9.17E-03 12616 345.11 188 158
0.06 8.35E-03 7423 193.75 167 143
20.04 9.18E-03 4613 126.30 142 122
20.15 7.72E-03 16109 404.49 213 179
20.25 7.63E-03 8359 208.61 179 152
20.36 6.40E-03 6622 151.36 178 153
20.67 2.23E-03 888 11.98 148 138
Diastole 0.70 3.53E-03 376 6.39 99 94
0.38 1.00E-02 10392 8.16 94 89
0.27 9.61E-03 9143 7.40 93 88
0.17 9.17E-03 12616 6.42 96 91
0.06 8.35E-03 7423 5.33 98 93
20.04 9.18E-03 4613 4.68 95 90
20.15 7.72E-03 16109 5.66 103 98
20.25 7.63E-03 8359 5.96 105 100
20.36 6.40E-03 6622 4.24 103 99
20.67 2.23E-03 888 2.15 110 108
stress acting on RBCs and is perhaps insufficient to reflect the intense fluctuations of the dissipation rate that would correspond to sub-Kolmogorov scale eddies. Thus, to fully capture the statistical nature of shear stress acting on RBC membranes, it is necessary to characterize the probability density function of tp
denoted P(tp). P(tp) is related to the probability density function of g, Qð Þg, through conservation of probability as:
P(tp)~Qð Þg dg
dtp. Recent turbulence literature indicates thatQð Þg
may be universal despite the highly intermittent fluctuations of the instantaneous dissipation rate field [18,19]. Analytical forms for this universal distribution exist with good agreement for experi-ments and simulations [24,27]. The key point relevant here is that
P(tp)may be universal in the strongly turbulent regions of blood
flow through devices, and estimated using a simple change of variables as:
P(tp)~{1 2C
1=2t{3=2
p Q
Lt1=2 p C1=2
!
ð3Þ
WhereC~nB
ffiffiffiffiffiffiffiffiffiffiffiffiffiffiffiffim Bmp 1{H
ð Þ
r
.
The above arguments and physical construction not only provides a mathematical relationship betweeng(as a surrogate for
e), and tp, but also yields P(tp). However, how does this
relationship link turbulence statistics to tp? The most common
Figure 4. Probability density function Q(g) during acceleration, peak, and deceleration phases at the points of interest upstream
and perhaps paradoxical turbulence statistic in the context of blood damage has been the Reynolds stress tensorrSuiujT. This has been extensively discussed in the past (and key issues reviewed in [12]) with the note that while it does appear to relate to predicting cell damage, there is no consensus with respect to the physical relationship betweenrSuiujTandtp. An alternate model
to estimate tp based on cell relative velocities between adjacent eddies has been proposed [12] but in our opinion this lacks the physical justification for existence of such intense velocity jumps (more severe than the smallest Kolmogorov event) over sub-micron scales. Nevertheless, based on the phenomenological arguments made earlier with the hypothetical eddy, it is easy to see that it is the total energy dissipation rate that directly dictates
tp. One feasible explanation we can offer to explain the robustness of Reynolds shear stress in predicting blood damage is that for regions in equilibrium, the average rate of energy dissipation,eis related to Reynolds stress given by the equation (proof in [34]):
E&{SuiujTdUi
dxj, where dUi
dxj is the mean strain rate tensor.
Plugging this approximation in equation 1 and ensemble averaging it, the root mean square oftpis given by:
St2pT1=2& {mprB 1{HSuiujT
dUi dxj
1=2
ð4Þ
The above discussion is presented for completeness and offers to reconcile the rather paradoxical issue (so far) of why Reynolds shear stress has been effective in capturing blood damage potential of turbulent blood flows [12]. The reconciliation that we offer through equation 4 is that it is not the Reynolds stress itself, but the product of the Reynolds stress and the local strain rate that determines the energy passed on to the cascade and hence the total energy dissipation rate, which as we have shown should ultimately set the viscous shear stress acting on blood cell membranes. A rough order of magnitude verification of equation 4 can be made
based on the contour scale bars in Ref. [14] that experimentally quantifies the Reynolds shear stresses in a heart valve flow. By setting Reynolds shear stress in equation 4,100 N/m2(i.e. O(100) N/m2), and substitutingmpto be,1023Ns/m2and mean strain rate to be O(1000) s21
, we get St2
pT1=2 14N=m2. This strikingly
agrees with the range of viscous shear stress reported in Ref. [14] to be 15 N/m2. This agreement demonstrates further that Reynolds shear stress when combined with the mean strain rate can relate as an order of magnitude estimate to viscous shear stress acting on blood cells. The most comprehensive representation of shear stress acting on cells however is undoubtedly the hypoth-esized universal distribution functionP(tp).
A Test of Universality and Quantification ofP(tp). With the reasonableness of the Newtonian assumption for physiological turbulent eddies, we interrogate the most complex turbulent blood flow problem — the pulsatile turbulent field surrounding a bileaflet mechanical heart valve using high-resolution phase-locked particle image velocimetry to calculate P(tp) and assess its universality. Turbulence in mechanical heart valve flows has received enormous attention in medical research with unresolved issues in relation to the applicability of Reynolds shear stresses on blood cells [12]. Briefly, a bileaflet mechanical heart valve was experimentally subjected to physiological aortic conditions and the instantaneous turbulent velocity field was captured in the vicinity of the valve during representative phases of the cardiac cycle. Points of interest within the measurement region where complexity is expected (Figure 3) were further interrogated to quantify the probability density functionQð Þg and the corresponding probability density function of the shear stress,P(tp)for a hematocrit of 48%.
Particle Image Velocimetry (PIV) of Bileaflet Mechanical Heart Valve. Experiments are similar to that described in Ref. [35]. The fluid was seeded with polyamide tracer particles (Dantec Dynamics, Denmark) distributed in the 5 to 30 microns range. A laser sheet illuminated the central plane normal to the b-datum line. The laser was generated using the Photonics Industries DM40-527 diode-pump Q-switched laser (Photonics, Bohemia,
Figure 5. Normalized probability density function Q(g/g0) at the points of interest upstream and downstream at all phases
compared to published isotropic result.
doi:10.1371/journal.pone.0105357.g005
NY) with optics to covert the output beam into an expanded laser sheet. The laser had an initial thickness of approximately 1 mm, which was focused down to less than 200 microns within the measurement region using a spherical lens (f= 1 m). The valve was oriented such that the measurement plane bisected both leaflets at the central plane of valve model. A Photron Fastcam SA3 CCD high speed video camera (Photron, San Diego, CA) synchronized to the laser system via a high speed controller (HSC) (LaVision, Ypsilanti, MI) captured focused images of the illuminated polyamide particles within the laser sheet in the measurement plane. The image area of interest was 1.5D wide and 1D tall with the valve body centered. Image distortion due to
curvature of the acrylic tube was compensated in-situ with a calibration plate consisting markers placed in a regular square grid with 1 mm spacing. The DaVis calibration algorithm (LaVision Inc, Germany) automatically tracks the markers and a map to evaluate the corrected image. Corrected image generated of the calibration plate verified successful calibration and distortion correction. The PIV setup achieved a raw data spatial resolution of roughly 27mm/pixel. PIV measurements were performed in
double-frame mode with a laser pulse separation time, Dt = 500ms. This ensured adequate particle displacements in the
range of 10–15 pixels thus maximizing the accuracy of instanta-neous velocity measurements to within 2% error.
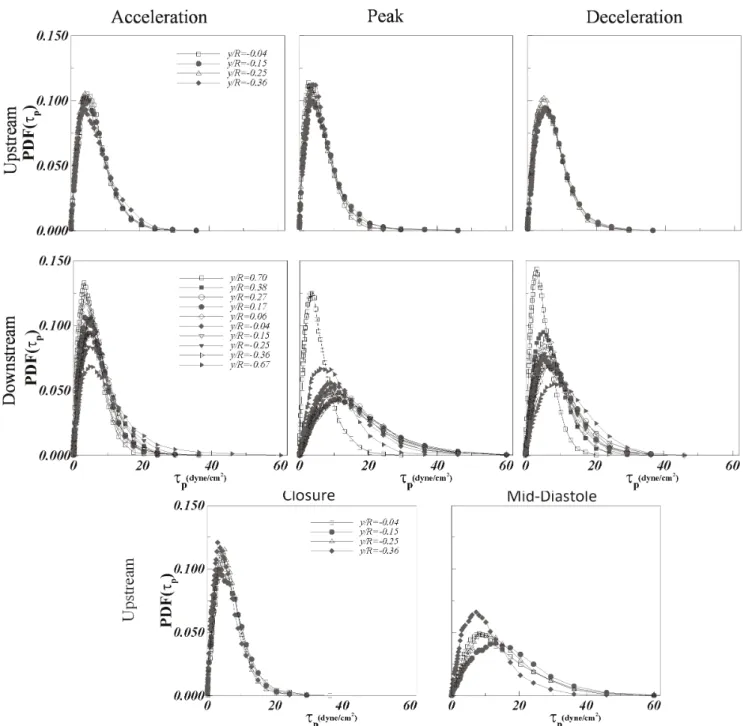
Figure 6. Probability density function of instantaneous shear stress (tp) during acceleration, peak, and deceleration phases at the
points of interest upstream (top row) and downstream (middle row).Closure and mid-diastole phases for points of interest upstream are shown in the bottom row.
Images were pre-conditioned by first subtracting the minimum image from every image acquired. Instantaneous two-dimensional velocity field was calculated from the raw particle images using cross-correlation processing with a multi-pass scheme. The initial interrogation window size for the multi-pass scheme was at 32632 pixels, which progressively reduced to 868 pixels. Interrogation window overlap was fixed at 50%. Post-processing of the vector data included a median filter that rejected vectors outside 3 standard deviations of the neighbor vector. Gaussian smoothing was used to reduce noise in the vector data. An in-house Matlab code was developed to post-process these raw velocity measure-ments to derive statistical properties, specifically PDFs.
Peak locking index was calculated to be between 0.02–0.19.
Peak locking index is defined as 4Dw{1
4D where w is the first
moment of the probability distribution function of the absolute fractional distance in pixels to the nearest integer pixel displace-ment. If the probability distribution is uniform in the pixel displacement range 0 to 0.5, then the pixel locking index is zero, indicating no pixel locking. A value of 1 indicates 100% pixel locking (i.e. no sub-pixel displacements recorded). Our range of 0.02–0.19 for peak locking index is far below 0.25, which is the threshold for minor peak locking artifacts.
Error Considerations. The sources of error in our mea-surements are due to resolution as well as random error. Random errors are addressed in this study through statistical averaging of repeated measurements (N = 500) and statistical comparisons. This section briefly outlines the errors in accuracy due to limited resolution of the measurement techniques at hand. The conser-vative error estimate in velocity is,2% (i.e. particle displacements
may be off by60.2 pixels out of total displacement of 10 pixels). Laser pulse timing errors are negligible in comparison.
Validation. In order to check if the valve chamber and the acrylic model valve provide equivalent results to clinical quality St. Jude Medical valve, Figure 5 of Ref. [35] compares non-dimensionalized leaflet kinematics, and the downstream velocity profile atx/D = 0.33 during peak systole to published results for a clinical quality St. Jude Medical valve [36].
Calculation ofQð Þg andP(tp). PDFs of the local dissipation scale,Qð Þg was calculated for each interrogation point in Figure 3. The approach is similar to that previously described [20,37] with
the qualifying condition forg being0:9vgdug
n v2. Briefly, the
instantaneous g is estimated from the local velocity increment between PIV velocity measurement points. We have shown in Ref. [37] that a significant portion of the local dissipative scale PDF,
Qð Þg may be derived if the velocity measurement resolves a sizeable portion of the dissipative range; i.e. PIV resolution well resolves the Taylor microscale. Given that the PDF is derived from the histogram of the occurrence of g, and that the measured variable in the above inequality isdug, it is straight forward to propagate the percent error in the instantaneous velocity of the PIV measurements to the uncertainty in the PDF. Our uncertainty of 2% in velocity translates to an uncertainty of 2.8% in dug. Given that the inequality is the only qualifying criteria, the uncertainty in the PDF may be achieved by perturbing the upper and lower limits of the inequality. To be conservative, we recalculated the PDFs by incorporating a 10% variation in the limits and found that the resulting PDFs with this additional 10% uncertainty induginsignificantly influenced the shape of the PDF.
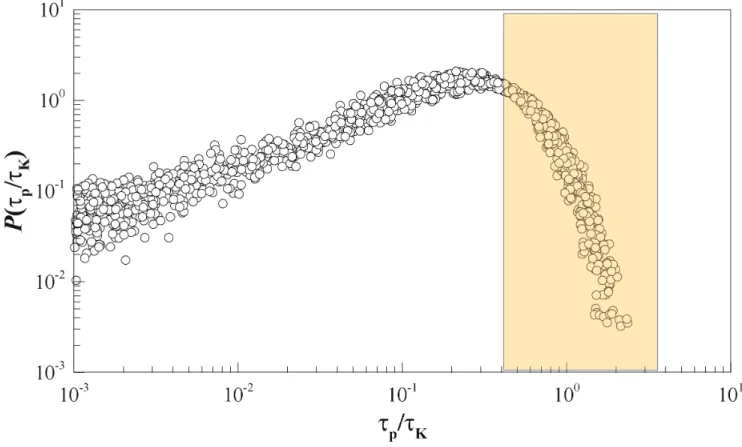
Figure 7. Probability density function of instantaneous normalized shear stress (tp/tK) for all points of interest at all phases.Notice the close data collapse fortp/tKabove 0.5. The probability oftp.0.5tKis about 0.36 (shaded region).
y/R gmin(mm) tmaxCurrent Study (dyne/cm2) gavg(mm) tgavgCurrent Study (dyne/cm2) gpeak(mm) tgpeakCurrent Study (dyne/cm2)
Acceleration 20.04 75 18.61 273 1.39 145 4.94
20.15 73 19.17 261 1.52 158 4.14
20.25 77 17.25 268 1.44 161 3.98
20.36 70 21.35 268 1.44 166 3.75
Peak 20.04 83 15.10 288 1.25 173 3.45
20.15 78 17.00 285 1.28 164 3.86
20.25 78 17.09 290 1.23 181 3.15
20.36 75 18.31 284 1.28 155 4.32
Deceleration 20.04 73 19.33 274 1.38 146 4.83
20.15 69 21.90 258 1.55 137 5.53
20.25 76 17.99 264 1.48 146 4.83
20.36 79 16.38 259 1.54 146 4.83
Regurgitation 20.04 70 21.11 251 1.64 146 4.83
20.15 61 27.56 264 1.48 162 3.95
20.25 69 21.58 266 1.46 145 4.94
20.36 67 22.76 279 1.33 175 3.37
Diastole 20.04 57 31.32 193 2.77 110 8.49
20.15 49 42.86 178 3.26 91 12.44
20.25 57 31.57 191 2.84 108 8.88
20.36 55 34.70 219 2.16 119 7.25
doi:10.1371/journal.pone.0105357.t003
Theory
to
Predict
Shear
Stress
on
Cells
in
Turbulent
Blood
Flow
ONE
|
www.ploson
e.org
11
August
2014
|
Volume
9
|
Issue
8
|
y/R gmin(mm) tmaxCurrent Study (dyne/cm2) gavg(mm) tgavgCurrent Study (dyne/cm2) gpeak(mm) tgpeakCurrent Study (dyne/cm2)
Acceleration 0.70 94 11.60 641 0.25 175 3.37
0.38 62 26.61 298 1.17 146 4.83
0.27 68 22.65 352 0.83 146 4.83
0.17 81 15.94 433 0.55 171 3.53
0.06 80 16.24 504 0.41 173 3.45
20.04 83 15.17 434 0.55 141 5.17
20.15 70 21.32 380 0.72 140 5.29
20.25 75 18.44 334 0.93 132 5.92
20.36 63 25.85 380 0.72 141 5.17
20.67 57 32.31 373 0.74 138 5.41
Peak 0.70 87 13.66 689 0.22 169 3.61
0.38 45 50.27 158 4.12 100 10.39
0.27 45 51.13 156 4.25 92 12.16
0.17 45 51.45 151 4.53 95 11.37
0.06 51 39.41 188 2.93 110 8.49
20.04 49 42.87 185 3.02 108 8.88
20.15 45 50.35 155 4.28 101 10.16
20.25 43 56.25 170 3.57 104 9.50
20.36 41 62.58 164 3.82 96 11.12
20.67 62 26.68 310 1.07 128 6.33
Deceleration 0.70 99 10.57 690 0.22 175 3.37
0.38 67 22.85 336 0.92 143 5.06
0.27 72 20.07 271 1.40 126 6.48
0.17 61 28.17 277 1.35 143 5.06
0.06 68 22.36 271 1.40 131 6.05
20.04 66 23.76 284 1.28 131 6.05
20.15 65 24.55 274 1.37 129 6.19
20.25 63 26.07 297 1.17 132 5.92
20.36 69 21.95 333 0.93 131 6.05
20.67 68 22.15 233 1.90 110 8.49
Regurgitation 0.70 62 26.75 691 0.22 185 3.01
0.38 145 4.90 633 0.26 183 3.08
0.27 143 5.07 499 0.42 160 4.04
0.17 158 4.16 630 0.26 176 3.34
0.06 143 5.06 544 0.35 183 3.08
Theory
to
Predict
Shear
Stress
on
Cells
in
Turbulent
Blood
Flow
ONE
|
www.ploson
e.org
12
August
2014
|
Volume
9
|
Issue
8
|
y/R gmin(mm) tmaxCurrent Study (dyne/cm2) gavg(mm) tgavgCurrent Study (dyne/cm2) gpeak(mm) tgpeakCurrent Study (dyne/cm2)
20.04 122 6.90 457 0.49 169 3.61
20.15 179 3.24 541 0.35 156 4.22
20.25 152 4.46 527 0.37 167 3.69
20.36 153 4.39 494 0.42 146 4.83
20.67 138 5.43 878 0.13 194 2.75
Diastole 0.70 94 11.80 740 0.19 175 3.38
0.38 89 13.04 663 0.23 175 3.37
0.27 88 13.38 612 0.28 158 4.13
0.17 91 12.44 636 0.26 179 3.23
0.06 93 11.90 723 0.20 173 3.45
20.04 90 12.68 709 0.21 160 4.04
20.15 98 10.69 710 0.21 177 3.30
20.25 100 10.38 746 0.19 173 3.45
20.36 99 10.65 767 0.18 169 3.61
20.67 108 8.86 969 0.11 207 2.41
doi:10.1371/journal.pone.0105357.t004
Theory
to
Predict
Shear
Stress
on
Cells
in
Turbulent
Blood
Flow
ONE
|
www.ploson
e.org
13
August
2014
|
Volume
9
|
Issue
8
|
The PDF P(tp) was determined by directly calculating the occurrences oftpfor every occurrence ofgusing equation 2. Non-dimensionalization parameters were calculated for each interro-gation point and are listed in Tables 1 and 2.
Results: Dimensional Pdfs ofgandtpfor Flow Near
a Bileaflet Mechanical Heart Valve
Figure 4 presents the probability density functionQð Þg at points of interest (defined in Figure 3) during specific phases of the cardiac cycle. Upstream of the valve, the peak of Qð Þg
(representing the mode of the fluctuatingg) is consistently observed to be between 100–200mm during forward flow. The smallest eddies captured in the distribution function are in the range 50– 70mm. The same characteristics are observed upstream of the valve during closure phase. However, during mid-diastole, there is a significant change inQð Þg with respect to the varying location of points. In particular, except for the furthest location from the centerline, the locations closer to the centerline correspond to a significant leftward shift ofQð Þg. For these locations, the mode of
g is in the range 80–90mm, with the smallest gabout 40mm. Downstream of the valve, there is significant variation in Qð Þg
characteristics as a function of the lateral position relative to the centerline during acceleration, peak, and deceleration phases (Figure 4). The smallestgis between 40–50mm and the mode ofg
between 90–200mm. Positions located within the side orifice jets above and below the centerline do not show significantly different
Qð Þg characteristics compared to the upstream forward flow characteristics.
The above shifts in Qð Þg characteristics clearly point to the slight leftward shift whenever increased turbulence is expected. For instance, locations slightly off from the centerline upstream of the valve will experience the high shear regions of the regurgitation jet during mid-diastole. Similarly, the leftward shifting ofQð Þg, also coincides with the shear layer locations downstream of the two leaflets consistent with the results in a more classical flow problem
[36]. For all the locations, it appears that the smallest eddies are in the neighborhood of about 40mm, which is consistent with the
literature [12]. On the contrary, these small eddies appear to be relatively rare events with most of the dissipative eddies in the turbulent zones around 80mm. This may be lower in locations where significantly greater turbulence exists.
Figure 5 presents the normalized probability density function
Qðg=gOÞ for each of the positions of interest upstream and
downstream at different phases of the cardiac cycle.gOis defined
asgO~LRe{L0:72 where L is the local integral length scale, and ReL~k1=2L=nas discussed in Refs. [18,26] is a scale very close to gK~LRe
{3=4
L . Also presented is Qðg=gOÞ for the case of
homogenous isotropic turbulence (HIT) from highly resolved direct numerical simulations [26] for comparison. Figure 5 shows very good agreement of the experimentally derived PDFs with the HIT expectation. The scatter around the HIT expectation may be attributed to experimental uncertainty as well as weak dependence of Qðg=gOÞ on local mean shearing [20]. Specifically, we have shown that this weak dependence occurs when the Corrsin length scale, gc~SET=S31=2, where S is the mean shear magnitude,
approaches the mean shear-viscosity length scale, ðn=SÞ1=2 [20]. Nevertheless, from a practical standpoint these results confirm the largely valid assumption of universal small scale structures despite the highly pulsatile nature of the turbulent flow past a complex device. This is particularly significant given the classical assump-tions behind universality of turbulence are highly restrictive (i.e. very high Reynolds number, fully developed, equilibrium, stationary etc.).
Figure 6 presents the raw PDFs oftp. The peak (mode) of the
distribution fortpranges between 5 and 20 dynes/cm2with the right tail extending to about 60 dynes/cm2. Tables 3 and 4 list the maximum observedtpcorresponding to the minimumgat each position for all recorded phases for the cardiac cycle. To assess the universality of P(tp), we examine the normalized probability
density functionP(tp=tp
K)(see Figure 7) for the different points of
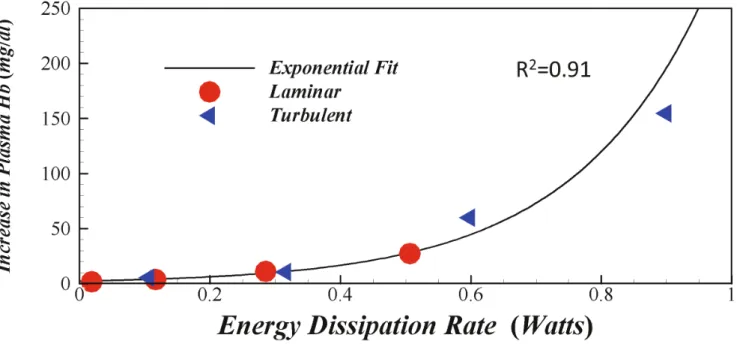
Figure 8. A plot of plasma hemoglobin data from Kameneva et. al (2009) with respect to total energy dissipation rate calculated from reported wall shear stress and Reynolds numbers.Figure illustrates how total energy dissipation consistently captures blood damage irrespective of laminar or turbulent flow regimes.
interest and cardiac phases. tp
K is defined by substituting gK~LRe{L3=4 in equation 2, thus defining a characteristic
Kolmogorov scale shear stress acting on blood cells as:
tpK~ ffiffiffiffiffiffiffiffiffiffiffiffi
mBmp 1{H r
k1=2 L ReL
1=2 ð5Þ
The normalized PDFs show strong data collapse indicating a practical universality which is expected based on the collapse observed forQðg=gOÞ. Note that the maximum observabletpwas
roughly 2tp
K regardless of location of measurement or cardiac
phase for the specific problem. The tale of P(tp=tp K) drops
exponentially around this magnitude. A theoretical limit to the maximum shear stress tpmax may be estimated utilizing the smallest possible sub-Kolmogorov scale gS~LReL{1 [26,28] to
yieldtpmax~ ffiffiffiffiffiffiffiffiffiffiffiffim
Bmp 1{H r
k1=2 L ReL.
Discussion
Resolving Historically Inconsistent Hemolysis in Laminar and Turbulent Pipe Flow
The argument introduced to relate turbulence properties to the shear stress environment is a simple balance of energy dissipation. Thus, regardless of whether a flow is laminar or turbulent, isotropic or not, energy dissipated must highly correlate to the fate of suspended cells. In fact, energy dissipation was classically recognized as the hemodynamic parameter that dictates hemolysis based on simple physical arguments [38,39]. We test if this can resolve one of the paradoxical results published in Ref. [13] where hemolysis was measured in fully developed laminar and turbulent pipe flows while maintaining the same wall shear stress. Given that the total shear stress of the mean flows for both these cases are identical, the conventional thinking expects the same levels of hemolysis. However, turbulent cases produced significantly higher hemolysis [13]. To resolve the lack of an appropriate physical interpretation, we present a revised graph (Figure 8) that plots the measured plasma free hemoglobin (a measure hemolysis) as a function of total energy dissipation rate (in watts) in the pipe based on available information of wall shear stress and Reynolds numbers. Briefly, based on the wall shear stress magnitudes, length of the pipe, and its diameter the pressure drop can be calculated using a simple force balance. We also calculated flow rates from the given Reynolds number, viscosity, and pipe diameter information. The pressure drop and flow rate were multiplied to yield the total energy dissipation rate in watts. Figure 8 confirms that indeed, regardless of whether the flow is laminar or turbulent, the total energy dissipated produces a single monotonic functional dependence for hemolysis. The functional form with the best correlation was an exponential fit with R2= 0.91 compared to linear, and power fit models. Nonetheless, this result supports our fundamental assumptions and confirms that total energy dissipation is the fundamental parameter that dictates the mechanical environment of suspended cells.
One must note however that in the above pipe flow data, exposure time was not a relevant quantity as in all the experiments of ref. [13], the total exposure time was fixed. Thus the resulting trend shown in Figure 8 reflects the exponential growth in hemolysis due to the complex instantaneous energy dissipation ‘‘histories’’ of the turbulent cases. Further studies are necessary to develop appropriate blood damage models that take into account
instantaneous energy dissipation rate histories and exposure times for pulsatile applications.
In the Context of a Cellular Environment
Cells are highly responsive to changes in their energetic environment, as demonstrated by the effectiveness ofin vivolaser injury models [40]. Thermal energy is capable of inducing alterations to RBC morphology and can result in hemolysis in extreme cases [41,42]. Exacerbating the problem, a cascade of events can occur upon RBC lysis including platelet activation stimulated from adenosine diphosphate [43]. More direct studies of mechanical stress have demonstrated numerous effects on suspended blood cells, which can be combined with an energy balance equation, as presented here to determine the degree of cell activity. High shear stress is known to cause hemolysis and can further result in induced platelet activation and shear-induced platelet aggregation, which has become known as SIPA, a feature that occurs independent of activation agonists. This process depends on the magnitude and the duration of shear stress [33]. More complex gradients in shear stress have been shown to promote activation-independent platelet aggregation involving the binding protein, von Willebrand factor (VWF) [44], a feature that may be important for the intermittent nature of turbulence. Platelets combined with VWF can result in aggrega-tion while in suspension, independent of an adhesive surface substrate [45]. For sufficient shear stress, VWF can change from a globular confirmation to an extended chain [46,47], which can result in self-association, creating a structure that is very adherent to platelets and can create a physical barrier for other cells [48]. Shear stress in bulk flow or at a surface will also influence the inflammatory response. Activated platelets, alone, release a number of prothrombotic and proinflammatory molecules througha-granules and microparticles [49–51]. These processes may interact with mechanotransductive mechanisms in mono-cytes, which are highly responsive to membrane tension through cellular activation, signaling, and migration [52,53].
The current model may better predict the local shear stress environment for these processes and for dictating the function of binding proteins, platelets, RBCs, and monocytes, especially for the complex flow environment that can exist in medical devices and atherosclerosis [54]. As it becomes clear how cells respond to their mechanical environment, it will be increasingly important to develop unifying theories, such as the one presented in this paper to better determine the mechanical conditions for cells in a physiological or pathophysiological environment. It will further be critical for medical device development to consider the relation-ship between the cellular response and mechanics. For example, it has already been shown that self-association of VWF can result in acquired von Willebrand Disease in devices, including ventricular assist devices [55,56], a blood disorder that can be amplified by shear-induced receptor shedding in platelets [57].
In addition to predicting cellular functional responses to the local mechanical environment, it is also important to consider the influence on transport in the fluid flow. The complex biorheology of blood is highly dependent on the local shear environment [58]. The local environment influences the number of collisions between cells and the rotational nature of the cells, both of which are largely dependent on the hematocrit. Transport in the flow may be critical for thrombus growth rates and the movement of microparticles or cellular agonists [59,60].
Limitations
flow environment, an assumption shown to be reasonably valid for the mean shear at the points examined. However, there may be much stronger shearing in medical devices such as LVADs, where strong mean shear effects need to be accounted for to revise the distribution function of the dissipative scales of equation 3. In our probability density functions, we did see slight shifts, which may be caused by these influences, discussed in detail elsewhere [20,37]. However, the shifts were relatively minor in the current study.
Conclusion
We introduced a theory to predict the mechanical environment of cells in turbulent blood flows through physical arguments applicable to any in-homogenous turbulent flow. It is argued that for the case of physiological blood flow, the dissipative turbulent eddies are well in the Newtonian regime of blood rheology. We experimentally showed that the ‘‘universal’’ prediction of dissipa-tive eddy distributions is valid even in a highly complex flow generated past a bileaflet mechanical heart valve, and that consequently the shear stress distributions experienced by blood
cells must follow a practically universal distribution function. The universal form for shear stress acting on cells is presented and the theoretical maximum shear stress in a turbulent flow defined. Finally, the underlying assumption that local energy dissipation rate is the key to predicting the stress environment of cells is tested by demonstrating the high correlation between hemolysis and energy dissipation in pipe flow regardless of laminar or turbulent flow regime.
Acknowledgments
The authors gratefully acknowledge funding from National Institutes of Health (NIH) under Award Number R01HL119824, and the American Heart Association under award 11SDG5170011. The content is solely the responsibility of the authors and does not necessarily represent the official views of the NIH.
Author Contributions
Conceived and designed the experiments: LD. Performed the experiments: MF. Analyzed the data: LD KM. Wrote the paper: LD KM DB.
References
1. Coulter NA, Pappenheimer JR (1949) ‘‘DEVELOPMENT OF TURBU-LENCE IN FLOWING BLOOD,’’ American Journal of Physiology, 159(2), pp. 401–408.
2. Ku DN (1997) ‘‘Blood flow in arteries,’’ Annual Review of Fluid Mechanics, 29, pp. 399–434.
3. Bramwell ST, Holdsworth PCW, Pinton JF (1998) ‘‘Universality of rare fluctuations in turbulence and critical phenomena,’’ Nature, 396(6711), pp. 552– 554.
4. Nelkin M (1992) ‘‘IN WHAT SENSE IS TURBULENCE AN UNSOLVED PROBLEM,’’ Science, 255(5044), pp. 566–570.
5. Sreenivasan KR (1991) ‘‘FRACTALS AND MULTIFRACTALS IN FLUID TURBULENCE,’’ Annual Review of Fluid Mechanics, 23, pp. 539–+. 6. Sreenivasan KR, Antonia RA (1997) ‘‘The phenomenology of small-scale
turbulence,’’ Annual Review of Fluid Mechanics, 29, pp. 435–472. 7. Nicklin MJH, Hughes DE, Barton JL, Ure JM, Duff GW (2000) ‘‘Arterial
inflammation in mice lacking the interleukin 1 receptor antagonist gene,’’ J. Exp. Med., 191(2), pp. 303–311.
8. Beckman JS, Koppenol WH (1996) ‘‘Nitric oxide, superoxide, and peroxynitrite: The good, the bad, and the ugly,’’ Am. J. Physiol.-Cell Physiol., 271(5), pp. C1424–C1437.
9. Tay JH, Liu QS, Liu Y (2001) ‘‘The effects of shear force on the formation, structure and metabolism of aerobic granules,’’ Appl. Microbiol. Biotechnol., 57(1-2), pp. 227–233.
10. Bark Jr DL, Nesbitt WS, Wong AKT, Jackson SP (2013) ‘‘Shear Effects on Platelets and the Vessel Wall in the Pathogenesisi of Atherothrombosis,’’ Hemostasis and Thrombosis: Basic Principles and Clinical Practice, Lippincott Williams & Wilkins, p. 1592.
11. Grigioni M, Daniele C, D’Avenio G, Barbaro V (1999) ‘‘A discussion on the threshold limit for hemolysis related to Reynolds shear stress,’’ J. Biomech., 32(10), pp. 1107–1112.
12. Antiga, L., and Steinman, D. A., 2009, ‘‘Rethinking turbulence in blood,’’ Biorheology, 46(2), pp. 77–81.
13. Kameneva MV, Burgreen GW, Kono K, Repko B, Antaki JF, Umezu M (2004) ‘‘Effects of turbulent stresses upon mechanical hemolysis: Experimental and computational analysis,’’ ASAIO J., 50(5), pp. 418–423.
14. Ge L, Dasi LP, Sotiropoulos F, Yoganathan AP (2008) ‘‘Characterization of hemodynamic forces induced by mechanical heart valves: Reynolds vs. viscous stresses,’’ Annals of Biomedical Engineering, 36(2), pp. 276–297.
15. Bellofiore A, Quinlan NJ (2011) ‘‘High-Resolution Measurement of the Unsteady Velocity Field to Evaluate Blood Damage Induced by a Mechanical Heart Valve,’’ Annals of Biomedical Engineering, 39(9), pp. 2417–2429. 16. Dooley PN, Quinlan NJ (2009) ‘‘Effect of Eddy Length Scale on Mechanical
Loading of Blood Cells in Turbulent Flow,’’ Annals of Biomedical Engineering, 37(12), pp. 2449–2458.
17. Quinlan NJ, Dooley PN (2007) ‘‘Models of flow-induced loading on blood cells in laminar and turbulent flow, with application to cardiovascular device flow,’’ Annals of Biomedical Engineering, 35(8), pp. 1347–1356.
18. Bailey SCC, Hultmark M, Schumacher J, Yakhot V, Smits AJ (2009) ‘‘Measurement of Local Dissipation Scales in Turbulent Pipe Flow,’’ Phys. Rev. Lett., 103(1).
19. Hamlington PE, Krasnov D, Boeck T, Schumacher J (2012) ‘‘Local dissipation scales and energy dissipation-rate moments in channel flow,’’ Journal of Fluid Mechanics, 701, pp. 419–429.
20. Morshed KN, Venayagamoorthy SK, Dasi LP (2013) ‘‘Intermittency and local dissipation scales under strong mean shear,’’ Physics of Fluids, 25(1).
21. Yun BM, Dasi LP, Aidun CK, Yoganathan AP (2014) ‘‘Highly resolved pulsatile flows through prosthetic heart valves using the entropic lattice-Boltzmann method,’’ Journal of Fluid Mechanics, 754, pp. 122–160.
22. Fahraeus R, Lindqvist T (1931) ‘‘The viscosity of the blood in narrow capillary tubes,’’ American Journal of Physiology, 96(3), pp. 562–568.
23. Wells RE, Merrill EW (1961) ‘‘SHEAR RATE DEPENDENCE OF VISCOSITY OF WHOLE BLOOD AND PLASMA,’’ Science, 133(345), pp. 763–&.
24. Biferale L (2008) ‘‘A note on the fluctuation of dissipative scale in turbulence,’’ Physics of Fluids, 20(3).
25. Pries AR, Secomb TW, Gessner T, Sperandio MB, Gross JF, et al. (1994) ‘‘Resistance to blood flow in microvessels in vivo,’’ Circ Res, 75(5), pp. 904–915. 26. Schumacher J (2007) ‘‘Sub-Kolmogorov-scale fluctuations in fluid turbulence,’’
Epl, 80(5).
27. Yakhot V (2006) ‘‘Probability densities in strong turbulence,’’ Physica D-Nonlinear Phenomena, 215(2), pp. 166–174.
28. Yakhot V, Sreenivasan KR (2005) ‘‘Anomalous scaling of structure functions and dynamic constraints on turbulence simulations,’’ Journal of Statistical Physics, 121(5–6), pp. 823–841.
29. Bacher RP, Williams MC (1970) ‘‘HEMOLYSIS IN CAPILLARY FLOW,’’ Journal of Laboratory and Clinical Medicine, 76(3), pp. 485–&.
30. Rooney JA (1970) ‘‘HEMOLYSIS NEAR AN ULTRASONICALLY PUL-SATING GAS BUBBLE,’’ Science, 169(3948), pp. 869–&.
31. Fischer TM (1980) ‘‘On the energy dissipation in a tank-treading human red blood cell,’’ Biophys. J., 32(2), pp. 863–868.
32. Tran-Son-Tay R, Sutera S, Rao P (1984) ‘‘Determination of red blood cell membrane viscosity from rheoscopic observations of tank-treading motion,’’ Biophys.J., 46(1), pp. 65–72.
33. Hellums JD (1994) ‘‘1993 Whitaker Lecture: biorheology in thrombosis research,’’ Ann. Biomed. Eng., 22(5), pp. 445–455.
34. Brouwers JJH (2007) ‘‘Dissipation equals production in the log layer of wall-induced turbulence,’’ Physics of Fluids, 19(10).
35. Forleo M, Dasi L (2013) ‘‘Effect of Hypertension on the Closing Dynamics and Lagrangian Blood Damage Index Measure of the B-Datum Regurgitant Jet in a Bileaflet Mechanical Heart Valve,’’ Annals of Biomedical Engineering, pp. 1–13. 36. Dasi LP, Ge L, Simon HA, Sotiropoulos F, Yoganathan AP (2007) ‘‘Vorticity dynamics of a bileaflet mechanical heart valve in an axisymmetric aorta,’’ Physics of Fluids, 19(6).
37. Morshed KN, Dasi LP (2013) ‘‘Effect of strong anisotropy on the dissipative and non-dissipative regimes of the second-order structure function,’’ Experiments in Fluids, 54(5).
38. Bluestei M, Mockros LF (1969) ‘‘HEMOLYTIC EFFECTS OF ENERGY DISSIPATION IN FLOWING BLOOD,’’ Med. Biol. Eng., 7(1), pp. 1–&. 39. Jones SA (1995) ‘‘A RELATIONSHIP BETWEEN REYNOLDS STRESSES
AND VISCOUS DISSIPATION - IMPLICATIONS TO RED-CELL DAMAGE,’’ Ann. Biomed. Eng., 23(1), pp. 21–28.
40. Falati S, Gross P, Merrill-Skoloff G, Furie BC, Furie B (2002) ‘‘Real-time in vivo imaging of platelets, tissue factor and fibrin during arterial thrombus formation in the mouse,’’ Nat. Med., 8(10), pp. 1175–1180.
42. Gershfeld N, Murayama M (1988) ‘‘Thermal instability of red blood cell membrane bilayers: temperature dependence of hemolysis,’’ The Journal of membrane biology, 101(1), pp. 67–72.
43. Helms CC, Marvel M, Zhao W, Stahle M, Vest R, et al. ‘‘Mechanisms of hemolysis-associated platelet activation,’’ J. Thromb. Haemost., 11(12), pp. 2148–2154.
44. Nesbitt WS, Westein E, Tovar-Lopez FJ, Tolouei E, Mitchell A, et al. (2009) ‘‘A shear gradient-dependent platelet aggregation mechanism drives thrombus formation,’’ Nat Med, 15(6), pp. 665–673.
45. Shankaran H, Alexandridis P, Neelamegham S (2003) ‘‘Aspects of hydrody-namic shear regulating shear-induced platelet activation and self-association of von Willebrand factor in suspension,’’ Blood, 101(7), pp. 2637–2645. 46. Schneider, S. W., Nuschele, S., Wixforth, A., Gorzelanny, C., Alexander-Katz,
A., Netz, R. R., and Schneider, M. F., 2007, ‘‘Shear-induced unfolding triggers adhesion of von Willebrand factor fibers,’’ Proc. Natl. Acad. Sci. U. S. A., 104(19), pp. 7899–7903.
47. Siedlecki CA, Lestini BJ, Kottke-Marchant KK, Eppell SJ, Wilson DL, et al. (1996) ‘‘Shear-dependent changes in the three-dimensional structure of human von Willebrand factor,’’ Blood, 88(8), pp. 2939–2950.
48. Colace TV, Diamond SL ‘‘Direct observation of von Willebrand factor elongation and fiber formation on collagen during acute whole blood exposure to pathological flow,’’ Arterioscler. Thromb. Vasc. Biol., 33(1), pp. 105–113. 49. Harrison P, Cramer EM (1993) ‘‘Platelet alpha-granules,’’ Blood Reviews, 7(1),
pp. 52–62.
50. Ghasemzadeh M, Kaplan ZS, Alwis I, Schoenwaelder SM, Ashworth KJ, et al. (2013) ‘‘The CXCR1/2 ligand NAP-2 promotes directed intravascular leukocyte migration through platelet thrombi,’’ Blood, 121(22), pp. 4555–4566.
51. Nomura S, Tandon NN, Nakamura T, Cone J, Fukuhara S, et al. (2001) ‘‘High-shear-stress-induced activation of platelets and microparticles enhances expres-sion of cell adheexpres-sion molecules in THP-1 and endothelial cells,’’ Atherosclerosis, 158(2), pp. 277–287.
52. Houk AR, Jilkine A, Mejean CO, Boltyanskiy R, Dufresne ER, et al. (2012) ‘‘Membrane Tension Maintains Cell Polarity by Confining Signals to the Leading Edge during Neutrophil Migration,’’ Cell, 148(1–2), pp. 175–188. 53. Gauthier NC, Masters TA, Sheetz MP (2012) ‘‘Mechanical feedback between
membrane tension and dynamics,’’ Trends Cell Biol.
54. Bark Jr DL, Ku DN (2010) ‘‘Wall shear over high degree stenoses pertinent to atherothrombosis,’’ J. Biomech., 43(15), pp. 2970–2977.
55. Geisen U, Heilmann C, Beyersdorf F, Benk C, Berchtold-Herz M, et al. (2008) ‘‘Non-surgical bleeding in patients with ventricular assist devices could be explained by acquired von Willebrand disease,’’ Eur. J. Cardiothorac. Surg., 33(4), pp. 679–684.
56. Meyer AL, Malehsa D, Bara C, Budde U, Slaughter MS, et al. (2010) ‘‘Acquired von Willebrand syndrome in patients with an axial flow left ventricular assist device,’’ Circulation: Heart Failure, 3(6), pp. 675–681.
57. Gardiner EE, Andrews RK ‘‘Platelet Receptor Expression and Shedding: Glycoprotein Ib-IX-V and Glycoprotein VI,’’ Transfus. Med. Rev.
58. Zydney AL, Colton CK (1988) ‘‘Augmented solute transport in the shear flow of a concentrated suspension,’’ PhysicoChem. Hydrodyn., 10(1), pp. 77–96. 59. Bark Jr DL, Ku DN (2013) ‘‘Platelet Transport Rates and Binding Kinetics at
High Shear over a Thrombus,’’ Biophys. J., 105(2), pp. 502–511.