607
Original Articles
Consumption and social and demographic profile of the different
household arrangements of the elderly in Brazil: analysis from the
Study on Family Budgets
Natália Calais Vaz de Melo1 Karla Maria Damiano Teixeira1 Mirely Bonin Silveira2
1 Universidade Federal de Viçosa, Departamento de Economia Doméstica, Programa de Pós-Graduação
em Economia Doméstica. Viçosa, MG, Brasil.
2 Universidade Federal de Viçosa, Departamento de Economia Doméstica. Viçosa, MG, Brasil.
Research funding: Conselho Nacional de Desenvolvimento Científico e Tecnológico (National Council for Scientific and Technological Development) (CNPq). Process Nº 472082/2012-4. Minas Gerais Research Support Foundation (Fapemig). Process Nº BPD-00024-14 and Nº PPM-00017-14.
Correspondência/Correspondence Natália Calais Vaz de Melo E-mail: [email protected]
Abstract
Objective: to define the social and demographic profile of the different household arrangements involving the elderly, as well as to calculate the average annual consumption of such household arrangements according to the Pesquisa de Orçamentos Familiares (the Study on Family Budgets) (2008/2009). Method: a quantitative, descriptive, cross-sectional study was performed using secondary data extracted from the micro-data of the Study on Family Budgets (2008/2009), carried out by the Instituto Brasileiro de Geografia e Estatística (the Brazilian Institute of Geography and Statistics). In order to define the social and demographic profile of different household arrangements an exploratory analysis of the data was carried out, and the Gini index was used to identify if there was inequality in the distribution of consumption. Results: The results showed that elderly consumers can be seen as constituents of new generations, while most have only an elementary education and reside in an urban region of Brazil. There was a predominance of female heads of households in which there was no spouse present. When evaluating the distribution of the annual consumption of all the families, a greater weighting of the categories miscellaneous expenses, housing, transportation and food was found. Conclusions: Understanding the socioeconomic characteristics of the different home arrangements of the elderly, as well as their relationships with the consumption of goods and services, is extremely important, since the goods and services offered to this segment of the population can provide satisfaction with and improvement in quality of life.
608
INTRODUCTION
The social changes that have occurred in society from the 1970s onwards, especially those related to the reduction of fertility and mortality rates and increased longevity, have had a direct impact on the size and composition of families, as well as on gender relations and consumption patterns1. One of the most important social changes relates to the demographic increase of the elderly, with population aging increasing in all economically developed or developing societies2.
In Brazil in general and especially in some specific regions of the country, population aging is also growing. Since 2004 there has been a change in the format of the population age pyramid, with the aging of 60-year-old or older individuals, predominantly women (8.0% of the total population, with men of such age making up 4.3%). In 2015, the estimated population of Brazil was 204.9 million people, representing a growth of 0.8%, or 1.7 million people, in relation to the previous year, with 14.3% of this population classed as elderly3. The accelerated pace of aging in Brazil therefore creates new challenges for contemporary society, as this process occurs in a scenario of profound social, economic, urban, industrial and family transformations.
As in several other developing countries, population aging in Brazil has occurred faster and in an unfavorable socio-economic context due to low rates of economic growth; the fiscal crisis of the state; high levels of social inequality; high rates of illiteracy; problems with sanitation, housing, poverty; and also the lack of properly consolidated institutions, among other problems4.
The economic stabilization the Plano Real brought to Brazil resulted in an increase in the purchasing power and well-being of Brazilian families. With these economic changes, the pattern of consumption changed, with changes in the structures of household spending and incomes5,6.
In general, the demographic profile of the elderly, their geographical distribution, and the physiological and psychological effects of the aging process which they undergo has been much studied. Little is known, however, about how people over 60 think and behave
as consumers. If, on the one hand, the importance of these people in the economic, social and political life of the country has grown, there is also a lack of data on their purchasing and consumption habits 7. Some authors have corroborated this claim,
affirming that unlike in Brazil, research on elderly consumer behavior has increased significantly in recent decades in North American countries, while the transformation of the purchasing habits of the elderly has also been observed in India8.
Population aging therefore has a significant impact on several sectors, as this segment of the population has its own demands, and a large portion is economically active and concerned about living longer and better9. The new generation of elderly persons is more technologically aware, participatory and demanding, leading to innumerable consumer relations, which are no longer restricted only to the contracting and use of health-related services10.
It is also important to emphasize that, as one gets older, preferences and needs for products and services tend to change. The needs and expenditures of a family are affected by factors such as the number of members, their age, and the number of adults working outside the home. As family needs and expenditures change over time, the importance of the family life cycle, which combines trends in income and family composition with changes in the demands placed on this income11, as in the case of the elderly, should be highlighted.
The importance of studying the behavior of the consumer is therefore clear, since understanding cultural and social characteristics allows the needs and perceptions of consumers to be identified and makes it easier to satisfy them12.
609 It is therefore important to analyze how the
different household arrangements intervene in the consumption of goods and services by the elderly, which can contribute to a greater understanding of the dimension of aging in terms of consumption. The objective of the present study was therefore to delineate the social and demographic profile of the elderly consumer in different household arrangements in Brazil, as well as to identify, calculate and compare the types of goods and services that elderly household arrangements consume, according to the data of the Pesquisa de Orçamentos Familiares (Family Budget Survey) (POF 2008/2009).
The POF (2008/2009) aims to measure consumption, expenditure, income and part of the property variation of the family, making it possible to profile the living conditions of the Brazilian population based on the analysis of their household budgets. The POF (2008/2009) also investigates several characteristics of households and families, thus increasing the potential uses of the results of the survey 15.
METHOD
The data analyzed in this article are part of the project "The Behavior of the Elderly Consumer in Different Family Arrangements: A Historical and Comparative Analysis from the Data of the Family Budget Surveys".
The present research was quantitative, descriptive and cross-sectional in nature and used secondary data extracted from the Expenses, Income and Living Conditions microdata of the Family Budget Survey (2008/2009), carried out by the Instituto Brasileiro de Geografia e Estatística (Brazilian Institute of Geography and Statistics) (IBGE). The choice of these data is due to the fact that this is a national survey that includes detailed questions about the two measures of well-being: consumption and income, besides allowing comparison throughout Brazil as it covers both rural and urban areas.
The POF (2008/2009) is the fifth and most current survey conducted by the IBGE on family budgets. The data collection period of the POF was May 2008 to May 2009 and included 55,970 households from all regions of the country15.
Among the several variables that make up the POF 2008/2009 database, the following variables were selected for this study to describe the social and demographic profile of the household arrangements of the elderly: gender; age; skin color/ethnicity; Brazilian state; highest educational level; status in house (reference person, spouse, child, other relative, aggregate, pensioner, domestic employee and relative of domestic employee); household size; value of total household income. In relation to the types of goods and services consumed in the different household arrangements of the elderly, the following consumption variables were selected: food (inside and outside the home), housing, clothing, transportation, hygiene and personal care, health care, education, recreation, smoking, financial expenses (expenses with banking services, pension, insurance etc.) and miscellaneous expenses (pet expenses, professional services, ceremonies etc.).
To satisfy the objectives proposed in this study, the universe of analysis consisted of seven different household arrangements, which constituted domestic units, of elderly persons who lived in all regions of the country. The choice of the age limit in the classification of the elderly (60 years or older) was based on the criteria established by the Statute of the Elderly16.
It is important to mention that the POF (2008/2009) does not present a classification of the types of home arrangements. In this sense, an analytical classification was constructed to study the household arrangements of the elderly, which was as follows: Single person (elderly living alone); Composite (reference person of the home and other relatives); Couple without children (reference person who resides only with spouse); Couple with children (reference person, spouse and child); Couple without Children but with Relatives (reference person, spouse and other relatives); Couple with Children and Relatives (reference person, spouse, child or children and other relatives); and Single Parent (reference person, child or children and/or other relatives).
610
or biological child of the reference person and/or his or her spouse. Other relatives were considered individuals with or without any degree of kinship with the reference person or with their spouse. This classification was made from the aggregation of the categories "other relative", "aggregate", "pensioner", "domestic employee" and "relative of domestic employee" that the POF (2008/2009) uses to classify the residents of the consumption units.
In order to delineate the socioeconomic profile of the different household arrangements, an exploratory analysis of the data was performed 17.
To identify if there was inequality in the distribution of consumption among the household arrangements, the Gini index of the expenditure variables of the arrangements was used. This index varies from 0 to 1, with scores of closer to zero representing greater equality and a score equal to one representing the maximum degree of inequality18.
In order to obtain estimates of the universe of analysis of the POF (2008/2009) it was decided to perform the calculations using the expansion factor. Thus, of the 180,650 million people included in the survey, 20,314 million were 60 years old or older, representing 11.25% of the total population. However, in order to reach the objectives proposed here and considering only the household arrangements of the elderly as a consumer unit, the presence of outliers for the annual household consumption variable was detected. A sample size cut-off point was applied to improve the normality assumptions and to allow greater accuracy of the estimators. The criterion used was two standard deviations in relation to the first and last consumption percentage (equivalent to observations below R$300.00 and over R$228,819.00). The same problem was detected for the income variable, and therefore a sample cut-off point was also applied using the same criterion as the consumption variable for the lower income limit, and a standard deviation below 90% for the upper income limit (equivalent to observations below R$93.00 and over R$28,567.00). Therefore, the final sample of this study consisted of 13,899,071 people distributed in the home settings where at least one of the members was elderly.
Although the data of this study related to humans, as they came from a public use and access database,
there was no need to submit the study to the Research Ethics Committee.
RESULTS AND DISCUSSION
In order to understand the elderly as private individuals within a broader study focus, an exploratory analysis of the data was carried out by means of a brief characterization of their living conditions by studying the following variables: age, gender, level of education, skin color/ethnicity and regions of the country.
The POF (2008/2009) surveyed 20,314 million people aged 60 years or over. These elderly individuals had a mean age of 69.9 years (± 7.9), with a minimum age of 60 and a maximum of 104 years. A total of 75% were 75 years old or younger and 10% were 81 years old or older. The sample was predominantly female, with 11.3 million women (55.6%). Data from the Demographic Census of 201019 show that the highest concentration of women in the most advanced ages is related to male over-mortality, a phenomenon present in almost all age groups. In the elderly group, due to the effect of higher male mortality, a smaller number of men reach such ages 20.
Regarding the educational level of the elderly studied by POF, 69.09% (n =10.8 million) described having only an elementary education, with an average of 4.5 years of study.
Regarding the skin color/ethnicity of these elderly persons, 55.36% (n=11.2 million) were white/ Caucasian; 35.11% (n=7.1 million) brown/mixed race; 7.71% (n=1.5 million) black/Afro-Brazilian; 1.03% (n=0.20 million) yellow/Asian-Japanese; and 0.48% (n=0.09 million) indigenous. The rest did not know or did not want to provide this information.
611 hand, the states with the lowest presence of elderly
people were, in order of importance: Sergipe, Amazonas, Distrito Federal, Tocantins, Rondônia, Acre, Amapá and Roraima. Together, these states contained less than 5% of the Brazilian elderly population, possibly due to migration from these regions and the search for a better quality of life in other regions of the country.
Regarding the gender distribution by state of the elderly persons surveyed in the POF, the Brazilian states with the highest percentages of elderly women were: Rio Grande do Norte (61.09%), Rio de Janeiro (60.74%) and Pernambuco (59.85%). The states of Tocantins (54.14%), Amapá (52.66%), Mato Grosso (51.19%) and Acre (51.03%), meanwhile, had the most elderly men. According to data from the Demographic Census of 201019, the states of Tocantins, Acre and Mato Grosso have more elderly men than elderly women due to the history of immigration in this region, which differs by gender.
It was possible to verify that 82.89% (n=16.8 million) of the elderly lived in urban areas of the country, characterizing this population segment as urbanized, a trend that can be explained by the fact that the elderly population seek better conditions and care for their needs in urban areas, which are also the regions where the majority of the Brazilian population are concentrated.
With regard to the household arrangements in which the elderly persons were inserted, the three most common types were single parents, couples with no children, and one-person households. Other surveys20 show that the traditional family
model, consisting of a heterosexual couple, with the man being the provider and the woman the home caregiver is disappearing, giving rise to new family arrangements, mainly with parent and single-person families. The three less common household arrangements were couples with no children but with relatives, composite arrangements, and couples with children and relatives (Table 1).
With regard to the geographic distribution of the household arrangements studied, it was seen that most of the households were located in the southeast region of Brazil, with 51.59% (n=1,398,400) of couples without children; 50.96% (n=1,296,292) of single persons; 46.30% (n=1,027,368) of couples with child; 43.44% (n=529,843) of the composite arrangement; 43.41% (n=1,201,134) of single parents; and, 37.39% (n=667,246) of couples with children and other relatives. Only the majority of couples without a child but with other relatives arrangement were located in the northeast (35.86% or n=234.733) of the country.
In all the residential arrangements under study, the majority resided in urban areas of the country. Some authors21 also noted that there is an incentive towards urban life and that the rural environment is becoming increasingly uninhabited. The process of urbanization in Brazil can explain this fact, as well as the fact that the aging process cause a need for greater attention to health, which is provided in the urban environment.
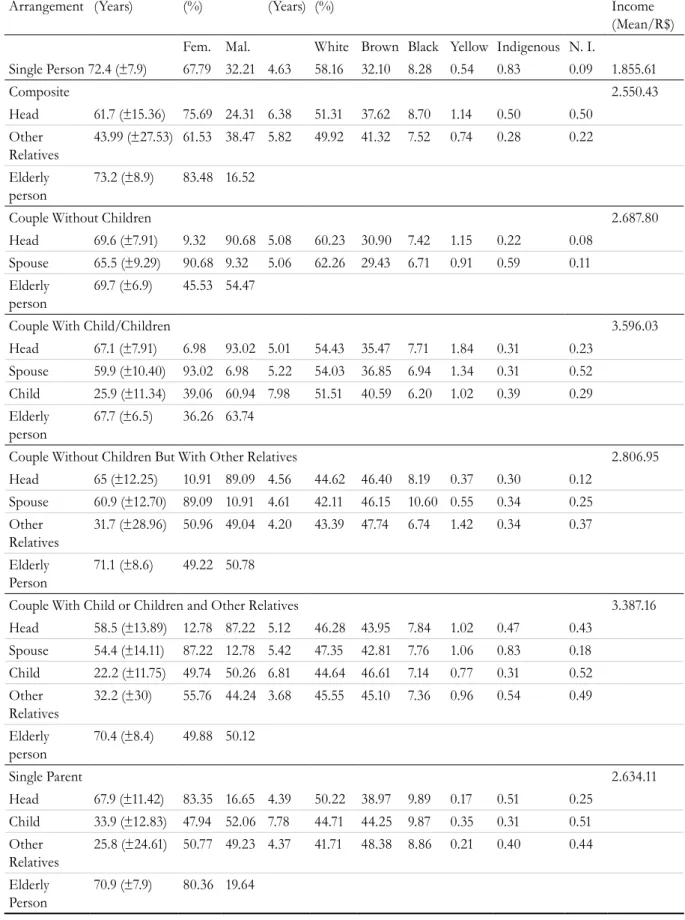
Table 2 shows the differences in the characteristics of the household arrangements in which the elderly were inserted which are part of the study sample.
Table 1. Household situation of elderly persons in Brazil. Brazil, 2009.
Type of Home Arrangement n (%)
Couple without children and relatives 654,498 (4.71)
Composite 1,219,845 (8.78)
Couple living with children and relatives 1,784,372 (12.84)
Couple that lives with children 2,219,154 (15.97)
Single person 2,543,565 (18.30)
Couple without children 2,710,413 (19.50)
Single parent 2,767,224 (19.90)
612
Table 2. Characterization of domestic arrangements of elderly persons. Brazil, 2009.
Arrangement Age (Years)
Gender (%)
Study (Years)
Gender (%)
Total Income (Mean/R$)
Fem. Mal. White Brown Black Yellow Indigenous N. I.
Single Person 72.4 (±7.9) 67.79 32.21 4.63 58.16 32.10 8.28 0.54 0.83 0.09 1.855.61
Composite 2.550.43
Head 61.7 (±15.36) 75.69 24.31 6.38 51.31 37.62 8.70 1.14 0.50 0.50
Other Relatives
43.99 (±27.53) 61.53 38.47 5.82 49.92 41.32 7.52 0.74 0.28 0.22
Elderly person
73.2 (±8.9) 83.48 16.52
Couple Without Children 2.687.80
Head 69.6 (±7.91) 9.32 90.68 5.08 60.23 30.90 7.42 1.15 0.22 0.08
Spouse 65.5 (±9.29) 90.68 9.32 5.06 62.26 29.43 6.71 0.91 0.59 0.11
Elderly person
69.7 (±6.9) 45.53 54.47
Couple With Child/Children
54.43 1.84 0.31 0.23
3.596.03
Head 67.1 (±7.91) 6.98 93.02 5.01 35.47 7.71
Spouse 59.9 (±10.40) 93.02 6.98 5.22 54.03 36.85 6.94 1.34 0.31 0.52
Child 25.9 (±11.34) 39.06 60.94 7.98 51.51 40.59 6.20 1.02 0.39 0.29
Elderly person
67.7 (±6.5) 36.26 63.74
Couple Without Children But With Other Relatives 2.806.95
Head 65 (±12.25) 10.91 89.09 4.56 44.62 46.40 8.19 0.37 0.30 0.12
Spouse 60.9 (±12.70) 89.09 10.91 4.61 42.11 46.15 10.60 0.55 0.34 0.25
Other Relatives
31.7 (±28.96) 50.96 49.04 4.20 43.39 47.74 6.74 1.42 0.34 0.37
Elderly Person
71.1 (±8.6) 49.22 50.78
Couple With Child or Children and Other Relatives 3.387.16
Head 58.5 (±13.89) 12.78 87.22 5.12 46.28 43.95 7.84 1.02 0.47 0.43
Spouse 54.4 (±14.11) 87.22 12.78 5.42 47.35 42.81 7.76 1.06 0.83 0.18
Child 22.2 (±11.75) 49.74 50.26 6.81 44.64 46.61 7.14 0.77 0.31 0.52
Other Relatives
32.2 (±30) 55.76 44.24 3.68 45.55 45.10 7.36 0.96 0.54 0.49
Elderly person
70.4 (±8.4) 49.88 50.12
Single Parent 2.634.11
Head 67.9 (±11.42) 83.35 16.65 4.39 50.22 38.97 9.89 0.17 0.51 0.25
Child 33.9 (±12.83) 47.94 52.06 7.78 44.71 44.25 9.87 0.35 0.31 0.51
Other Relatives
25.8 (±24.61) 50.77 49.23 4.37 41.71 48.38 8.86 0.21 0.40 0.44
Elderly Person
70.9 (±7.9) 80.36 19.64
613 It was noted that the level of education of the heads
of households and spouses in all the home arrangements under study is low, with the large majority having only an elementary education. The level of schooling of children was better, however, with a higher rate of high school and higher-level educations, probably due to the greater opportunities that the children had to attend school in relation to their parents. The level of education of the other relatives was also a little higher than heads or spouses, although elementary education still predominates among this group.
It is worth mentioning that the average years of study by the members of the household arrangements was six years, with children having more years of study (7.5), thus reaffirming the higher level of schooling of the children. In relation to the total income of the household arrangements, the arrangements couple with children and couple with children and relatives had higher average incomes.
It is also verified that the arrangement couple with children included elderly people who were on average younger than those in the other arrangements, which can be explained by their life cycle. In contrast, the elderly of the composite arrangements had the highest average age. Older women predominated in composite, single-parent and single-person arrangements.
Regarding the consumption of the household arrangements studied, an asymmetric distribution of total annual consumption was evidenced by the higher consumption of households located in the 90th percentile. This asymmetry is reflected in a mean (R$ 25,470.00) that is significantly higher than the median (R$ 14,340.00).
In contrast, the 25% of lower income households from the study sample had an annual consumption of R$6,851.00. The minimum consumption identified was R$317.00 while the highest was R$ 228,332.00.
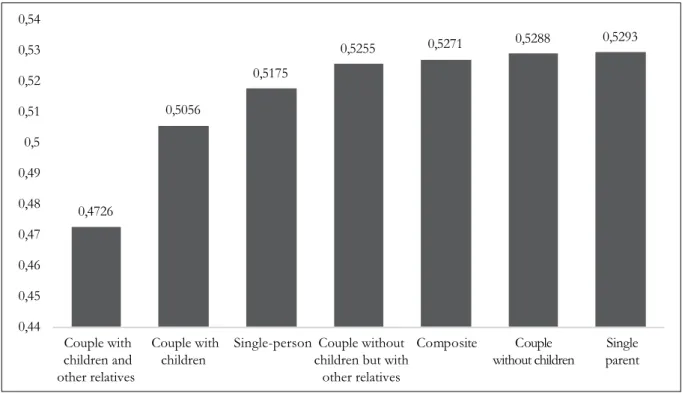
In addition, a more detailed study of the distribution of consumption found that the 10% of households with the highest consumption spent approximately 17 times more than the 10% of households with the lowest consumption. This inequality in the distribution of consumption is evidenced by a Gini coefficient of 0.55.
The household arrangement with the best distribution of annual consumption was the couple with children and other relatives. At the other extreme, the single-parent arrangement shows had the most unequal total consumption distribution (Figure 1).
Figure 1. Gini coefficient for annual consumption according to home arrangement. Brazil, 2009.
0,4726
0,5056
0,5175
0,5255 0,5271 0,5288 0,5293
0,44 0,45 0,46 0,47 0,48 0,49 0,5 0,51 0,52 0,53 0,54
Couple with children and other relatives
Couple with children
Single-person Couple without children but with
other relatives
Composite Couple without children
614
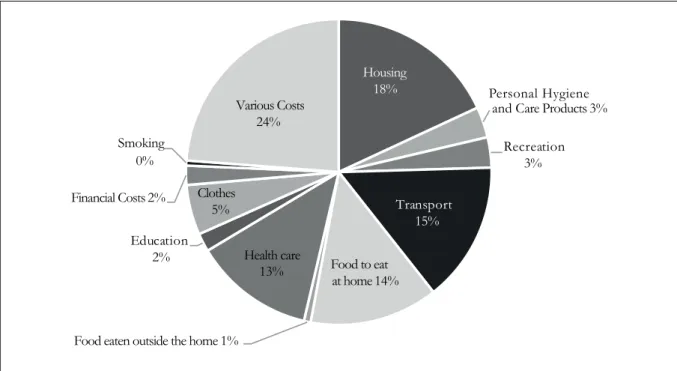
When studying the distribution of the categories of annual consumption of all the households in the study, a greater weight in the miscellaneous expenses category was found, followed by the category of housing, transportation and food. Data from the POF of 2002/200322 showed that housing expenses were the most important of consumption expenditure for all types of household composition. In terms of
food, other authors23 have considered that the main criterion of food choice in the population is price, where people are often aware of the importance of food for good health, but make choices that may benefit their health due to the resources available, and must evaluate what they can and should not buy. The less important categories were smoking, food eaten outside the home and education (Figure 2).
Figure 2. Distribution of consumption by cost category. Brasil, 2009.
Housing
18% Personal Hygiene
and Care Products 3% Recreation
3%
Transport 15%
Food to eat at home 14%
Food eaten outside the home 1%
Health care 13% Education
2%
Clothes 5% Financial Costs 2%
Smoking 0%
Various Costs 24%
The consumption distribution of the different household arrangements evidences a higher expenditure on housing and miscellaneous expenses, followed by health care and food eaten at home. The single-person arrangement had the highest consumption in three types of expenditures: housing, health care, and food eaten at home, accounting for 63.38% of its income. These data are in line with those presented in another study14, where it was found that in one-person and two person with spouse arrangements in Brazil, expenditures on housing, eating at home and health care were the highest in
the household arrangements studied. The couple with children arrangement stood out from the others in consumption on education and transport (Table 3), which can be explained by the presence of children at home and by the stage of the life cycle of the family.
615
Table 3. Percentage distribution of consumption by household arrangement. Brazil, 2009.
Spending variable/ Household arrangements
Composite Single relative
Single person
Couple with children
Couple with children and relatives
Couple without children
Couple without children but with relatives
Housing 19.57 17.83 26.86 15.64 15.26 19.51 19.48
Hygiene products 4.23 3.52 2.53 3.31 3.79 2.12 2.57
Recreation 3.75 3.32 2.78 3.60 3.36 2.38 2.84
Transport 10.99 13.18 6.93 18.52 16.66 15.90 14.64
Food eaten in the household
15.16 12.24 17.49 12.72 12.27 13.79 14.88
Food eaten outside the home
0.76 0.92 0.75 0.83 0.64 0.73 0.40
Health Care 14.13 10.24 19.03 11.48 9.65 16.43 14.50
Education 1.81 2.53 0.59 2.92 2.64 0.42 1.06
Clothing 6.27 5.99 4.51 5.30 6.47 3.58 3.98
Financial expenses 1.72 1.52 1.36 3.13 1.89 2.18 1.76
Smoking 0.49 0.66 0.40 0.46 0.51 0.52 0.62
Miscellaneous expenses 21.13 28.04 16.77 22.10 26.85 22.43 23.28
It is interesting to note that the items that were least consumed by all household arrangements in the study were smoking, financial expenses, education and meals outside the home, which can be explained by the stage of the life cycle of the elderly. Other studies24 also reveal that one of the most significant changes that older people have made in relation to their lifestyle is the cessation of tobacco use, since smoking is considered an increasing risk factor for diseases.
Although a limitation for the discussion of the results due to the difficulty in comparing studies, the research performed is made more relevant due to the lack of bibliographical materials that deal with the subject of the elderly public in the different home arrangements.
CONCLUSIONS
The accelerated process of aging of the Brazilian population and the consequent change in the demographic profile of the country has generated social and economic challenges and increased the need for research in the area of aging.
One of the most important social transformations that has occurred in society in recent years is related to the demographic increase of the elderly, due to the increase in life expectancy combined with a reduction in fertility rates. As a consequence, a new population group has started to consume different goods and services, searching for prices and brands that meet their needs, thus increasing market demand.
616
The items most consumed by the residential arrangements where the elderly were included were housing, health care and food within the household, which made up more than 40% of the income of five studied arrangements, except for couples with children, and a couples with children and relatives. The commitment of a large part of the income means that less financial resources are available for leisure and other types of expenses such as hygiene and clothing products.
There are still few studies on the elderly consumer, and it is necessary to carry out other works like this one, in order to enrich and complement this study, since to understand the consumer relations of this segment is extremely relevant if the goods and services offered are to provide satisfaction and improvement of the quality of life. The discussion raised is not exhaustively treated here, but it is believed that the results of this study contribute to the advance of researches into the behavior of the elderly consumer in different home arrangements.
REFERENCES
1. Carvalho AA, Alves JED. Padrões de consumo dos arranjos familiares e das pessoas que moram sozinhas no Brasil e em Minas Gerais: uma análise de gênero e renda. In: 14º Seminário sobre a Economia Mineira [Internet]; 2010; Diamantina. Diamantina: Cedeplar; 2010 [acesso em 19 dez 2015]. Disponível em: http:// www.cedeplar.ufmg.br/seminarios/seminario_ diamantina/2010/D10A074.pdf.
2. Osório AR, Pinto FC. As pessoas idosas: contexto social e intervenção educativa. Lisboa: Horizontes Pedagógicos; 2007.
3. Instituto Brasileiro de Geografia e Estatística, Coordenação de Trabalho e Rendimento. Pesquisa Nacional por Amostra de Domicílios: Síntese de Indicadores 2015. Rio de Janeiro: IBGE; 2016.
4. Guimarães JRS. Envelhecimento populacional e oportunidades de negócios: o potencial mercado da população idosa. Caxambu: ABEP; 2006.
5. Medeiros M, Carvalho M, Barros RP, Soares S. Notas técnicas sobre a recente queda da desigualdade de renda no Brasil. In: Barros RP, Foguel MN, Ulyssea G, organizadores. Desigualdade de renda no Brasil: uma análise da queda recente. v. 2. Brasília, DF: IPEA; 2006.
6. Carvalho AA. Padrão de consumo de arranjos familiares e das pessoas sozinhas no Brasil: uma análise por gênero e estratos econômicos [dissertação]. Rio de Janeiro: ENCE/IBGE; 2010.
7. Amaro LE, Meira PR. Consumidores idosos: aspectos do seu comportamento de consumo. COLÓQUIO. Rev Cient Faccat. 2012;6(1-2):9-20.
8. Lopes EV, Garcia E, Santos VM, Schiavo MA. O novo consumidor idoso: identificação dos atributos varejistas relevantes. Rev Admin Empresas. 2013;53(6):551-64.
9. Ventura R. Mudanças no perfil do consumo no Brasil: principais tendências nos próximos 20 anos. Rio de Janeiro: Macroplan; 2010.
10. Rodrigues PMA. As representações sociais do consumidor idoso acerca das normas que tutelam o consumo na terceira idade [dissertação]. Viçosa: Universidade Federal de Viçosa; 2011.
11. Solomon MR. O comportamento do consumidor: comprando, possuindo e sendo. 5ª ed. Porto Alegre: Bookman; 2002.
12. Medeiros F. A hora da verdade: reflexões sobre o comportamento de consumo na indústria da beleza. Comun Mercado. 2016;5(12):59-69.
13. Almeida NA. Determinantes do consumo de famílias com idosos e sem idosos com base na pesquisa de orçamentos familiares 1995/96 [dissertação]. Piracicaba: Universidade de São Paulo, Escola Superior de Agricultura Luiz de Queiroz; 2002.
14. Melo NCV. Consumo por idosos em arranjos familiares unipessoal e residindo com o cônjuge: análise de dados da POF 2008/2009 [dissertação]. Viçosa: Universidade Federal de Viçosa; 2013.
15. Instituto Brasileiro de Geografia e Estatística. Síntese de indicadores sociais: Uma análise das condições de vida da população brasileira - 2010. Rio de Janeiro: IBGE; 2010. (Estudos e Pesquisas. Informação Demográfica e Socioeconômica)
16. Brasil. Ministério da Saúde. Estatuto do idoso. Brasília, DF: MS; 2013.
17. Fávero LP. Métodos quantitativos com Stata. Rio de Janeiro: Elsevier; 2014.
617
19. Instituto Brasileiro de Geografia e Estatística. Indicadores Sociais Municipais: uma análise dos resultados do Censo Demográfico 2010. Estudos e Pesquisas. Informação Demográfica e Socioeconômica. Rio de Janeiro: IBGE; 2011.
20. Küchemann BA. Envelhecimento populacional, cuidado e cidadania: velhos dilemas e novos desafios. Soc Estado. 2012;27(1):165-80.
21. Bertuzzi D, Paskulin LGM, Moraes EP. Arranjos e rede de apoio familiar de idosos que vivem em uma área rural. Texto & Contexto Enferm. 2012;21(1):158-66.
22. Instituto Brasileiro de Geografia e Estatística. Pesquisa de Orçamentos Familiares (2008-2009): perfil das despesas no Brasil. Rio de Janeiro: IBGE; 2012.
23. Defante LR, Nascimento LDO, Lima-Filho DO. Comportamento de consumo de alimentos de famílias de baixa renda de pequenas cidades brasileiras: o caso de Mato Grosso do Sul. Interações. 2015;16(2):265-76.
24. Souza MAH, Porto EF, Souza EL, Silva KI. Perfil do estilo de vida de longevos. Rev Bras Geriatr Gerontol. 2016;19(5):819-26.
Received: April 11, 2017 Reviewed: July 11, 2017