Reference Ranges for Ultrasonographic
Measurements of the Uterine Cervix in Low-Risk
Pregnant Women
Valores de referência das medidas ultrassonográ
fi
cas do
colo uterino em gestantes de baixo risco
Kleber Cursino Andrade
1Thaísa Guedes Bortoletto
1Cristiane Martins Almeida
1Renan Antonio Daniel
1Heloísa Avo
1Rodolfo Carvalho Pacagnella
1José Guilherme Cecatti
11Departament of Gynecology e Obstetrics, Faculdade de Ciências Médicas, Universidade Estadual de Campinas, Campinas, SP, Brazil Rev Bras Ginecol Obstet 2017;39:443–452.
Address for correspondence José Guilherme Cecatti, MD, PhD, Rua Alexander Fleming, 101, 13083-891, Campinas, SP, Brazil
(e-mail: [email protected]).
Keywords
►
ultrasound
►
uterine cervix
►
cervical length
►
reference ranges
►
low-risk pregnancy
Abstract
Objective
To de
fi
ne transvaginal ultrasound reference ranges for uterine cervix
measurements according to gestational age (GA) in low-risk pregnancies.
Methods
Cohort of low-risk pregnant women undergoing transvaginal ultrasound exams
every 4 weeks, comprising measurements of the cervical length and volume, the transverse
and anteroposterior diameters of the cervix, and distance from the entrance of the uterine
artery into the cervix until the internal os. The inter- and intraobserver variabilities were
assessed with the linear correlation coef
fi
cient and the Student
t
-test. Within each period of
GA, 2.5, 10, 50, 90 and 97.5 percentiles were estimated, and the variation by GA was
assessed with analysis of variance for dependent samples. Mean values and Student
t
-test
were used to compare the values strati
fi
ed by control variables.
Results
After con
fi
rming the high reproducibility of the method, 172 women
followed in this cohort presented a reduction in cervical length, with an increase in
volume and in the anteroposterior and transverse diameters during pregnancy. Smaller
cervical lengths were associated with younger age, lower parity, and absence of
previous cesarean section (C-section).
Conclusion
In the studied population, we observed cervical length shortening
throughout pregnancy, suggesting a physiological reduction mainly in the vaginal
portion of the cervix. In order to better predict preterm birth, cervical insuf
fi
ciency and
premature rupture of membranes, reference curves and speci
fi
c cut-off values need to
be validated.
Resumo
Objetivo
Elaborar curvas de referências de medidas ultrassonográ
fi
cas de colo
uterino por idade gestacional (IG) em gestações de baixo risco.
Métodos
Coorte de gestantes de baixo risco, submetidas a ultrassom transvaginal
repetido a cada 4 semanas, com medida do comprimento, dos diâmetros
antero-received March 28, 2017 accepted July 7, 2017 published online August 4, 2017
DOIhttps://doi.org/ 10.1055/s-0037-1605556. ISSN 0100-7203.
Copyright © 2017 by Thieme Revinter Publicações Ltda, Rio de Janeiro, Brazil
Introduction
Approximately 15 million preterm births occur per year globally.1According to the World Health Organization, pre-mature babies are those delivered before 37 weeks of preg-nancy.1 Currently, preterm births are among the largest direct causes of neonatal deaths in the world, accounting for 35% of 3.2 million deaths occurring each year.2 It is estimated that the prevalence of preterm births is around 10% worldwide, being higher in countries with large pop-ulations, such as the United States, China and India, and in low- and middle-income countries such as Nigeria, Pakistan, and Indonesia, among others. These countries, including Brazil, are responsible for the largest number of preterm births in the world.2
Twin pregnancies or pregnancies with a history of pre-term births are groups at a higher risk for prepre-term birth.3 However, demographic, socioeconomic, and ethnic charac-teristics may have an impact on these rates.3,4Other clinical features can also play an important role in determining the risk of preterm birth, including maternal chronic diseases, alloimmune and autoimmune alterations, chromosomal abnormalities, uterine malformations, cervix surgeries, low body mass index (BMI), smoking, periodontal disease,3as well as genital and urinary tract infections.5Some authors point out that certain phenotypic groups can be more susceptible to preterm birth,6 while others suggest that racial differences can also be a determining factor.4However, although some risk factors are associated with prematurity, little is still known about the real causes of preterm birth.
A strategy for the early identification of women at higher risk of preterm birth is monitoring the physiological changes preceding labor.7–9Among these modifications, the cervical effacement process seems to be an important predictor of
preterm birth. Cervix alterations, which start a few weeks before labor, are a consequence of biochemical mechanisms that will culminate with cervical effacement and labor.10
The cervical stroma is composed of80 to 85% offibrous connective tissue and 10% of smooth muscle, determining a passive biomechanical force not derived from muscular contractility itself.10In parturition, the stroma of the uterine cervix undergoes a complex biochemical and biomechanical alteration, progressing from a completely closed and long cervix to a wedge-shaped cervix until reaching the total shortening of the cervix and the thinning of the walls.
Cervical shortening, when diagnosed ultrasonographi-cally between weeks 20 and 24, is an important risk factor for preterm birth.11This has been identified in populations with different risk profiles, varying from pregnant women with low-risk, single and asymptomatic gestations to women with high-risk pregnancies due to either a history of preterm birth or twin pregnancy.12
Along with the previous history of preterm birth, the measurement of the cervical length by transvaginal ultra-sound (US) scan is currently the most appropriate available parameter for the prediction of preterm birth. It is highly recommended in several widely recognized guidelines, since there is evidence on interventions that may reduce the risk of prematurity.13 Both the daily administration of vaginal progesterone14and the use of cervical pessaries15are recog-nized as alternative treatments to reduce the risk of preterm birth in women with a short cervix.
Since at least two decades ago, there is a consensus regard-ing the concept that the shorter the cervix, the higher the risk of prematurity. However, there are still divergences regarding the parameter to be considered as the best cut-off point for the prediction of preterm birth in different populations, with values ranging from less than 25 mm16–20to less than 15 mm.21
posterior e transverso, da distância entre a entrada da artéria uterina no colo e o orifício
interno, e do volume do colo. Foi avaliada a variabilidade inter e intraobservador entre
as medidas com o coe
fi
ciente de correlação linear e teste
t
de Student. Para cada faixa
de IG, estimaram-se os percentis 2,5, 10, 50, 90 e 97,5 dos valores das medidas, com a
variação por IG avaliada por análise de variância para amostras dependentes. As
comparações dos valores por variáveis de controle foram feitas por meio dos cálculos
de médias e teste t de Student.
Resultados
Assegurada a alta reprodutibilidade do método, as 172 mulheres
acom-panhadas na coorte apresentaram redução das medidas de comprimento de colo com
o decorrer da gestação, com aumento de volume e dos diâmetros anteroposterior e
transverso. O menor comprimento cervical foi associado à menor idade materna,
menor paridade, e ausência de cesárea prévia.
Conclusão
Na população estudada foi observada redução no comprimento cervical
com o decorrer da gestação, sugerindo encurtamento
fi
siológico principalmente à
custa da porção vaginal do colo. Há a necessidade de validar tais curvas de referência e
pontos de corte especí
fi
cos para uma melhor predição de risco de parto pré-termo,
insu
fi
ciência cervical, e amniorrexe prematura.
Palavras-chave
►
ultrassom
►
colo uterino
►
comprimento
cervical
►
valores de
referência
Some authors suggest that the cervical length varies according to the population, and that may imply different risks that also depend on the specific gestational ages (GAs).4 Therefore, the definition of reference ranges for cervical measurements from different populations could be helpful to define a more appropriate propedeutic and therapeutic approach. With an US evaluation, it would be possible to establish standards for a reference population, thus enabling the identification of the early changes that lead to labor.
The purpose of this study was to define reference ranges for values of US measurements of the uterine cervix among low-risk pregnant women with GAs between 12 and 36 weeks, and to discuss thesefindings in the light of the current knowledge.
Methods
This was a prospective cohort study involving a single group of low-risk pregnant women. Those with GA below 16 weeks (estimated by reliable amenorrhea and/or early confi rmato-ry US) were included, and transvaginal and abdominal US exams were repeated at intervals ranging from 2 to 4 weeks, with thefirst evaluation occurring between 12 and 16 weeks. The study was conducted over a period of 18 months to allow the necessary number of pregnant women to be included and monitored until delivery.
Complete information on the measurements of the cervix of all participating women was collected, as well as informa-tion on epidemiology, evoluinforma-tion of pregnancy and childbirth. Women with any obstetric or clinical pathological conditions that could be associated with spontaneous or induced pre-term birth, such as diabetes, hypertension, heart and rare diseases, with risk factors for preterm birth, such as a history of prematurity, cerclage, recurrent miscarriage, uterine cer-vix surgery, uterine malformation, uterine myomatosis, fetal malformation, and premature rupture of membranes were excluded. The development of any of the aforementioned conditions during pregnancy was considered a reason to exclude the pregnant women from the study, but all data collected until that moment were considered in the analysis. The calculation of the sample size considered the mean cervical length of 44.2 mm and a standard deviation (SD) of 4.1 mm,22with a 2% difference from the populational mean, and a type I error of 0.01. The number needed to assess the mean length of the uterine cervix was calculated individually for each GA range, and the largest estimated size was chosen, that is, 144 women for the 33–36-week period. Considering a possible loss of up to 35% during follow-up, a minimum number of 200 pregnant women was estimated to be neces-sary to compose the sample.
The measurements obtained by US examination for each pregnant woman was the uterine cervix length, using the technique proposed by the Fetal Medicine Foundation, with the addition of a 90-degree rotation of the transducer, focusing the middle third of the cervix to enable the mea-surement of the transverse and anteroposterior diameters (►Fig. 1 and ►Fig. 2). Finally, the distance between the entrance of the right or left uterine arteries into the uterine cervix until the internal os was also evaluated, using an
oblique cross section to determine the supravaginal length of the cervix. The volume of the cervix was calculated using the formula for the volume of a cylinder,πR2h, whereR corre-sponded to the half of the transverse diameter of the cervix, andh, to its length. The total duration of the US abdominal examination was 25 minutes, while the transvaginal examination lasted around 10 minutes. The machine used for the US exam was the Toshiba Xario (Toshiba, Minato, Tokyo, Japan) with a multifrequencial probe of 3.6 to 8.8 MHz endocavity transducer for the endovaginal exam (Toshiba Xario PVT-661 VT Transducer).
The study was evaluated and approved by the Institutional Review Board of our institution (letter of approval number 367–2000). The pregnant women were identified among those attending prenatal care at the outpatient clinic, who were then invited to participate in the study. After agreeing to participate, they signed an informed consent form and underwent thefirst US exam. After that, the women had US exams scheduled monthly, which coincided with their prenatal care visits. The study followed all principles of the Declaration of Helsinki, which was reviewed in 2008. All the pregnant women had US Fig. 1 Ultrasound scan showing the measurement procedure for the uterine cervix. A-A: cervical length from the internal os (IO) to the external os (EO), with the cervical channel (arrow). B-B: Antero-posterior (AP) diameter of the uterine cervix.
exams performed by the same examiner. Only the group of women participating in the pilot study underwent the second exam, on the same day, performed by a different examiner, for the assessment of the interobserver variability; the exam was subsequently performed again by thefirst examiner for the assessment of the intraobserver variability. In those two situations, the observers were blind to all measurements to avoid the possibility of being biased by the knowledge of the previous measurements.
For the data analysis, a normal distribution was assumed for all collected data. At first, for the evaluation of inter- and intraobserver variabilities, the mean values (SD) of each US measurement obtained by thefirst examiner were compared with those obtained by the second examiner, with the differ-ences compared using the Studentt-test, as well as by the mean proportional variation between the two measurements. The variability was considered the lowest the highest was the linear correlation coefficient r when crossing the two measurements for all of the pregnant women. Reference ranges curves were then defined for the uterine cervix measurements, which were summarized by points at each four-week interval of GA, starting at week 12 until week 36. The curves were constructed from the medians of the measurements (percen-tile 50) and the confidence interval (CI) that determined the maximum (percentiles 90 and 97.5) and minimum limits (percentiles 10 and 2.5) of the curves. A comparison of the values was performed with the Friedman non-parametric analysis of variance throughout GA (since the residuals did not have a normal distribution) for repeated measurements of the same subject.
Likewise, the comparison analysis of the mean values for uterine cervix length measurements was conducted for each group determined by main control variables, including age, ethnicity/skin color, parity, cesarean section (C-section) his-tory, smoking habits, and sexual activity. Their mean values and SDs were compared using the Student t-test. These statistical procedures were performed using the Epi-Info (Centers for Disease Control and Prevention, Atlanta, GA,
US) and the Statistical Analysis System (SAS, SAS Institute, Cary, NC, US) softwares.
Results
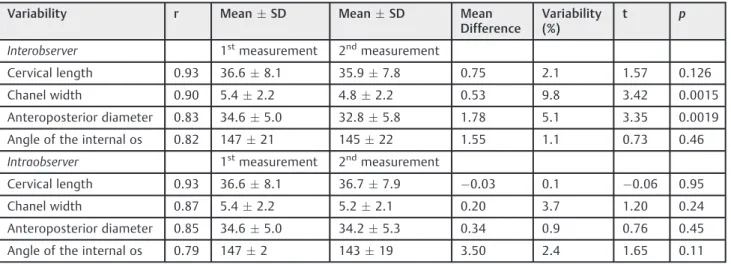
For the pilot study, 38 women were evaluated. ►Table 1 shows a small variability, from 0.1% to 9.8%, which means that the reproducibility was high, since the variations did not exceed 10%. Only the interobserver variabilities for the cervix canal width and for the anteroposterior diameter were significant, the only ones with a variation higher than 5%.
A total of 201 pregnant women were included in the study, and 172 concluded their participation with complete data, although not all of them underwent all the 6 planned exams. Of the 29 losses (14.4%), 18 were because they either gave up being cared for at the institution or they were referred elsewhere for delivery, 4 had an abortion, 2 had fetal death, 2 had preterm premature rupture of membranes, 2 had fetal malformations, and 1 had a cervical cerclage performed. They were then excluded from the analysis.
Upon admission to the study, the majority of women were between 20 and 24 years of age, white, married or had a partner, and hadfinished primary school. About one-third of them were pregnant for thefirst time, and almost 50% of them had never given birth. One-fourth of them had a history of abortion or C-section. A small minority smoked regularly during pregnancy (►Table 2).
The measurements of the uterine cervix length decreased slowly, yet significantly, with GA. However, the values regard-ing the distance between the entry point of the uterine artery into the cervix until the internal os showed a very slight increase variation with GA (►Table 3,►Fig. 3,►Fig. 4). The measurements of the anteroposterior and transverse diame-ters of the cervix, as well as the estimated cervical volume, showed a small but significant increase with the progression of GA (►Table 4,►Figs. 5–7).
The measurements of the uterine cervix length were controlled according to some possibly confounding
Table 1 Inter- and intraobserver variability of the ultrasonographic measurements of the uterine cervix (pilot samplen¼38)
Variability r MeanSD MeanSD Mean
Difference
Variability (%)
t p
Interobserver 1stmeasurement 2ndmeasurement
Cervical length 0.93 36.68.1 35.97.8 0.75 2.1 1.57 0.126
Chanel width 0.90 5.42.2 4.82.2 0.53 9.8 3.42 0.0015
Anteroposterior diameter 0.83 34.65.0 32.85.8 1.78 5.1 3.35 0.0019
Angle of the internal os 0.82 14721 14522 1.55 1.1 0.73 0.46
Intraobserver 1stmeasurement 2ndmeasurement
Cervical length 0.93 36.68.1 36.77.9 0.03 0.1 0.06 0.95
Chanel width 0.87 5.42.2 5.22.1 0.20 3.7 1.20 0.24
Anteroposterior diameter 0.85 34.65.0 34.25.3 0.34 0.9 0.76 0.45
Angle of the internal os 0.79 1472 14319 3.50 2.4 1.65 0.11
Table 2 Main sociodemographic characteristics of the sample population
Characteristics n (%)
Maternal age
19 36 (20.9)
20–24 61 (35.4)
25–29 40 (23.2)
30 35 (20.3)
Ethnicity/Skin color
White 123 (71.5)
Non-white 49 (28.5)
Marital status
Married 79 (45.9)
Single 27 (15.7)
Stable union 65 (37.8)
Separated 1 (0.6)
Schooling
Incomplete primary school 77 (44.8)
Complete primary school 28 (16.3)
Incomplete high school 32 (18.6)
Complete high school 29 (16.9)
Incomplete higher education 4 (2.3)
Complete higher education 2 (1.2)
Number of pregnancies
1 61 (35.5)
2 111 (64.5)
Parity
0 82 (47.7)
1 90 (52.3)
Previous abortion
0 132 (76.7)
1 40 (23.3)
Previous cesarean section
No 132 (76.7)
Yes 40 (233)
Smoking
Never 122 (70.9)
Not during pregnancy 24 (14.0)
1–10 cigarettes/day 16 (9.3)
11–20 cigarettes/day 4 (2.3)
>20 cigarettes/day 1 (0.6)
Only initial pregnancy 5 (2.9)
(Continued)
Table 2 (Continued)
Characteristics n (%)
Gestational age atfirst ultrasound exam (weeks)
12 24 (14.0)
13 45 (26.3)
14 24 (14.0)
15 47 (27.5)
16 31 (18.1)
Total 172 (100.0)
Table 3 Values of percentiles 2.5, 10, 50, 90 and 97.5 for the uterine cervical length and for the distance from the uterine artery to the internal os by ultrasound, according to gestational age, among low-risk pregnant women
Gestational age (n)
Cervical length (mm) (p<0.01)
p 2.5 p 10 p 50 p 90 p 97.5
12–16 (168) 31.5 36.1 44.1 57.1 64.4
17–20 (167) 30.2 33.2 40.8 51.4 59.8
21–24 (167) 29.4 33.9 41.4 51.7 55.5 25–28 (165) 27.6 31.6 40.8 48.5 53.5
29–32 (168) 21.0 29.3 38.1 46.8 50.5
33–36 (168) 19.5 26.4 35.8 44.7 49.0
Distance from the uterine artery to the internal os (mm)
(p¼0.03)
p 2.5 p 10 p 50 p 90 p 97.5
12–16 (168) 13.8 17.5 23.5 31.2 36.9
17–20 (167) 16.0 17.7 23.5 31.2 35.9
21–24 (167) 15.9 18.9 24.7 31.7 36.3
25–28 (165) 14.6 17.7 24.7 33.9 39.6 29–32 (168) 13.3 17.5 24.2 30.2 33.5
33–36 (168) 14.0 17.3 23.2 30.8 35.6
Note:Friedman non-parametric analysis of variance for repeated measurements.
factors. ►Table 5 shows that the cervical length had significantly higher values for women over 25 years of age, with 1 or more previous deliveries, and with a previ-ous C-section. These values were not associated with the women’s ethnicity/skin color, smoking habits, or the fre-quency of sexual intercourse.
Discussion
This was one of the few studies on cervical length measure-ments conducted among a Brazilian population involving a prospective evaluation throughout pregnancy until child-birth with a dependent sample strictly defined as low-risk. A detailed evaluation of multiple US parameters was con-ducted, enabling the definition of reference range curves for those measurements with percentile values, especially for the cervical length, which is more useful and applicable in practice. For decades, there has been great concern about the heterogeneity observed in studies of the uterine cervix for the prediction of preterm birth. Currently, there still is some Fig. 4 Curve of percentile values for the distance fromthe uterine
artery to the internal os, according to gestational age, among low-risk pregnant women.
Fig. 5 Curve of percentile values for the anteroposterior diameter of the cervix, according to gestational age, among low-risk pregnant women.
Fig. 6 Curve of percentile values for the transverse diameter of the cervix, according to gestational age, among low-risk pregnant women.
Fig. 7 Curve of percentile values for the volume of the uterine cervix by ultrasonography, according to gestational age, among low-risk pregnant women.
Table 4 Values of percentiles 2.5, 10, 50, 90 and 97.5 for the anteroposterior and transverse diameters, and for the volume of the uterine cervix by ultrasonography, according to gestational age, among low-risk pregnant women
Anteroposterior diameter of the cervix (mm) (p<0.01)
Gestational age (n) p 2.5 p 10 p 50 p 90 p 97.5
12–16 (168) 22.4 24.4 29.0 33.9 36.3 17–20 (167) 23.1 25.4 30.6 36.3 38.8
21–24 (167) 23.6 27.4 33.3 38.7 42.3
25–28 (165) 25.7 28.5 34.2 39.9 44.0
29–32 (168) 26.0 29.7 36.5 42.5 48.1
33–36 (168) 26.9 30.6 37.9 45.2 49.6
Transverse diameter of the cervix (mm) (p<0.01)
p 2.5 p 10 p 50 p 90 p 97.5
12–16 (168) 26.2 27.8 33.3 39.8 44.4
17–20 (167) 26.5 29.4 35.5 43.7 46.9 21–24 (167) 28.7 30.9 37.4 44.2 48.5
25–28 (165) 28.6 32.0 38.8 46.2 50.2
29–32 (168) 30.3 33.6 39.8 47.6 50.2
33–36 (168) 32.3 35.2 41.1 49.0 54.4
Volume of the cervix (cm3) (p<0.01)
p 2.5 p10 p 50 p 90 p 97.5
12–16 (168) 14.7 18.4 28.3 47.6 59.3
17–20 (167) 18.4 26.4 37.8 57.4 70.4
21–24 (167) 15.7 20.2 31.0 46.4 55.8 25–28 (165) 15.9 20.4 33.9 53.0 61.7
29–32 (168) 16.6 22.1 39.8 54.9 73.3
33–36 (168) 14.9 23.8 38.9 62.5 70.3
Note:
debate on the differences observed in uterine cervix meas-urements regarding different populations, the GA at screen-ing, the recommended periodicity for the US exams, and even regarding how their outcomes should be evaluated.23
Although this cohort was specifically followed in a single service, the examination technique used in this study was similar to what is currently practiced. Discussions are likely to be raised concerning some issues of this study, such as the characteristics of the women cared for in this healthcare facility, and whether the sample represents the population of low-risk pregnant women in the country, which could be a limitation of the study. We found that the technique used in this study was appropriate for the purposes of the investiga-tion, especially considering that inter- and intraobserver variabilities were low.
Among all cases followed-up until the end of pregnancy, not a single preterm birth occurred. This was somewhat unexpected, since the preterm birth rate for the general pregnant population in Brazil is around 10%.2However, it also possibly reveals that the inclusion/exclusion criteria used made it possible to select a very low-risk sample of
pregnant women. If the selection of a very specific popula-tion may imply, on one hand, limitapopula-tions for generalizapopula-tions, on the other hand, the absence of preterm births can be understood as a benchmark, allowing to adequately show the physiology of the natural shortening of the uterine cervix in fully regular gestations.
The length of the uterine cervix showed a statistically significant decrease during pregnancy. The 50th percentile ranged from 44.1 mm at 12–16 weeks to 35.8 mm at 33–36 weeks. In a similar Brazilian study,24the authors found 36 mm for the 50th percentile at week 23, and 29 mm at week 34. These values are smaller than the ones from our study, and that could possibly be explained by the fact that the aforemen-tioned study had a preterm birth rate of 8.8% between weeks 34 and 37. However, despite the difference, the same pattern of cervical shortening was observed with GA.
The uterine cervix seems to become slightely longer with maternal age, even though no changes were observed in its anteroposterior and transverse diameters. However, these values increased also with parity. These two findings are consistent with another Brazilian study that demonstrated Table 5 Variability of uterine cervical length according to some control variables (meanstandard deviation)
Characteristics Gestational age (weeks) n
12–16 17–20 21–24 25–28 29–32 33–36
Maternal age
Up to 24 years 44.38.2 41.37.3 41.26.9 39.16.6 36.27.8 33.77.4 97
25 years 47.28.5 43.26.9 42.46.9 41.87.3 39.47.4 37.56.7 75
p 0.02 0.08 0.25 0.01 0.008 0.0008
Ethnicity/Skin color
White 45.58.1 42.16.5 41.56.2 40.66.6 37.27.1 35.27.2 123
Non-white 45.79.3 42.38.7 42.48.3 39.48.0 38.59.2 35.97.8 49
p 0.85 0.89 0.43 0.3 0.33 0.53
Parity
0 43.77.9 41.46.9 40.85.6 38.86.4 36.07.2 33.67.6 82
1þ 47.28.6 42.97.3 42.67.8 41.67.3 39.17.9 37.06.8 90
p 0.006 0.17 0.08 0.01 0.01 0.002
Previous cesarean section
No 44.98.3 41.67.2 41.16.4 39.46.6 36.87.9 34.37.1 132
Yes 47.78.8 44.06.7 43.88.0 43.17.5 40.36.3 38.97.1 40
p
0.07 0.06 0.03 0.003 0.01 0.0005
Smoking
Never 45.88.6 41.87.2 41.56.5 39.86.9 36.87.5 35.17.0 122
Sometimes 44.98.1 43.06.9 42.47.7 41.57.2 39.58.1 36.18.1 50
p
0.55 0.32 0.42 0.17 0.04 0.41
Sexual activity during pregnancy
Up to once a week 46.98.9 42.97.8 42.57.4 40.47.4 38.28.6 35.97.5 87
twice a week 44.17.8 41.46.4 40.96.2 40.26.6 37.06.8 34.97.2 85
p
0.02 0.16 0.15 0.86 0.32 0.38
that the uterine cervix is significantly shorter in women younger than 20 years and primiparous.25In addition in our study, a previous C-section was also associated with longer cervical length. Thesefindings may suggest that pregnancies are most likely to cause an increase in the length of the cervix, and then the age and history of C-section would be just confounding factors for this association, since they are also parity-related.
The values of the anteroposterior and transverse diameters also presented a minor increase with GA, outlining an assump-tion that the shortening and enlargement of the cervix could occur, simultaneously and physiologically, with the increase in GA. The volume also presented a minor increase during preg-nancy, which was statistically significant, from 28 cm3at 12
–16
weeks to 39cm3at 33
–36 weeks. This could even explain the reason why several shortened uterine cervices during preg-nancy did not result in preterm births. In►Fig. 8we present a schematic model of how this physiological shortening pro-gresses during the course of gestation. In addition, other studies involving much larger populations also concluded that the cervical length decreased significantly with GA.26
Another issue refers to the actual clinical relevance of a small difference found in cervical length when comparing two measurements. A difference of 2 mm, for instance, is in fact greater than the inherent variability of the measurement method (0.75 mm), exceeding the margin of error of the US. Our hypothesis is that, although there is a difference, it should be interpreted within a natural physiological devel-opment of pregnancy, thus showing a gradual decrease in the length of the cervix over the weeks that may or may not be associated with maternal characteristics. In addition, partic-ular attention should also be paid to the pressure the examiner applies to the probe, which could make a differ-ence in the measurement taken, as well as the existdiffer-ence of a concomitant uterine contraction that could also modify the shape and length of the cervix.
By establishing an anatomical reference that divided the cervix into two parts, it was possible to evaluate the behavior of the measurements of these parts at different GAs. The measurement of the distance between the entrance of the uterine artery into the cervix until the internal os showed a
very low variation during gestation, suggesting that the decrease in the length of the uterine cervix during pregnancy is most probably due to the shortening of the distal portion of the cervix, the vaginal portion.
The change in cervical length was the largest observed when compared with other measurements also changing during pregnancy. It seems to be the simplest and easiest to be obtained and reproduced. Some authors suggest that the initial evaluation of the cervix can be obtained also with an abdominal exam.27However, the unpredictable effect of the volume of the bladder on the elongation of the cervix and the difficulty of its visualization due to obstruction by fetal parts can lead to unsatisfactory images in up to 25% of the cases.27 Different from what has already been said about the trans-vaginal evaluation, this method still presents significant divergences in its standardization,28,29and it does not ex-clude the need for the complementary transvaginal exam, when the cervical shortening is identified.28
The main objective of this study was to define reference range values of US measurements of the uterine cervix for low-risk pregnant women according to GA, from 12 to 36 weeks, and to associate these values with some obstetric, sociodemographic and lifestyle variables. It was not the purpose of this study to assess the ability of those measure-ments to predict preterm birth.
A significant difference in the length of the cervix with maternal age was observed, which is in agreement with a study that evaluated 40,000 women and proposed a model for the prediction of preterm birth, showing a sensitivity of around 55% when considering only the cervical length; the sensitivity increased to 69% when the obstetric history and the maternal age were added to the model.30
In a systematic review conducted in 2010, Domin et al31 suggested that, for preterm delivery prediction, the US assess-ment of the cervix, when stratified by GA, was more sensitive after 20 weeks than prior to that (58% versus 28.2%), although it was less specific (82% versus 98.5%). That means that when a pregnant woman with a shortened cervix is identified with less than 20 weeks of GA, the risk of this woman progressing to a preterm delivery is close to 100%. However, when evaluating women over 20 weeks of GA, the risk of identifying women
who may progress to preterm birth is almost twice higher than when the cervix is evaluated before 20 weeks. The authors also performed a stratification by maternal risk, and concluded that the test showed a better performance for low-risk women, considering that the area under the receiver operating charac-teristic (ROC) curve was 0.88 for low-risk versus 0.80 for high-risk women.
In a recent meta-analysis, Conde-Agudelo and Romero8 identified the absence of standard reference values for cervical length as a limitation of the studies, but they concluded that the performance of a single measurement between 18 and 24 weeks was not better than the serial evaluations.
All of thesefindings may allow us to conclude that the expected cervical changes during pregnancy are the short-ening and the enlargement of the cervix with a slight increase in volume, and that the specific values depend on some specific factors regarding the pregnant woman, such as maternal age and obstetric history.
The scientific literature on the topic could be considered biased, since the majority of the studies is only performed on populations from high-income countries. The discrepancy is clearly observed in review articles, with an absolute pre-dominance of studies from the USA and Europe.8,9,13,15,31,32 One could, therefore, ask how to adequately address the risk factors for populations as racially mixed as the Brazilian population. The interpretation of data on ethnicity is still conflicting. In the Preterm Prediction Study,33for instance, ethnicity was a factor that contributed to the risk of preterm birth in nulliparous women, but it could be argued that this effect could be the result of other confounding factors, such as the poor social environment.
In Brazil, a large multi-center study34involving more than 5,000 women from the 3 most populous regions of the country was not able tofind any evidence of behavioral or sociodemo-graphic factors, including ethnicity/skin color, associated with preterm delivery. Moreover, recent data also suggest that even different physiological changes can occur during the gesta-tional period in Caucasian and in Afro-descendent women.2 This is based on evidence that shows that newborns with a lower GA, mostly afro-descendants,35do not show the same rates of respiratory complications, intensive care needs, or neonatal mortality as the Caucasians.2
Conclusion
It seems clear that we are going down a path in which universal screening for cervical length will be recommended; however, in order for this to become a reality, stricter criteria are needed. The best approach for the assessment of the low-risk popula-tion should probably be a single evaluapopula-tion with a transvaginal US exam, possibly during the fetal morphological evaluation, at around 20 weeks of GA. Thus, the definition of reference ranges for cervical measurements during pregnancy, especial-ly those showing lower limits (percentiles 2.5 and 10), for a low-risk population, should enable diagnoses of changes occurring in those measurements. In order for this to happen, it will be necessary to validate such curves and appropriate cut-off points in similar populations for the prediction of
the risk of preterm birth, cervical insufficiency, or even pre-mature rupture of membranes.
In a country with relatively scarce resources for healthcare such as Brazil, where medical routine imposes decision-making based on a limited amount of information, the parameters to be used should be precise to avoid inappro-priate managements that generate extra expenses caused by unnecessary treatments and repetition of exams.
Conflict of Interests
Cecatti JG is an Associate Editor of Revista Brasileira de Ginecologia e Obstetrícia, and did not participate in the evaluation process of this article.
Contributors
Andrade KC, Bortoletto TG, Almeida CM, Daniel RA, Avo H, Pacagnella RC, and Cecatti JG contributed to the conception of the study, the critical review of the intellectual content, and thefinal approval of the version to be published.
Acknowledgments
This study was sponsored by a grant from Fundção de Amparo à Pesquisa do Estado de São Paulo (Fapesp), under process number 2001/00761–4.
References
1 Preterm birth: Fact Sheet. World Health Organization Web site. Published November 2016. http://www.who.int/mediacentre/ factsheets/fs363/en/. Accessed March 10, 2017
2 Blencowe H, Cousens S, Chou D, et al; Born Too Soon Preterm Birth Action Group. Born too soon: the global epidemiology of 15 million preterm births. Reprod Health 2013;10(Suppl 1):S2
3 Koullali B, Oudijk MA, Nijman TA, Mol BW, Pajkrt E. Risk assess-ment and manageassess-ment to prevent preterm birth. Semin Fetal Neonatal Med 2016;21(02):80–88
4 Buck JN, Orzechowski KM, Berghella V. Racial disparities in cervical length for prediction of preterm birth in a low risk population. J Matern Fetal Neonatal Med 2017;30(15): 1851–1854
5 Bittar RE, Zugaib M. [Risk predictors for preterm birth]. Rev Bras Ginecol Obstet 2009;31(04):203–209
6 Manuck TA, Esplin MS, Biggio J, et al; Eunice Kennedy Shriver National Institute of Child Health and Human Development Genomics and Proteomics Network for Preterm Birth Research. The phenotype of spontaneous preterm birth: application of a clinical phenotyping tool. Am J Obstet Gynecol 2015;212(04):487. e1–487.e11
7 Romero R, Nicolaides K, Conde-Agudelo A, et al. Vaginal proges-terone in women with an asymptomatic sonographic short cervix in the mid-trimester decreases preterm delivery and neonatal morbidity: a systematic review and metaanalysis of individual patient data. Am J Obstet Gynecol 2012;206:124.e1–124.e19
8 Conde-Agudelo A, Romero R. Predictive accuracy of changes in transvaginal sonographic cervical length over time for preterm birth: a systematic review and metaanalysis. Am J Obstet Gynecol 2015;213(06):789–801
9 Li Q, Reeves M, Owen J, Keith LG. Precocious cervical ripening as a screening target to predict spontaneous preterm delivery among asymptomatic singleton pregnancies: a systematic review. Am J Obstet Gynecol 2015;212(02):145–156
cervical stroma during pregnancy. Semin Perinatol 2009; 33(05):300–307
11 Sinno A, Usta IM, Nassar AH. A short cervical length in pregnancy: management options. Am J Perinatol 2009;26(10):761–770
12 Vaisbuch E, Romero R, Erez O, et al. Clinical significance of early (<20 weeks) vs. late (20-24 weeks) detection of sonographic
short cervix in asymptomatic women in the mid-trimester. Ultrasound Obstet Gynecol 2010;36(04):471–481
13 Suhag A, Berghella V. Short cervical length dilemma. Obstet Gynecol Clin North Am 2015;42(02):241–254
14 Romero R, Nicolaides KH, Conde-Agudelo A, et al. Vaginal pro-gesterone decreases preterm birth34 weeks of gestation in women with a singleton pregnancy and a short cervix: an updated meta-analysis including data from the OPPTIMUM study. Ultra-sound Obstet Gynecol 2016;48(03):308–317
15 Abdel-Aleem H, Shaaban OM, Abdel-Aleem MA. Cervical pessary for preventing preterm birth. Cochrane Database Syst Rev 2013; (05):CD007873
16 Fox NS, Rebarber A, Roman AS, Klauser CK, Saltzman DH. Associa-tion between second-trimester cervical length and spontaneous preterm birth in twin pregnancies. J Ultrasound Med 2010; 29(12):1733–1739
17 Ramaeker DM, Simhan HN. Sonographic cervical length, vaginal bleeding, and the risk of preterm birth. Am J Obstet Gynecol 2012; 206(03):224.e1–224.e4
18 Wozniak S, Czuczwar P, Szkodziak P, Milart P, Wozniakowska E, Paszkowski T. Elastography in predicting preterm delivery in asymptomatic, low-risk women: a prospective observational study. BMC Pregnancy Childbirth 2014;14:238
19 Kuusela P, Jacobsson B, Söderlund M, et al. Transvaginal sono-graphic evaluation of cervical length in the second trimester of asymptomatic singleton pregnancies, and the risk of preterm delivery. Acta Obstet Gynecol Scand 2015;94(06):598–607
20 Miller ES, Tita AT, Grobman WA. Second-trimester cervical length screening among asymptomatic women: an evaluation of risk-based strategies. Obstet Gynecol 2015;126(01):61–66
21 Heath VC, Southall TR, Souka AP, Novakov A, Nicolaides KH. Cervical length at 23 weeks of gestation: relation to demographic characteristics and previous obstetric history. Ultrasound Obstet Gynecol 1998;12(05):304–311
22 Podobnik M, BulićM, SmiljanićN, Bistricki J. Ultrasonography in
the detection of cervical incompetency. J Clin Ultrasound 1988; 16(06):383–391
23 Guzman ER, Ananth CV. Cervical length and spontaneous pre-maturity: laying the foundation for future interventional rando-mized trials for the short cervix. Ultrasound Obstet Gynecol 2001; 18(03):195–199
24 Silva SV, Damião R, Fonseca EB, Garcia S, Lippi UG. Reference ranges for cervical length by transvaginal scan in singleton pregnancies. J Matern Fetal Neonatal Med 2010;23(05):379–382
25 Palma-Dias RS, Fonseca MM, Stein NR, Schmidt AP, Magalhães JA. Relation of cervical length at 22-24 weeks of gestation to demo-graphic characteristics and obstetric history. Braz J Med Biol Res 2004;37(05):737–744
26 Hoesli IM, Strutas D, Tercanli S, Holzgreve W. Charts for cervical length in singleton pregnancy. Int J Gynaecol Obstet 2003;82(02):161–165
27 Peng CR, Chen CP, Wang KG, Wang LK, Chen CY, Chen YY. The reliability of transabdominal cervical length measurement in a low-risk obstetric population: Comparison with transvaginal measurement. Taiwan J Obstet Gynecol 2015;54(02):167–171
28 Friedman AM, Schwartz N, Ludmir J, Parry S, Bastek JA, Sehdev HM. Can transabdominal ultrasound identify women at high risk for short cervical length? Acta Obstet Gynecol Scand 2013; 92(06):637–641
29 Hernandez-Andrade E, Romero R, Ahn H, et al. Transabdominal evaluation of uterine cervical length during pregnancy fails to identify a substantial number of women with a short cervix. J Matern Fetal Neonatal Med 2012;25(09):1682–1689
30 To MS, Skentou CA, Royston P, Yu CKH, Nicolaides KH. Prediction of patient-specific risk of early preterm delivery using maternal history and sonographic measurement of cervical length: a population-based prospective study. Ultrasound Obstet Gynecol 2006;27(04):362–367
31 Domin CM, Smith EJ, Terplan M. Transvaginal ultrasonographic measurement of cervical length as a predictor of preterm birth: a systematic review with meta-analysis. Ultrasound Q 2010; 26(04):241–248
32 Conde-Agudelo A, Romero R, Nicolaides K, et al. Vaginal progester-one vs. cervical cerclage for the prevention of preterm birth in women with a sonographic short cervix, previous preterm birth, and singleton gestation: a systematic review and indirect comparison metaanalysis. Am J Obstet Gynecol 2013;208(01):42.e1–42.e18
33 Mercer BM, Goldenberg RL, Das A, et al. The preterm prediction study: a clinical risk assessment system. Am J Obstet Gynecol 1996;174(06):1885–1893, discussion 1893–1895
34 Passini R Jr, Cecatti JG, Lajos GJ, et al; Brazilian Multicentre Study on Preterm Birth study group. Brazilian multicentre study on preterm birth (EMIP): prevalence and factors asso-ciated with spontaneous preterm birth. PLoS One 2014;9(10): e109069