Indirect selection criteria against clean wool colour in Corriedale sheep and
their effects on wool production traits
M.V. Benavides
1and A.P. Maher
2 1EMBRAPA - Pecuária Sul, Bagé, RS, Brazil.
2Wool Science Department, Lincoln University, Canterbury, New Zealand.
Abstract
The potential of greasy wool colour subjective assessment Visual Colour Score (VCS) and the yellow predictive test (YPC) as indirect selection criteria for reduction of clean wool colour (CWC) in Corriedale sheep was examined. The heritability of these wool colour traits and the wool production traits, greasy (GFW) and clean fleece weights (CFW), and mean fibre diameter (MFD) and the phenotypic and genetic correlations among these traits were estimated from a Corriedale flock using AIREML procedures. A high genetic correlation between YPC and CWC was observed, indicating that YPC could be a suitable indirect selection criterium for CWC. However, direct selection against CWC was predicted to produce faster genetic improvements in CWC than that expected under indirect selection via YPC. Single trait selection based on VCS or YPC were expected to reduce the response in CWC to 51% and 49% of that estimated for direct selection. The positive genetic correlations of CWC, YPC and VCS with CFW and MFD would cause a reduction in both MFD and CFW to result from selection that reduces wool colour. The results showed that the most effective way to genetically improve CWC was through indirect selection to reduce MFD, CFW or GFW, followed by direct selection, but the premiums for CWC in the Corriedale breed may not be sufficient to justify the expected losses in CFW.
Key words:wool yellowing susceptibility, genetic parameter estimates, selection responses.
Received: December 14, 2000; accepted: July 7, 2002.
Introduction
Reductions in clean wool colour are sought by wool breeders because yellow wool is penalised in price due to a loss in versatility in dyeing. Studies on the genetics of wool yellowing have found that the heritability of clean wool col-our (CWC) - measured in Y-Z units - varies from 0.04±0.07 in Romney sheep in New Zealand (Hawkeret al., 1988) to 0.42±0.14 for Collinsville Merinos in Australia (Jameset al., 1990). The variation between these heritability estimates might have been due to environmental variation caused by differences in weather conditions between the locations of these studies. The incidence of yellow wool is notably higher in warmer and wetter weather conditions. Consequently, se-lection based on scoured wool colour is likely to be ineffec-tive since the trait is unlikely to be adequately expressed in all locations in all years. The finding of a suitable indirect se-lection criterion may be a better approach to sese-lection against wool yellowing in low rainfall areas.
The potential for selection of wool colour traits, namely visual colour score of greasy (VCS) wool and
yel-low predictive colour (YPC) as indirect selection criteria against CWC, were investigated. The YPC technique was developed by Wilkinson (1981), and is based on the incuba-tion of wool samples at warm temperature and high humid-ity. The technique mimics the environmental conditions favourable for wool yellowing. The resulting YPC score should equate to the level of wool yellowing found under highly challenging weather conditions. Yellow predictive colour has previously been studied as an indicator of the susceptibility of sheep to wool yellowing (Wilkinson, 1981) and fleece rot (Cottle, 1996).
The objectives of the current experiment were to es-tablish the genetic correlation between CWC and YPC to evaluate YPC as indirect selection criterium against clean wool colour and to estimate the correlated responses in other wool production traits.
Material and methods
Animals
Data were collected from the Corriedale sire progeny test flock (Sheep Breeding Unit, Lincoln University, Can-terbury) described in Benavideset al. (1998). A total of 440 www.sbg.org.br
contemporary progeny from 19 sires and 253 dams were tested, with an average of 22 offspring per sire. Sire selec-tion was based on superiority in greasy fleece weight (GFW) and/or liveweight. Each sire was mated to 25 ran-domly allocated ewes.
All lambs were first shorn in January, at approxi-mately 18 weeks of age. Greasy fleece weight, clean fleece weight (CFW) and Yield were determined at shearing in August and in October of each year for ram and ewe hog-gets, respectively. However, mean fibre diameter (MFD), CWC, YPC and VCS were determined from midside sam-ples taken in August from both sexes in each year in accor-dance with AS/NZS (1999a).
Clean wool colour was measured in Y-Z units on scoured samples after the wool tips and any vegetable mat-ter had been removed. Samples were cut into 20 mm lengths and air-blended. Clean wool colour was measured, recording the X, Y, and Z tristimulus values using a Hunterlab D25 colorimeter with the illuminant 2/10° (New Zealand Standards, 1984).
Clean fleece weight was obtained from measure-ments of scoured yield and GFW according to the Austra-lian/New Zealand Draft Standard for flock testing (AS/NZS 1999b). The samples were scoured, dried at 60 °C for 20 min, and then conditioned for 12 h at 20 ±2 °C and 65±2% relative humidity to calculate scoured yield. Clean sample weight was recorded at 16% regain for scoured yield calculations. Clean fleece weight was calculated from GFW based on scoured yield at 16% regain.
Mean fibre diameter was measured by Optical Fibre Diameter Analyser (AS/NZS, 1999c) (International Wool Textile Organisation, 1995). Visual greasy wool colour score (VCS) was subjectively assessed and scored from 1 to 10, score 1 being white wool and 10 being intense yellow discoloured. Wool yellowing susceptibility was deter-mined using the YPC technique described by Raadsma and Wilkinson (1990).
Statistical analysis
Data were analysed using the General Linear Model (GLM) procedure of SAS V6 (SAS/STAT, 1990) to deter-mine significant effects. Year of birth, sex, age of dam, birth and rearing ranks were fitted as fixed effects. Date of birth was fitted as a covariate and sire within year was in-cluded as a random effect.
The model fitted to each variable was:
Yijklmno=µ+ yi+ xj+ ak+ brl+ rrm+ dobijklmno+ sn(yi) +
eijklmno
where Yijklmnowas the record of theoth individual;µwas the
population mean; yiwas the year of birth; xjwas the sex; ak
was the age of dam; brlwas the birth rank, rrmwas the
rear-ing rank; dobijklmnowas the date of birth; sn(yi) was the sire
within year of birth, and eijklmnowas the residual error.
For GFW, CFW and Yield traits, sex was confounded with time of sampling. Interactions between fixed effects were initially fitted in the model. Non significant interac-tions and effects (p≥ 0.05) were removed from the final analysis. Estimates of heritability and genetic and pheno-typic correlations were calculated using the animal model of the Average Information Restricted Maximum Likeli-hood programme (AIREML) (Johnson and Thompson, 1995).
Restricted selection indices were calculated using the SELIND2 programme (Cunningham and Mahon, 1977) based on combined heritability, phenotypic and genetic correlation estimates of the traits studied. The relative eco-nomic values (REV) for the breeding objective traits were calculated by regression analyses from Wools of New Zea-land wool prices data for the three wool selling seasons 96/97-98/99. The regression equations of price on MFD and CWC were: NZ¢ = 765 7.99 MFD and NZ¢ = 550 -10.3 Y-Z respectively (both p < 0.05) giving REV of NZ$ -0.08/µm kg clean and NZ$ -0.10/Y-Z kg clean respec-tively. The REV of CFW for Corriedale wool was NZ$ +5.38/kg (Wools of New Zealand: R. Munson, pers. comm.). All direct and correlated responses in this study were expressed in units per individual per year based on calculations assuming selection of 1% of rams and 40% of ewes, with an average generation interval of 3.12 years.
Results
Among the environmental effects fitted in the model, year of birth significantly affected (p < 0.05) all traits stud-ied except MFD. Visual colour score, CWC, CFW and MFD were significantly affected by sex. Birth and rearing ranks did not affect any of the traits (p≥0.05) but age of dam affected GFW (p < 0.05).
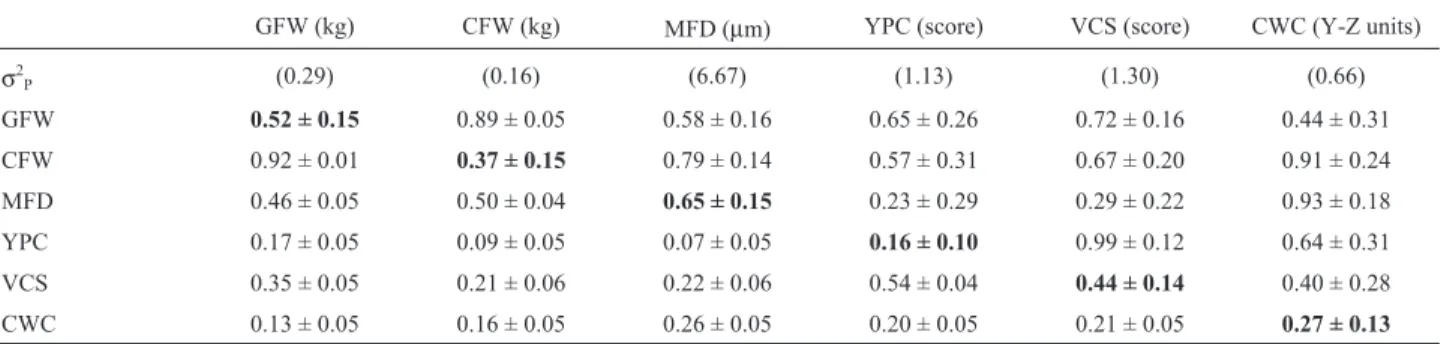
Yellow predictive colour and VCS frequencies are presented in Table I. Heritability estimates, phenotypic and genetic correlations for all traits studied are summarised in Table II. Standard errors were generally high, possibly due in part to the small size of the dataset used.
Table I- Frequency of Yellow predictive colour (YPC) and Visual colour score (VCS) scores for the Corriedale population studied.
Score frequencies (%) 1 2 3 4 5 6 7 8 9 10
YPC 0 0 0 0.5 3.9 23.0 33.9 29.4 7.5 1.8
Phenotypic correlations of CWC and YPC with wool production traits were all of low magnitude (0.07-0.26). The phenotypic correlation estimates between Visual score and wool production traits were also low except for that with GFW (0.35±0.05).
The estimates of heritability of YPC and CWC were 0.16±0.10 and 0.27 ± 0.13, respectively (Table II). The heritability for Visual score, GFW, CFW and MFD were estimated at 0.44 ± 0.14, 0.52 ± 0.15, 0.37 ± 0.15 and 0.65 ± 0.15, respectively.
The genetic correlation estimates for CWC with YPC and VCS were 0.64 ± 0.31 and 0.40 ± 0.28, respectively. Genetic associations of CWC with wool production traits were moderate, except for the strong positive correlations with CFW and MFD of 0.91 ± 0.24 and 0.93 ± 0.18 respec-tively (Table II).
The genetic correlation estimates of YPC with fleece weights (GFW and CFW) were 0.65 ± 0.26 and 0.57 ± 0.31, respectively, while the estimate with MFD was of low mag-nitude and did not differ significantly from zero (Table II). Genetic correlations of VCS with both GFW and CFW
were higher than those observed between YPC and these fleece weight traits.
Results indicated that a genetic improvement of -0.13 Y-Z/head/year (hereafter Y-Z/year) would be expected from direct selection against CWC. The results also showed that responses on CWC through indirect selection against Visual colour score and YPC would be 51% and 49%, re-spectively, that of the expected gains from single trait selec-tion against CWC (Table III). The expected changes in the breeding objective traits for wool (CWC, CFW and MFD) after single selection against each of the traits studied are shown in Table IV. These results show that indirect selec-tion against MFD would cause the greatest improvement in CWC, even higher than that expected for direct selection against CWC.
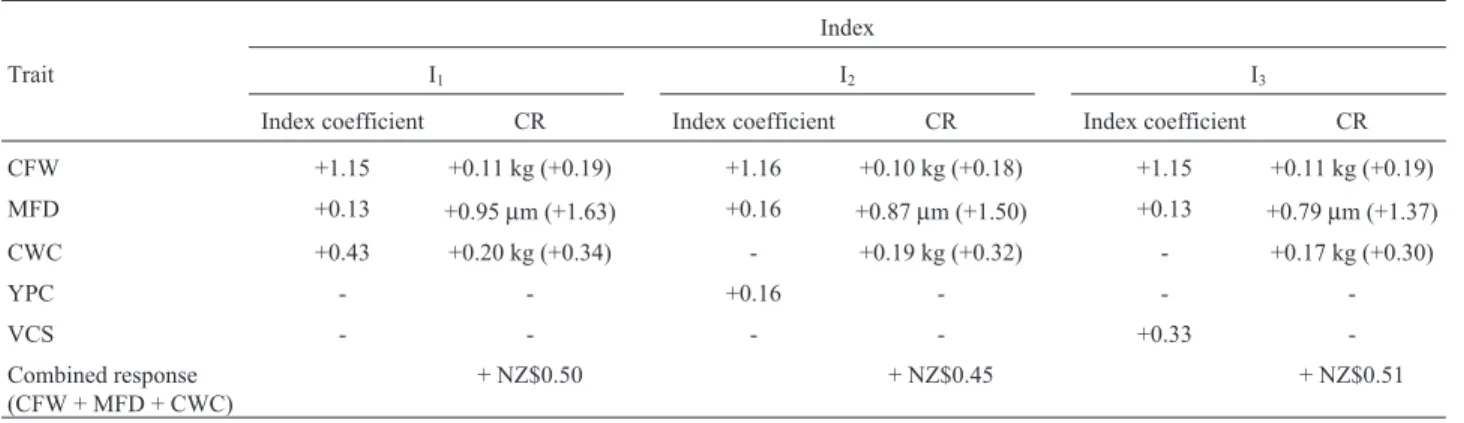
Three indices were derived using the parameters from Table II for a breeding objective to optimise the combined financial gain in CFW, MFD and CWC (Table V). For ex-ample, the selection index having CFW, MFD and CWC as the selection criteria traits, was derived as Index 1 (I1): I1=
+ 1.15CFW + 0.13MFD + 0.43CWC. Expected correlated Table II- Estimates of genetic (above diagonal) and phenotypic (below diagonal) correlations (± standard error) between wool production traits and wool colour traits analysed in Corriedale flock.
GFW (kg) CFW (kg) MFD (µm) YPC (score) VCS (score) CWC (Y-Z units)
σ2P (0.29) (0.16) (6.67) (1.13) (1.30) (0.66)
GFW 0.52 ± 0.15 0.89 ± 0.05 0.58 ± 0.16 0.65 ± 0.26 0.72 ± 0.16 0.44 ± 0.31 CFW 0.92 ± 0.01 0.37 ± 0.15 0.79 ± 0.14 0.57 ± 0.31 0.67 ± 0.20 0.91 ± 0.24 MFD 0.46 ± 0.05 0.50 ± 0.04 0.65 ± 0.15 0.23 ± 0.29 0.29 ± 0.22 0.93 ± 0.18
YPC 0.17 ± 0.05 0.09 ± 0.05 0.07 ± 0.05 0.16 ± 0.10 0.99 ± 0.12 0.64 ± 0.31 VCS 0.35 ± 0.05 0.21 ± 0.06 0.22 ± 0.06 0.54 ± 0.04 0.44 ± 0.14 0.40 ± 0.28
CWC 0.13 ± 0.05 0.16 ± 0.05 0.26 ± 0.05 0.20 ± 0.05 0.21 ± 0.05 0.27 ± 0.13
GFW = greasy fleece weight; CFW = clean fleece weigth; MFD = mean fibre diameter; YPC = yellow predictive colour; VCS = visual colour score; CWC = clean wool colour.
Table III- Per annum expected correlated responses on clean wool colour (CWC) based on indirect single trait selection on colour and wool production traits. Correlated responses in units of standardised selection differential per generation are in square brackets.
Predicted genetic gains on clean wool colour/hd/year Relatives
Trait h2 rG CWC.ind Direct selection2 Correlated responses3 genetic potential (RGP)4
Direct selection against CWC:
Clean wool colour (Y-Z) 0.27 -0.13 (-0.22) 100
Direct selection against:
YPC (score) 0.16 0.64 -0.06 (-0.11) +49
VCS score 0.44 0.40 -0.07 (-0.11) +51
GFW (kg) 0.52 0.44 -0.08 (-0.13) +61
CFW (kg) 0.37 0.91 -0.14 (-0.23) +107
MFD (µm) 0.65 0.93 -0.18 (-0.32) +144
2
Direct response = i * h2X*σP X(Falconer, 1989). Proportion of selected sires and dams have been fixed at 1% and 40%, respectively. 3
CRY= i * hX* hY* rG XY*σP Y(Falconer, 1989). 4RGP = (DR
responses in each of CFW, MFD and CWC to selection, and the combined annual economic response resulting from changes in these traits, for each of these selection indices, are presented in Table V.
Discussion
The effect of climatic conditions on clean wool col-our, here expressed as year of birth, is well documented (Serra and de Matos, 1951; Fraser and Mulcock, 1956; Hoare, 1978). In this study, this trait ranged from -1.37 Y-Z to 2.98 Y-Z for the 1992 progeny measured in 1993 and from -0.24 Y-Z to 6.66 Y-Z for the 1993 progeny measured in 1994, indicating that the latter progeny underwent a greater environmental challenge for the development of wool yellowing. According to Wilkinson’s (1981) classifi-cation, all individuals with YPC scores≥4 should be con-sidered susceptible to wool yellowing, having the potential to develop detectable levels of non-scourable discolour-ation. Similarly, animals with YPC scores≥6 should be considered highly susceptible to wool yellowing. Ninety-six percent of the experimental animals in the current study came into this latter category (Table 1). Despite an appar-ently high level of susceptibility in this flock based on YPC values, the mean clean wool colour, 0.83 ± 0.81, would be considered white (Wools of New Zealand, 1995). This indi-cates that the sheep studied were subjected to a low level of natural environmental challenge for wool yellowing.
Information about environmental factors that influ-ence YPC are restricted to observations in Merinos made by Raadsma and Wilkinson (1990) who found that YPC was significantly affected by year. Yellow predictive col-our has been found to be strongly phenotypically correlated with suint percentage (Aitkenet al., 1994) which can be washed out by rain (Daly and Carter, 1956; Thornberryet al., 1980; Raadsma and Thornberry, 1988). Gender did not affect YPC.
It was also observed that there was no significant (p≥0.05) year effect for MFD. Nutritional effects are well known to affect wool fibre diameter (Stewartet al., 1961; Sumner and Wickham, 1969). The fact that year did not af-fect MFD would indicate that the nutritional levels between years were similar. Unfortunately, there was no measure-ment of pasture availability during this trial that could sup-port this assertion.
Summarising, it was found that year and sex effects were the main causes for variation in the traits studied. Birth and rearing ranks did not significantly affect any of the traits studied and dam age only differed for GFW. The effect of year was significant for all traits. The levels of clean wool colour over the observed years indicated that fleeces from 1993 were less environmentally challenged than in 1994.
The poor phenotypic correlation between VCS and CWC (0.21 ± 0.05; Table II) has been discussed in
vides and Maher (2000). Yellow predictive colour and VCS also had low phenotypically correlated with CWC, indicat-ing that neither VCS nor YPC were accurate predictors of the level of non-scourable discolouration present in fleeces.
The quantification of phenotypic and genetic correla-tions between YPC and CWC were important objectives of this experiment. Previously, phenotypic studies have only considered small groups of sheep representing extremes of the YPC range, i.e. resistant vs. susceptible (Wilkinson, 1982; Wilkinson and Aitken, 1985; Aitken et al., 1994). These authors suggested the use of YPC as an indirect se-lection trait to reduce non-scourable discolouration, despite providing no evidence of a genetic or phenotypic associa-tion between these traits. Although these studies showed that extremely “resistant” and “susceptible” groups of sheep produced CWC averages of 1.2 Y-Z and 4.1 Y-Z, respectively (Wilkinson, 1982), the genetic association be-tween YPC and CWC has not previously been demon-strated.
Genetic estimates in this current study were calcu-lated based on a small number of elite sires which may have inflated the genetic variances and co-variances, and these results need to be considered cautiously. The high genetic correlation observed between YPC and CWC (0.64 ± 0.31) in the current study is of importance because it indicates that YPC could be a useful indirect selection criterion for CWC. However, the use of YPC as a selection criterion would only improve CWC by 49% of that obtainable through direct selection on CWC. This occurred because YPC had a low heritability estimate (0.16 ± 0.10; Table II). Consequently, direct selection against CWC, with a heri-tability of 0.27 ± 0.13, would lead to a greater improvement in CWC than selection based on YPC. The heritability for YPC has been estimated at 0.27 ± 0.06 in a larger Corrie-dale dataset (Benavideset al., 1998). The larger data size is reflected in the lower standard error for this estimate com-pared with that obtained in this study but the heritability es-timate was unaffected.
The use of YPC as an indirect selection criterion for CWC, although resulting in half of the expected genetic gain in CWC (-0.06 Y-Z/year vs. -0.13 Y-Z/year; Table IV), would also halve the estimated reductions in CFW that would occur under selection against CWC colour (-0.03 kg/year vs. -0.07kg/year; Table 4). In economic terms, selection against YPC would result in a loss of NZ$0.14/year from wool income, being less disadvanta-geous than the economic losses expected from selection against CWC. However, the expected change in CFW rela-tive to CWC would be similar over any given period for ei-ther trait selected. Regardless of wheei-ther YPC or CWC is selected against, correlated reductions in CFW appear to be inevitable. Clean fleece weight had the highest relative eco-nomic value of the traits considered for Corriedale flocks. Consequently, selection that reduces CWC will reduce the economic gains that would otherwise be possible from in-creased CFW.
Visual colour score was found to be highly geneti-cally correlated with YPC (0.99 ± 0.12), therefore, selec-tion against subjective greasy colour assessment (VCS) would reduce susceptibility to wool yellowing. However, the genetic correlation between VCS and CWC (0.40 ± 0.28) was found to be lower than that between YPC and CWC (0.64 ± 0.51). Visual colour score and YPC may be considered as subjective assessments of the amount of yolk pigments contained in the suint fraction at different stages of environmental challenge. Yellow predictive col-our could be argued to be the upper limit of VCS, since YPC is the assessment of the amount of yolk pigments in the greasy wool after incubation. Considering these defini-tions, CWC appeared to be more genetically correlated to the amount of pigment in suint after incubation. In spite of the lower correlation with CWC, VCS was a slightly better indirect selection criterion against CWC than YPC because it had a higher heritability than YPC.
The positive genetic correlations observed for any of CWC, YPC or VCS with CFW (0.91 ± 0.24, 0.57 ± 0.31 and 0.67 ± 0.20, respectively) would lead to economic Table V- Selection index coefficients (I1to I3) and expected annual per head correlated responses in CFW, MFD and clean wool colour (CWC). Correlated responses in units of standardised selection differential per generation are in square brackets.
Index
Trait I1 I2 I3
Index coefficient CR Index coefficient CR Index coefficient CR
CFW +1.15 +0.11 kg (+0.19) +1.16 +0.10 kg (+0.18) +1.15 +0.11 kg (+0.19)
MFD +0.13 +0.95µm (+1.63) +0.16 +0.87µm (+1.50) +0.13 +0.79µm (+1.37)
CWC +0.43 +0.20 kg (+0.34) - +0.19 kg (+0.32) - +0.17 kg (+0.30)
YPC - - +0.16 - -
-VCS - - - - +0.33
-Combined response (CFW + MFD + CWC)
+ NZ$0.50 + NZ$0.45 + NZ$0.51
losses to production under selection to reduce colour in wool since CFW, which is by far the most economically important Corriedale wool trait, would decline. Similar re-sults were found in Romneys (Hawkeret al., 1988), where a high genetic correlation between GFW and CWC was real-ised (0.65±n.a.). Bighamet al.(1983) also estimated that selection against CWC would lead to correlated responses of -0.07 kg GFW and -0.04 kg CFW per generation in Rom-neys if a proportion of 5% of the population was selected. Surprisingly, Barlow (1974) and Wulijiet al. (1993) re-ported no significant differences in CWC in progeny of high fleece weight selected Peppin Merino and Romney ewes, respectively, and random control flocks. On the other hand, a negative genetic correlation between CFW and CWC found in Collinsville Merinos (Jameset al., 1990) in-dicated that CWC would improve under selection for higher CFW.
The positive genetic correlation estimates between YPC and fleece weights found here also disagree with the findings of Wilkinson and Aitken (1985) who reported neg-ative genetic correlations for YPC with GFW and CFW of -0.41 ± 0.35 and -0.71 ± 0.35, respectively. These findings suggested that economic gains would result from selection against YPC. Higher genetic correlations between YPC and wool production traits, were observed in the current study than by Raadsma and Wilkinson (1990) and Benavideset al. (1998) except for MFD, for which they reported esti-mates of 0.26 and 0.24 ± 0.14, respectively.
To avoid the antagonistic economic response be-tween CWC and CFW, an indirect selection trait which has moderate to strong genetic correlations with CWC and CFW of opposing signs would be ideal. Unfortunately, nei-ther YPC nor VCS was found to fulfil these criteria. These results indicate that the genetic origins of yellow discolour-ation cannot easily be separated from those that determine fleece weight by conventional quantitative genetics.
The use of selection indices to optimise response in a breeding objective containing CFW, MFD and CWC, by using either CWC, YPC or VCS as selection criteria in ad-dition to CFW and MFD showed positive genetic gains for all traits in the objective. Despite the predicted positive overall economic responses from index selection, the major drawback to using these selection indices would be the ge-netic increase in CWC.
Both Yellow predictive colour and Visual colour score were found to have the potential for indirect selection against CWC. However, both of these traits would give lower correlated responses in CWC higher than that ob-tained under direct selection. Additionally, YPC and VCS were both positively genetically correlated with CFW, and therefore under single trait selection would also result in net economic losses.
In summary, wool colour traits were predicted to give up to only 51% of the genetic gain in CWC expected under direct selection. MFD had a greater genetic potential to
re-duce CWC than any other single indirect trait selection. Se-lection on MFD may be a cost effective means of reducing CWC, since MFD is usually measured for selection pur-poses for its own importance and no additional cost in wool measurement would be necessary. Despite the steady ge-netic progress that could be obtained through direct and in-direct selection against CWC, such selection would not be economically viable at current wool prices and premiums because of the correlated reductions in CFW that would oc-cur.
Conclusions
Yellow predictive colour and visual colour score can be used as indirect selection criteria to improve clean wool colour. The best indirect selection criteria against CWC was found to be MFD. The fastest genetic progress for CWC would be expected under direct selection. Direct and indirect single trait selection against CWC would be ex-pected to reduce both CFW and MFD. The addition of CWC to an economically weighted index with CFW and MFD would, at current premiums, still lead to deterioration in CWC.
Acknowledgments
We acknowledge the financial support of CNPq (Conselho Nacional de Desenvolvimento Científico e Tec-nológico). We also would like to thank José Carlos Fer-rugem Moraes and Fraser Aitken, Jenny Nicol, Jill Sutton, Ross Wilson and Chris Logan from Lincoln University.
References
Aitken FJ, Cottle DJ, Reid TC and Wilkinson BR (1994) Mineral and amino acid composition of wool from New Zealand Me-rino sheep differing in susceptibility to yellowing. Austra-lian Journal of Agricultural Research 45(2):391-401. AS/NZS (1999a) Wool-Fleece testing and measurement. Method
1: Weighing and sampling wool for fleece testing and mea-surement. Preliminary draft, TX/012-0970, May 1999, Stan-dards Australia/StanStan-dards New Zealand, StanStan-dards New Zealand, Wellington, NZ, pp 6.
AS/NZS (1999b) Wool-Fleece testing and measurement. Method 2: Determination of washing yield and clean fleece weight. Preliminary draft, TX/012-0980, May 1999, Standards Aus-tralia/Standards New Zealand, Standards New Zealand, Wellington, NZ, pp 15.
AS/NZS (1999c) Wool-Fleece testing and measurement. Method 5: Measurement of mean fibre diameter using the OFDA measuring method. TX-12-1010, May 1999, Standards As-sociation/Standards New Zealand, Standards New Zealand, Wellington, NZ, pp 7.
Barlow T (1974) Selection for clean fleece weight in Merino sheep. II. Correlated responses to selection. Australian Jour-nal of Agricultural Research 25(4):973-994.
wool production traits: genetic parameter estimates. Austra-lian Journal of Agricultural Research 49(8):1195-1200. Benavides MV and Maher AP (2000) Quantitative genetic studies
on wool yellowing in Corriedale sheep. II - Clean wool col-our and wool production traits: genetic parameter estimates and economic returns. Australian Journal of Agricultural Research 51(2):191-196.
Bigham ML, Meyer HH and Smeaton JE (1983) The heritability of loose wool bulk and colour traits and their genetic and phenotypic correlations with other wool traits. Proceedings of the New Zealand Society of Animal Production 43:83-85. Cottle DJ (1996) Selection programs for fleece rot resistance in
Merino sheep. Australian Journal of Agricultural Research 47:1213-1233.
Cunningham EP and Mahon GAT (1977) Selind - A FORTRAN computer program for genetics selection indexes. User’s Guide. Publisher: An Foras Taluntis. Dublin University, Ire-land.
Daly RA and Carter HB (1956) Fleece growth of young Lincoln, Corriedale, Polwarth, and Fine Merino maiden ewes grazed on an unimprovedPaspalumpasture. Australian Journal of Agricultural Research 7:76-83.
Fraser IEB and Mulcock AP (1956) Staining of wool by bacterial pigments. Nature 177:628-629.
Hawker H, Dodds KG, Andrews RN and McEwan JC (1988) Pro-duction and characteristics of wool from the hogget progeny of sheep intensively screened for fleece weight. Proceedings of the New Zealand Society of Animal Production 48:207-214.
Hoare JL (1978) Origin and nature of canary stain. Wool Research Organisation Report 46:23pp.
International Wool Textile Organisation (1995) Measurement of the mean and distribution of fibre diameter of wool using and Optical Fibre Diameter Analyser (OFDA). International Wool Textile Organisation test method IWTO-47-95. Inter-national Wool Secretariat, Ilkley, UK.
James PJ, Ponzoni RW, Walkley JRW and Whiteley KJ (1990) Genetic parameters for wool production and quality traits in South Australian Merinos of the Collinsville family group. Australian Journal of Agricultural Research 41:583-594. Johnson DL and Thompson R (1995) Restricted maximum
likeli-hood estimation of variance components for univariate
ani-mal models using sparse matrix techniques and average information. Journal of Dairy Science 78:449-456. New Zealand Standards (1984) Method for the measurement of
the colour of wool. Standards Association of New Zealand test method NZS 8707:1984. Standards Association of New Zealand, Wellington NZ.
Raadsma HW and Thornberry KJ (1988) Relationship between wax, suint and fleece rot: Effect of sample preparation, time of sampling and fleece rot induction. Australian Journal of Experimental Agriculture and Animal Husbandry 28:29-36. Raadsma HW and Wilkinson BR (1990) Fleece rot and body
strike in Merino sheep. IV. Experimental evaluation of traits related to greasy wool colour for indirect selection against fleece rot. Australian Journal of Agricultural Research 41:139-153.
SAS/STAT (1990). “User’s Guide Version 6”. 4th Edn. SAS In-stitute Inc.: Cary, NC.
Serra JA and De Matos RMA (1951) Nature of the canary color-ation of wool. Journal of Textile Institute 42:T329-331. Stewart AM, Moir RJ and Schinckel PG (1961) Seasonal
fluctua-tions in wool growth in south Western Australia. Australian Journal of Experimental Agriculture and Animal Husbandry 1:85-91.
Sumner RMW and Wickham GA (1969) Some effects of an in-creasing stocking level on wool growth. Proceedings of the New Zealand Society of Animal Production 29:208-217. Thornberry KJ, Kowal EAB and Atkins KD (1980) Skin, wax and
suint characters as possible indirect selection criteria. Ani-mal Production in Australia 13:95-99.
Wilkinson BR and Aitken FJ (1985) Resistance and susceptibility to fleece yellowing and relationships with scoured colour. Proceedings of the New Zealand Society of Animal Produc-tion 45:209-211.
Wilkinson BR (1981) Studies on fleece yellowing. Part 1: Predic-tion of susceptibility to yellow discolouraPredic-tion in greasy fleeces. Wool Technology and Sheep Breeding 29:169-74. Wilkinson BR (1982) Yellowing in wool. Wool 7:9-12.
Wools of New Zealand (1995) Statistical Handbook 1994-95 sea-son. Wools of New Zealand. Wellington, NZ.