Genetic parameters of wool colour and skin traits in Corriedale sheep
M.V. Benavides and P. Maher
EMBRAPA - Pecuária Sul, Bagé, RS, Brazil.
Abstract
Clean wool colour (CWC) is an important wool price determinant and has been related to suint characteristics,i.e.
sudoriparous and sebaceous gland secretions, such as suint percentage and suint K content. In this work heritability, phenotypic and genetic correlations among wool colour and skin traits were examined. The genetic estimates were assessed by Restricted Maximum Likelihood (REML) procedures using average information algorithm (AIREML) in a Corriedale flock. The traits analysed were wool colour traits (CWC), yellow predictive colour (YPC), and Visual Score; suint traits such as suint percentage and potassium and sodium concentrations in suint, and physiological traits such as potassium and sodium concentrations in the skin, including plasma and red blood cells. The objectives of this study were to assess phenotypic and genetic correlations between wool colour and skin traits, and to find the suitability of these traits as indirect selection criteria for clean wool colour. Suint traits were highly genetically correlated to YPC. Suint K, but not suint percentage, was found to have a high genetic correlation with CWC. Skin K, Visual Score, YPC and suint K were amongst the best indirect selection criteria for clean wool colour. However, selection using these traits was expected to reduce CWC from 52% to 49% of that estimated under direct selection.
Key words:wool yellowing, indirect selection criteria, sheep.
Received: January 6, 2003; Accepted: May 12, 2003.
Introduction
Woollen sheep normally produce white fibres, how-ever some animals tend to produce non-scourable yellow fleeces which are of limited use in the wool industry due to the narrow range of colours that such wool may be dyed. As a result, yellow fleeces are penalised for their colour and commercialised at low prices.
The real causes of non-scourable yellowing in fleeces have not yet been precisely determined. Suint1 pigments (Sidey, 1931; Sutton, 1933), suint percentage and K content (Aitkenet al., 1994), and bacterial growth (Wilson, 1946; Cottleet al., 1992) have been related to the yellowing mech-anism. There are also management strategies to reduce the incidence of non-scourable yellowing. Studies have shown that the percentage of yellow fleeces in winter shearing is less than that from traditional late spring or summer shear-ing, resulting in economic advantage for the sheep farmers (Sumner, 1983). However, regardless of management prac-tices, there will always exist sheep prone to develop non-scourable yellowing since individuals differ in their ge-netic susceptibility to this wool fault (Wilkinson, 1981).
Clean wool colour is a trait that is easily measured at any time and could be a suitable trait to base selection
against wool yellowing on. However, as the incidence of non-scourable yellowing is greatly influenced by the envi-ronment (Wilkinson, 1981), an approach to solve this prob-lem would be the use of indirect selection criteria. Direct selection is more effective than indirect selection in most cases, however, indirect selection can lead to faster genetic progress when the selection criterion has a higher heritability, is highly genetically correlated to the trait to be improved and has a wide range of expression (McGuirk and Atkins, 1980).
Indirect selection is particularly important for traits that (1) are difficult to measure accurately; (2) are ex-pressed in only one sex; (3) are costly to measure (Falconer, 1989) or, (4) have low incidence or are not always ex-pressed in all the environments (McGuirk and Atkins, 1980). Wool yellowing falls into item (4) because it is a trait not always expressed, therefore it could benefit largely from an indirect selection trait. However, suitable criteria need to be investigated.
The objectives of this work were to assess phenotypic and genetic correlation estimates between wool colour and skin traits and to determine the potential of these traits as in-direct selection criteria for clean wool colour.
Material and Methods
A total of 440 contemporary progeny from 19 sires of a Corriedale sire progeny test flock (Sheep Breeding Unit,
www.sbg.org.br
Send correspondence to Magda Vieira Benavides. Embrapa Pe-cuária Sul, Caixa Postal 242, 96401-970, Bagé, RS, Brazil. E-mail: [email protected].
Research Article
Lincoln University, Canterbury) and 253 dams were tested, with an average of 22 offspring per sire. Flock management has been described in Benavides and Maher (2002).
Clean wool colour: Analysed after wool tips and any vegetable matter had been removed from the scoured wool sample to avoid errors due to contamination and weather-ing effects. Samples were cut into 20 mm lengths, air-blended, and conditioned for 12h at 20 ± 2 °C and 65 ± 2% relative humidity. Clean wool colour was mea-sured, recording the X, Y, and Z tristimulus values in a Hunterlab D25 colorimeter (New Zealand Standards 1984) using the illuminant 2/10°. Clean wool colour was mea-sured by the difference between Y and Z (Y-Z), its value can range from -3 (white) and +16 (yellow). Greasy wool colour (Visual colour score) was subjectively assessed and scored from 1 to 10, score 1 being white wool and 10 being intensely yellow discoloured wool.
Yellow predictive colour (YPC)
Wool yellowing susceptibility was determined by us-ing the YPC technique described by Raadsma and Wilkinson (1990) where 2 g of greasy wool staples (wool tips removed) are incubated under specific temperature and relative humidity conditions.
Suint content
Approximately 2 g of full length greasy wool was used to determine this trait. Suint was extracted twice by submerging the wool sample in 100 mL of distilled water in a 200 mL beaker for a one hour agitation at 100 cycles/min at room temperature. The suint extract was filtered into a 600 mL beaker, of known weight, and dried at 105 °C until the water had completely evaporated. Suint weight was cal-culated as final beaker weight minus initial [clean] beaker weight. Following suint extraction, the de-suinted greasy wool samples were scoured by the procedures described in the Australian/New Zealand Draft Standard for Flock Testing (Standard Association of New Zealand, 1995), dried at 105 °C, conditioned for 12 h at 20 ± 2 °C and 65 ± 2% relative humidity and then weighed to calculate scoured wool yield. Suint weight was expressed as percentage rela-tive to 100 g of clean wool.
Suint K and Na
Approximately 2 g of greasy wool, with staple tips re-moved to minimise external mineral contamination, was cut into 20 mm lengths and weighed. Wool samples were mixed with 100 mL of distilled water for 1 h at 100 cy-cles/min, at room temperature. The extract was filtered and an aliquot of 10 mL was stored for mineral analyses. Potas-sium and sodium contents were measured by atomic ab-sorption spectrophotometry (Aitken et al., 1994). The de-suinted greasy wool samples were scoured, after suint extraction, and results were expressed as milligrams of suint K and suint Na per gram of clean wool.
Blood K and Na
Blood samples (10 mL) were taken by jugular venipuncture in lithium heparin Vacutainer tubes. Plasma and red blood cells were analysed separately. Red blood cells were processed by the method by Siebers and Maling (1988) in which plasma is separated from red blood cells, white cells and platelets by centrifuging at 12,000 rpm for 15 min. Red blood cells were then extracted after being washed and centrifuged three times with 115 mM MgCl2at
12,000 rpm for 10 min each. Plasma and red blood cell sam-ples were stored at -20 °C until they were analysed for K and Na concentrations by atomic absorption spectrophoto-metry. Results were expressed as mmol.L-1.
Skin K and Na
Sheep skin biopsies of 1 cm diameter were taken from the mid-side region using a trephine (Maddocks and Jack-son, 1988), and analysed using the method by Thompson and Blanchflower (1971). Skin samples were acid digested in a glass vial containing 4:1 proportions of 5 mL of nitric and perchloric acids. The samples were placed in a heating block at 400 °C until the acids had completely evaporated. Remaining ash was then diluted in 10 mL of 5% hydrochlo-ric acid and the samples were analysed for potassium and sodium concentrations by atomic absorption spectropho-tometry. Results were expressed as mg of K [or Na] per gram of dry skin.
Statistical analysis
Heritabilities, genetic and phenotypic parameters were estimated using an animal model calculated by the Average Information Restricted Maximum Likelihood (AIREML) programme (Johnson and Thompson 1995). General Linear Model (GLM) procedure of SAS V6 (SAS/STAT 1990) was used to determine the significant fixed effects to include in the analyses. Year of birth, sex, age of dam, birth and rearing ranks were fitted as fixed ef-fects. Date of birth was fitted as a covariate and sire within year was included as a random effect.
The model fitted to each variable was:
Yijklmno=µ+ yi+ xj+ ak+ brl+ rrm+ dobijklmno+ sn(yi) + eijklmno
where Yijklmnowas the record of theoth individual;µwas the population mean; yiwas the year of birth; xjwas the sex; ak was the age of dam; brlwas the birth rank, rrmwas the rear-ing rank; dobijklmnowas the date of birth; sn(yi) was the sire within year of birth, and eijklmnowas the residual error.
Results
Ta-bles 2-5. The annual expected correlated responses on clean wool colour (CWC) based on indirect selection on colour and physiological traits are presented in Table 6.
Heritabilities
Heritability estimates were moderate (>0.30 and ≤0.60) for Visual Score, suint percentage, and K concentra-tions in red blood cells and skin. All other traits were esti-mated to be of low heritability (≤0.30). Standard errors were generally high because of the small size of the dataset used.
Phenotypic correlations
Clean wool colour had weak phenotypic correlations (<0.22) with wool colour traits (YPC and visual colour) (Table 2). The association between all suint traits (suint percentage, suint K and suint Na) and clean wool colour varied from negligible to low (Table 2), however suint per-centage and suint K concentration were moderately corre-lated with YPC and Visual Score (Table 2). Phenotypic correlations of suint Na with all wool colour traits were low. Suint percentage was highly (0.65 ± 0.03) and
moder-ately (0.39 ± 0.05) correlated with suint K and Na concen-trations, respectively (Table 2). Correlations between suint traits and the K and Na concentration in other fluids and tis-sues were also low (Table 5).
Potassium and sodium in plasma (Table 3), in red blood cells (Table 3), and in skin (Table 4) all had low corre-lations with wool colour traits. Plasma, red blood cells, and skin minerals had low phenotypic correlations with suint traits (Table 5). All phenotypic correlations among physio-logical traits were either negligible or low, except for those correlations between K and Na within each tissue/fluid.
In summary, all wool colour and physiological traits studied showed low, positive phenotypic correlations with clean wool colour. There were exceptions however, suint percentage and suint K were the only traits found to have moderate phenotypic correlations with YPC and Visual Score.
Genetic correlations
Estimates of genetic correlations have to be inter-preted with caution since standard errors were high because
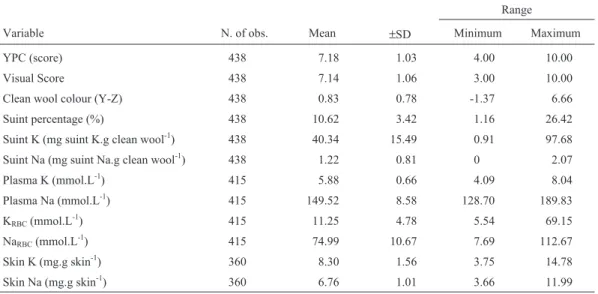
Table 1- Overall means (±standard deviation) and range of the traits studied in Corriedale hogget fleece.
Range
Variable N. of obs. Mean ±SD Minimum Maximum
YPC (score) 438 7.18 1.03 4.00 10.00
Visual Score 438 7.14 1.06 3.00 10.00
Clean wool colour (Y-Z) 438 0.83 0.78 -1.37 6.66 Suint percentage (%) 438 10.62 3.42 1.16 26.42
Suint K (mg suint K.g clean wool-1) 438 40.34 15.49 0.91 97.68 Suint Na (mg suint Na.g clean wool-1) 438 1.22 0.81 0 2.07
Plasma K (mmol.L-1) 415 5.88 0.66 4.09 8.04
Plasma Na (mmol.L-1) 415 149.52 8.58 128.70 189.83
KRBC(mmol.L-1) 415 11.25 4.78 5.54 69.15
NaRBC(mmol.L-1) 415 74.99 10.67 7.69 112.67
Skin K (mg.g skin-1) 360 8.30 1.56 3.75 14.78
Skin Na (mg.g skin-1) 360 6.76 1.01 3.66 11.99
Table 2- Estimates for genetic (above diagonal) and phenotypic (below diagonal) correlations (±standard error) between YPC, Visual score, clean wool
colour, suint percentage and minerals analysed in Corriedale flock. Hereability estimates are shown in bold.
YPC (score)
Visual score Clean wool colour (Y-Z units)
Suint percentage (%)
Suint K (mg suint K.g clean wool-1)
Suint Na (mg suint Na.g clean wool-1)
σ2P (1.13) (1.30) (0.66) (13.42) (255.36) (0.68)
YPC 0.16 ± 0.10 0.99 ± 0.12 0.64 ± 0.31 0.79 ± 0.22 0.83 ± 0.24 0.60 ± 0.33
Visual score 0.54 ± 0.04 0.44 ± 0.14 0.40 ± 0.28 0.96 ± 0.09 1.00 ± 0.10 0.69 ± 0.21
Clean wool colour 0.20 ± 0.05 0.21 ± 0.05 0.27 ± 0.13 0.34 ± 0.31 0.62 ± 0.34 0.20 ± 0.34
Suint percentage 0.35 ± 0.04 0.49 ± 0.04 0.06 ± 0.05 0.46 ± 0.14 1.00 ± 0.07 0.61 ± 0.20
Suint K 0.51 ± 0.04 0.56 ± 0.04 0.12 ± 0.05 0.65 ± 0.03 0.16 ± 0.10 0.66 ± 0.24
of the small dataset used. Estimates with standard errors higher than the estimated values were considered non-significantly different from zero. Genetic correlations that fit into this category have been presented in tables but they will not be discussed further.
Clean wool colour and YPC had a high, positive ge-netic correlation (0.64 ± 0.31). Visual Score and YPC were strongly correlated (0.99 ± 0.12), but the genetic correlation between Visual Score and clean wool colour was lower (0.40 ± 0.28) than that observed between YPC and Visual Score (Table 2).
While genetic correlations for clean wool colour with suint percentage and suint Na concentrations were non-significantly different from zero, suint K was highly associ-ated with clean wool colour (0.62 ± 0.34; Table 2).
Plasma Na and NaRBCshowed negative and moderate
correlations with clean wool colour (-0.31 ± 0.15 and -0.41 ± 0.23, respectively; Table 3). Skin K had a moderate and positive correlation with clean wool colour (0.45 ± 0.32; Table 4).
Suint traits were highly genetically correlated with YPC (Table 2), confirming the strong phenotypic associa-tions observed by Aitkenet al.(1994). Plasma K was also highly genetically correlated with YPC (0.83 ± 0.24) and moderately with plasma Na (0.60 ± 0.33) (Table 3). How-ever, the estimates between YPC and KRBCor skin K were
non-significantly different from zero and those between YPC and NaRBCor skin Na were low negative (Table 4).
Generally the higher standard errors observed in the genetic correlations involving skin traits were probably due to the lower number of observations for these traits.
Suint traits were highly correlated to Visual Score (Table 2), these estimates were stronger than those ob-served between YPC and clean wool colour.
A high genetic correlation between Visual Score and plasma K was observed (0.78 ± 0.43; Table 3), while corre-lations of Visual Score with plasma Na, KRBC, NaRBC, and
skin Na were not significantly different from zero (Tables 3 and 4). Skin K was moderately correlated to Visual Score (0.46 ± 0.23; Table 4).
All other genetic correlations of physiological traits with fleece weights, except plasma K, were not signifi-cantly different from zero.
Among physiological traits (Table 5), suint percent-age had genetic correlations that were not significantly dif-ferent from zero with plasma, red blood cells, and skin minerals, while suint K and Na concentrations were highly genetically associated with plasma K (0.77 ± 0.61 and 0.76 ± 0.48, respectively). Plasma Na had a high positive correlation with suint Na (0.68 ± 0.43) only. Red blood cells and skin minerals did not show significant genetic cor-relations with suint minerals.
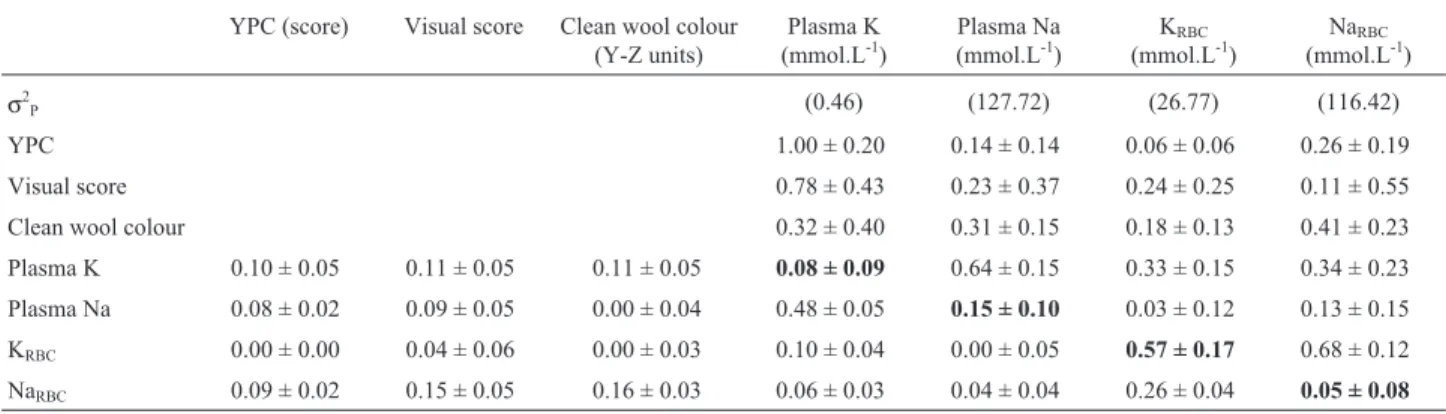
Table 3- Estimates for genetic (above diagonal) and phenotypic (below diagonal) correlations (±standard error) between YPC, Visual score and clean
wool colour and blood minerals analysed in Corriedale flock. Hereability estimates are shown in bold.
YPC (score) Visual score Clean wool colour (Y-Z units)
Plasma K (mmol.L-1)
Plasma Na (mmol.L-1)
KRBC
(mmol.L-1)
NaRBC
(mmol.L-1)
σ2P (0.46) (127.72) (26.77) (116.42)
YPC 1.00 ± 0.20 0.14 ± 0.14 0.06 ± 0.06 0.26 ± 0.19
Visual score 0.78 ± 0.43 0.23 ± 0.37 0.24 ± 0.25 0.11 ± 0.55 Clean wool colour 0.32 ± 0.40 0.31 ± 0.15 0.18 ± 0.13 0.41 ± 0.23 Plasma K 0.10 ± 0.05 0.11 ± 0.05 0.11 ± 0.05 0.08 ± 0.09 0.64 ± 0.15 0.33 ± 0.15 0.34 ± 0.23
Plasma Na 0.08 ± 0.02 0.09 ± 0.05 0.00 ± 0.04 0.48 ± 0.05 0.15 ± 0.10 0.03 ± 0.12 0.13 ± 0.15
KRBC 0.00 ± 0.00 0.04 ± 0.06 0.00 ± 0.03 0.10 ± 0.04 0.00 ± 0.05 0.57 ± 0.17 0.68 ± 0.12
NaRBC 0.09 ± 0.02 0.15 ± 0.05 0.16 ± 0.03 0.06 ± 0.03 0.04 ± 0.04 0.26 ± 0.04 0.05 ± 0.08
Table 4- Estimates for genetic (above diagonal) and phenotypic (below diagonal) correlations (±standard error) between YPC and clean wool colour and
whole skin minerals analysed in Corriedale flock. Hereability estimates are shown in bold.
YPC (score)
Visual score Clean wool colour (Y-Z units)
Skin K (mg.g skin-1)
Skin Na (mg.g skin-1)
σ2P (2.67) (1.08)
YPC 0.11 ± 0.37 0.45 ± 0.40
Visual score 0.46 ± 0.23 0.05 ± 0.39
Clean wool colour 0.45 ± 0.32 0.01 ± 0.40
Skin K 0.17 ± 0.05 0.23 ± 0.06 0.11 ± 0.06 0.36 ± 0.15 0.77 ± 0.34
Correlated responses
The data indicated that genetic gains of -0.13 Y-Z unit/year would be expected from direct selection against clean wool colour. The results showed that the best indirect selection criteria for clean wool colour were skin K, Visual Score, YPC and suint K, with relative genetic potential varying from 52% to 49% (Table 6), relative genetic poten-tial being the ratio between the predicted genetic gains un-der direct selection and the predicted gains unun-der indirect selection.
Discussion
The genetic gain for direct selection against CWC found here (-0.13 Y-Z units/year) is higher than the esti-mate observed in Bighamet al.(1983) that predicted a re-sponse of -0.11 Y-Z unit/generation in Romneys. These differences were largely attributable to the heritability esti-mates for clean wool colour: 0.27 ± 0.13 (this experiment) and 0.13 ± 0.06 (Bighamet al., 1983). A low environmental variance in clean wool colour (not tabulated) suggested that the wool had not been challenged enough to show its high-est potential. An interhigh-esting point is that studies where the heritability of clean wool colour has been estimated to be low or negligible, such as those reported in Romneys (h2= 0.13 ± 0.06; Bighamet al., 1983 and h2= 0.04 ± 0.07; Hawkeret al., 1988) have been derived from flocks with high clean wool colour averages (2.3 to 3.5 (±0.8) and 3.69 ± n.a., respectively), in other words, from flocks that have been challenged by the environment.
In contrast, a moderate heritability estimate (h2= 0.42 ± 0.14) for clean wool colour has been reported in a Collins-ville South Australian Merino flock with clean wool colour average of 1.50 ± 0.79 (Jameset al.,1990). The Corriedale flock studied here also presented a low clean wool colour average (0.83 ± 0.81), despite the fact that these sheep had been classified as being susceptible to wool yellowing, based on their YPC frequencies. The fact that the highest heritability estimates in the above studies were observed in relatively unchallenged flocks suggests that the true envi-ronmental variance for clean wool colour was probably un-derestimated due to a lack of suitable conditions for non-scourable yellowing development. Thus a lower heri-tability estimate for clean wool colour would have been ob-tained if a more challenging environment had occurred during the experimental period.
The low phenotypic correlation observed between Visual Score and clean wool colour (0.21 ± 0.05; Table 2) corroborates the results found by Clark and Whiteley (1977), Pattinson and Whiteley (1984), and Thompson (1987), who reported a poor association between greasy wool colour and clean wool colour in Merino wools.
The results showed that selection against clean wool colour would improve the trait in -0.13 Y-Z units/year. The objective of finding a suitable indirect selection criteria for
clean wool colour amongst skin traits proved that skin K, Visual Score, YPC, and suint K had relative genetic poten-tials of 49 to 52% and faster genetic progress for clean wool colour would be expected under direct selection.
Despite the high genetic correlation (0.64 ± 0.31) be-tween YPC and clean wool colour, the use of YPC as a se-lection criterion would only improve clean wool colour by 49% of that obtainable through direct selection. This occurs because YPC has a low heritability estimate (0.16 ± 0.10; Table 2). Consequently, direct selection against clean wool colour, with a heritability of 0.27 ± 0.10, would lead to a greater improvement in clean wool colour.
The genetic correlation between Visual Score and clean wool colour was even lower (0.40 ± 0.28) than that between YPC and clean wool colour. In spite of a lower correlation with clean wool colour than YPC, Visual Score was a better indirect criterion because it had a higher heritability estimate than YPC. Visual Score and YPC are subjective assessments of the amount of yolk pigments contained in the suint fraction, nonetheless, YPC can be considered to be the upper limit of Visual Score since YPC is the assessment of the amount of yolk pigments in the greasy wool after incubation. Considering these defini-tions, clean wool colour then appeared to be more geneti-cally correlated to the amount of pigments after incubation.
Suint percentage has been reported to be one of the most important traits in wool yellowing susceptibility, measured as YPC. Size and sweat gland shape have been
shown to be highly correlated to YPC scores (S. Pietsch and D. Cottle cited by Cottle, 1996). Aitkenet al. (1994) re-ported a strong phenotypic correlation (0.85 ± n.a.) be-tween suint percentage and YPC in a Merino flock. However, the estimate observed in the current study was shown to be lower (0.35 ± 0.04; Table 2). A salient differ-ence between these two studies was that the Merino experi-ment compared sheep resistant to wool yellowing vs.
susceptible sheep, while the current study was done with a wide range of susceptible to wool yellowing in Corriedale sheep with YPC scores varying between 4 and 10 (10 being the maximum YPC score,i.e.fleeces more prone to yellow-ing). Consideration of only the extreme phenotypes by Aitkenet al.(1994) would have resulted in an inflated esti-mate for phenotypic correlation. This explanation also fits for the lower phenotypic correlations of YPC with suint K and Na observed in Corriedales compared to those reported for Merinos by Aitkenet al. (1994).
The finding that the genetic correlation between clean wool colour and suint percentage was not significant was a point of contention. This estimate (0.34 ± 0.31; Table 2) differed from that reported by James et al. (1990) (0.79 ± 0.23) when studying South Australian Merinos, de-spite those animals having a similar suint percentage aver-age to the Corriedale flock used in the current experiment.
Suint K instead had a strong genetic correlation with clean wool colour (0.64 ± 0.34, Table 2). Both suint per-centage and suint K were found to be genetically related to
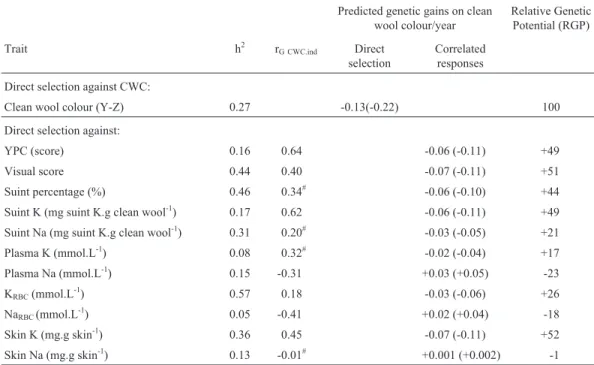
Table 6- Per annum expected correlated responses on clean wool colour (CWC) based on indirect selection on colour and physiological traits. Correlated
responses in units of standardised selection differential per generation are in brackets.
Predicted genetic gains on clean wool colour/year
Relative Genetic Potential (RGP)
Trait h2 r
G CWC.ind Direct
selection
Correlated responses
Direct selection against CWC:
Clean wool colour (Y-Z) 0.27 -0.13(-0.22) 100
Direct selection against:
YPC (score) 0.16 0.64 -0.06 (-0.11) +49
Visual score 0.44 0.40 -0.07 (-0.11) +51
Suint percentage (%) 0.46 0.34# -0.06 (-0.10) +44 Suint K (mg suint K.g clean wool-1) 0.17 0.62 -0.06 (-0.11) +49
Suint Na (mg suint K.g clean wool-1) 0.31 0.20# -0.03 (-0.05) +21 Plasma K (mmol.L-1) 0.08 0.32# -0.02 (-0.04) +17
Plasma Na (mmol.L-1) 0.15 -0.31 +0.03 (+0.05) -23 KRBC(mmol.L
-1
) 0.57 0.18 -0.03 (-0.06) +26
NaRBC(mmol.L-1) 0.05 -0.41 +0.02 (+0.04) -18
Skin K (mg.g skin-1) 0.36 0.45 -0.07 (-0.11) +52 Skin Na (mg.g skin-1) 0.13 -0.01# +0.001 (+0.002) -1
p = 1% indicates the proportion of selected sires. Proportion of selected dams have been fixed at 40%.#: Estimate non-significantly different from zero.
CRXY= i * hCWC* hind* rG CWC.ind*σP X: (Falconer, 1989). Direct response = i * h2CWC*σP CWC: (Falconer, 1989). RGP = (DRind/DRCWC)*100: (Raadsma
YPC (0.79 ± 0.22 and 0.83 ± 0.24, respectively, Table 2) however, it appeared that the relationship between clean wool colour and suint potassium concentration was more important than that of clean wool colour with percentage of suint. It is interesting to note that potassium is the main mineral present in suint (Truter, 1956) and it would be ex-pected that if a trait was highly correlated to suint K, it would also be correlated to suint percentage. However, it is possible that the amount of potassium per gram of suint could be greater in sheep producing more yellow wools even though these animals would still secrete the same amount of suint. The fact that suint percentage is less im-portant than suint K is an interesting result and needs fur-ther investigation.
It is not known whether sheep susceptible to wool yellowing have more suint K content or produce more suint or both when compared to sheep resistant to wool yellow-ing. The rPand rGbetween suint percentage and suint K are
high (0.63 ± 0.03 and 1.00 ± 0.07, respectively), therefore it would be expected that susceptible sheep would produce more sweat with higher K content than resistant sheep, but there are no data to prove this.
The low heritability estimates observed for plasma K and suint K support the assumption that these traits were highly influenced by the environment. An important point about the low heritability for suint K is that high rainfall, as occurred in this experiment, could have washed out the suint. Furthermore, sheep with different fleece architecture would present variations in terms of the amount of suint washed from the fleece. This could have increased the envi-ronmental variance for suint K therefore reducing its heritability estimate.
Considering that suint K can be affected by the envi-ronment, it was thought that skin K could be a better esti-mate of K before this mineral could be lost in the suint. Skin K was found to be more heritable than suint K, which was a promising result. The genetic correlation between suint K and skin K was found to be moderate (0.40 ± 0.34; Table 5) indicating a positive genetic relationship between the K concentrations excreted in suint and the K still to be ex-creted from sweat glands. More discouraging though were the non significant genetic correlations for skin K with YPC (0.11 ± 0.37; Table 4) and with plasma K (-0.35 ± 0.53; Table 5). Since suint K originates from plasma K, it was expected that plasma K and skin K would be positively correlated. Potassium measurement of the whole skin may incorporate too many different types of cells (sweat glands, sebaceous glands, wool follicles, dermal and epidermal cells), making it an unreliable predictor of the potassium concentrations in other fluids or tissues.
So far the results indicate that clean wool colour is more importantly genetically associated to the potassium concentrations in suint than to the actual suint content of the wool. The genetic association of these traits suggests that
the same traits involved in YPC are also important in non-scourable yellowing.
Although the phenotypic estimates observed here were lower than those found in Aitkenet al.(1994) for suint percentage and suint K with wool yellowing susceptibility, this study showed that these traits were strongly genetically linked. Furthermore, it was also found that plasma K was genetically associated to YPC and suint K. Considering these aspects together, it can be hypothesised that there must be a mechanism through which susceptible sheep will either have genetically high plasma K levels or transport more potassium into the sweat glands. However, to eluci-date this hypothesis, physiological studies need to be car-ried out to investigate these gaps in our knowledge.
As far as a suitable selection criterion is concerned the results showed that skin K, Visual Score, YPC and suint K were amongst the best indirect selection criteria for clean wool colour. However, selection using these traits was no better than the expected responses under direct selection against CWC, which was of -0.13 Y-Z units/year. This fig-ure will slow down efforts to genetically improve CWC un-less a more suitable trait is found in future experiments.
Acknowledgments
We acknowledge the financial support of CNPq (Conselho Nacional de Desenvolvimento Científico e Tec-nológico). We also would like to thank José Carlos Fer-rugem Moraes from Embrapa and Mark Young, Fraser Aitken, Jenny Nicol, Jill Sutton, Ross Wilson and Chris Lo-gan from Lincoln University.
References
Aitken FJ, Cottle DJ, Reid TC, and Wilkinson BR (1994) Mineral and amino acid composition of wool from New Zealand Me-rino sheep differing in susceptibility to yellowing. Austra-lian Journal of Agricultural Research 45(2):391-401. Benavides MV and Maher AP (2002) Indirect selection criteria
against clean wool colour in Corriedale sheep and their ef-fects on wool production traits. Genetics and Molecular Bi-ology 25(2):139-145.
Bigham ML, Meyer HH, and Smeaton JE (1983) The heritability of loose wool bulk and colour traits and their genetic and phenotypic correlations with other wool traits. Proceedings of the New Zealand Society of Animal Production 43:83-85. Clark MJ and Whiteley KJ (1977) Some observations on the
col-our of Australian wool. Wool Technology and Sheep Breeding 15(1):5-9.
Cottle DJ (1996) Selection programs for fleece rot resistance in Merino sheep. Australian Journal of Agricultural Research 47:1213-1233.
Cottle DJ, Zhao W, and Jones JC (1992) Experiments to promote colour changes in wool. Journal of Chemistry and Technol-ogy BioTechniques 55(4):351-354.
Falconer DS (1989) Introduction to Quantitative Genetics. 3rd ed. Longman Scientific & Technical, New York.
of sheep intensively screened for fleece weight. Proceedings of the New Zealand Society of Animal Production 48:207-214.
James PJ, Ponzoni RW, Walkley JRW, and Whiteley KJ (1990) Genetic parameters for wool production and quality traits in South Australian Merinos of the Collinsville family group. Australian Journal of Agricultural Research 41:583-594. Johnson DL and Thompson R (1995) Restricted maximum
likeli-hood estimation of variance components for univariate ani-mal models using sparse matrix techniques and average information. Journal of Dairy Science 78:449-456.
Maddocks IG and Jackson N (1988) Structural studies of sheep, cattle & goat skin: CSIRO - Division of Animal Production, Blacktown, NSW.
McGuirk BJ and Atkins KD (1980) Indirect selection for in-creased resistance to fleece rot and body strike. Animal Pro-duction in Australia 13:92-95.
New Zealand Standars (NZS) (1984) Method for the measure-ment of the colour of wool. Standards Association of New Zealand test method NZS 8707:1984. (Standards Associa-tion of New Zealand: Wellington, NZ).
Pattinson RD and Whiteley KJ (1984) Appraisal and measure-ment of the colour of Australian wool and the role of colour in sale by description. Wool Technology and Sheep Breeding 32:181-189.
Raadsma HW (1987) Evaluation of traits for indirect selection against fleece rot. Proceedings of the Sixth Conference of the Australian Association of Animal Breeding and Genet-ics, Perth, WA, p 343-346.
SAS/STAT (1990) User’s Guide Version 6 (Fourth). Cary, NC: SAS Institute Inc.
Sidey DJ (1931) Wool Research. Bulletin of New Zealand De-partment of Science and Industrial Research, n. 30. Siebers RWL and Maling TJB (1988) Flame photometry: a simple
method and reference range for erythrocyte sodium and po-tassium. Medical Laboratory Sciences 45:270-272. Standard Association of New Zealand (1995) Determination of
washing yield and clean fleece weight. Draft 6 - Part 2. Sumner RMW (1983) Effect of feeding and season on fleece
char-acteristics of Cheviot, Drysdale and Romney hogget wool. Proceedings of the New Zealand Society of Animal Produc-tion 43:79-82.
Sutton WG (1933) Some studies of the yolk in New Zealand wools. II: A study of yolk in the fleece during one year. Jour-nal of Textile Institute 24:T341-T350.
Thompson B (1987) The colour of wool - Appraisal versus mea-surement. Wool Technology and Sheep Breeding 35:147-155.
Thompson RH and Blanchflower WJ (1971) Wet-ashing appara-tus to prepare biological materials for atomic absorption spectrophotometry. LABP 20(2):859-861.
Truter EV (1956) Wool Wax - Chemistry and Technology. Cleaver-Hume Press Ltd, London.
Wilkinson BR (1981) Studies on fleece yellowing. Part 1: Predic-tion of susceptibility to yellow discolouraPredic-tion in greasy fleeces. Wool Technology and Sheep Breeding 29:169-174. Wilson JF (1946) Coloration of wool. National Wool Grower
36(1):27-28.