online | memorias.ioc.fiocruz.br
Phylogenetic analysis of Biomphalaria tenagophila (Orbigny, 1835)
(Mollusca: Gastropoda)
Liana K Jannotti-Passos1/+, Jeronimo C Ruiz2, Roberta L Caldeira3, Silvane MF Murta2, Paulo Marcos Z Coelho4, Omar S Carvalho3
1Moluscário Lobato Paraense 2Laboratório de Parasitologia Celular e Molecular 3Laboratório de Helmintologia e Malacologia Médica 4Laboratório de Esquistossomose, Instituto de Pesquisas René Rachou-Fiocruz, Av. Augusto de Lima 1715, 30190-001
Belo Horizonte, MG, Brasil
Mitochondrial DNA of Biomphalaria tenagophila, a mollusc intermediate host of Schistosoma mansoni in Brazil, was sequenced and characterised. The genome size found for B. tenagophila was 13,722 bp and contained 13 mes� senger RNAs, 22 transfer RNAs (tRNA) and two ribosomal RNAs (rRNA). In addition to sequencing, the mitochon�mitochon� drial DNA (mtDNA) genome organization of B. tenagophila was analysed based on its content and localization of both coding and non�coding regions, regions of gene overlap and tRNA nucleotide sequences. Sequences of protein, rRNA 12S and rRNA 16S nucleotides as well as gene organization were compared between B. tenagophila and Bi-omphalaria glabrata, as the latter is the most important S. mansoni intermediate host in Brazil. Differences between such species were observed regarding rRNA composition. The complete sequence of the B. tenagophila mitochon� drial genome was deposited in GenBank (accession EF433576). Furthermore, phylogenetic relationships were esti� mated among 28 mollusc species, which had their complete mitochondrial genome deposited in GenBank, using the neighbour�joining method, maximum parsimony and maximum likelihood bootstrap. B. tenagophila was positioned at a branch close to B. glabrata and Pulmonata molluscs, collectively comprising a paraphyletic group, contrary to Opistobranchia, which was positioned at a single branch and constituted a monophyletic group.
Key words: Biomphalaria tenagophila - mitochondrial genome - phylogenetic
The phylum Mollusca constitutes the second largest animal phylum and encompasses seven classes, namely: Gastropoda, Polyplacophora, Cephalopoda, Bivalvia, Scaphopoda, Aplacophora and Monoplacophora (Brusca & Brusca 2007). The phylum has a long geological his-The phylum has a long geological his-tory and approximately 35,000 species are known. Biom� phalaria (Gastropoda) molluscs are known to have origi-nated during the Jurassic era and endured a wide range of environmental changes, resulting in the development of survival mechanisms such as self-fecundation, diapause, aestivation, capacity to survive into deep trenches and high prolificacy (Paraense 1955), making them currently adapted to different environmental conditions.
Biomphalaria tenagophila is an important species concerning schistosomiasis transmission in Southern Brazil. This species has been the focus of investigations, as it comprises susceptible (Paraense & Corrêa 1978) populations and one population that is resistant to Schis� tosoma mansoni, which is from the Biological Reserve of Taim in Rio Grande do Sul, Brazil.
These molluscs have already been challenged by dif-ferent S. mansoni strains and variable number of mira-cidia, yet remained resistant to infection (Santos et al.
Financial support: FAPEMIG, FIOCRUZ
+ Corresponding author: [email protected] Received 30 January 2009
Accepted 18 December 2009
1979, Bezerra et al. 2003, Martins-Souza et al. 2003, Rosa et al. 2004, 2006, Coelho & Bezerra 2006). Several studies have been carried out in order to gain a better understanding of resistance traits, including molecular approaches using nuclear DNA regions (Pires et al. 1997, Spatz et al. 1999, Barbosa 2001, Rosa et al. 2005, Barbo-sa et al. 2006), but little is known about the genes related with the resistance phenotype in this population (Santos et al. 1979, de Freitas et al. 1985, Rosa 2002).
Studies using mitochondrial DNA have been pur-sued, as they provide further knowledge on extra-nuclear genetic information (Avise 1986). The mitochondrial DNA (mtDNA) molecule is a double-closed circle coding 13 messenger RNAs (mRNA), 22 transfer RNAs (tRNA) and two ribosomal RNAs (rRNA). This molecule con-tains non-coding regions with different sizes, including transcription start and replication sites (Wolstenholme 1992). Fractions of these non-coding regions may be du-plicated, resulting in mtDNA molecules of different sizes in some organisms. In molluscs, mtDNA is also a circular molecule in which mitochondrial genes (Boore & Brown 1994) and sequence order (Lecanidou et al. 1994) are or-ganized in varied patterns compared with mtDNA from other organisms. Moreover, mtDNA size varies within the phylum Mollusca. Among the Biomphalaria species,
Biomphalaria glabrata mtDNA is the only completely sequenced mitochondrial genome (DeJong et al. 2004).
sequences of 12S and 16S subunits of the ribosomal RNA and gene organization in B. tenagophila and B. glabrata were compared. In addition, the phylogenetic relationship was estimated among 28 mollusc species, for all of which the complete mitochondrial genomes were available in GenBank, through the neighbour-joining method (NJ), maximum parsimony (MP) and maximum likelihood (ML).
MATERIALS AND METHODS
Molluscs and DNA extraction � The B. tenagophila
cephalopodal region was used as a DNA source. Speci-mens of this species were sent from the Biological Re-serve of Taim originating from the colony at Federal University of Minas Gerais Interdepartmental Group for Schistosomiasis and then kept under laboratory con- and then kept under laboratory con-ditions at the Lobato Paraense Mollusc Rearing Sec-tor of the René Rachou Research Center-Fiocruz. This fragment was incubated in a buffer extraction solution (50 mM Tris-HCl -a GIBCO pH 8.0; 50 mM EDTA, 100 mM NaCl, SDS 0.5%) added to 20 µg/mL proteinase K for 12 h at 37ºC. The snail DNA extraction was car-ried out using kit Wizard® (Promega), according to the
manufacturer’s instructions.
Polymerase chain reaction (PCR) � Universal prim-ers [LCO and HCO (Folmer et al. 1994)], 16Sar and 16Sbr (Palumbi 1996), 12Sai and 12Sbi (Simon et al. 1990), Cyb1 - 5’AAAGGAAGAACTAAGCCTTTAGG 3’ (designed from B. glabrata sequence) andCB3 (Ko-cher et al. 1989) were used to amplify part of the regions of COI, 16S, 12S and Cytb, respectively. These regions were directly sequenced from PCR products, after en-zyme purification with ExoSap (GE Healthtech).
PCR amplifications were performed in a final vol-ume of 10 µL. Each reaction mixture was devised as follows: 1 ng template DNA, 5 pmoles of each primer, 200 µM each nucleotide (dNTP- PROMEGA) and 0.8 units of TaqDNA polymerase High-fidelity (Invitro-gen) in a buffer solution containing 10 mM Tris-HCl, pH 8.5, 50 mM KCl, 1.5 mM MgCl2.
Samples were amplified in a thermocycler (Program-mable Thermal Controller, MJ Research Inc, model PTC-100) according to the following cycle program: an initial cycle consisting of a denaturation step of 3 min at 95°C, an annealing step of 1 min at 50ºC and an exten-sion step of 30 s at 72ºC followed by 34 cycles of 1 min at 95°C (denaturation),1 min at 50°C (annealing) and 1 min at 72°C (extension), and a final extension step of 7 min at 72oC. After obtaining nucleotide sequences,
spe-cific primers were designed (Table I).
These primers amplified four B. tenagophila mi-tochondrial DNA fragments: COI-16S, 16S-Cyb, Cyb-12S and Cyb-12S-COI. This ensured that every mtDNA nu-cleotide was included.
The thermocycler program involved 30 cycles: an initial cycle containing a denaturation step of 1 min at 94°C and an annealing and extension step of 15 min at 68ºC, followed by 29 cycles of 15 s at 95°C (denatur-ation) and 15 min at 68°C (annealing and extension) [Long PCR (Cheng et al. 1994)].
Molecular cloning of PCR products (COI�16S, 16S� Cyb, Cyb�12S, 12S�COI) � Molecular fragments gener-ated by PCR were cloned in different plasmids accord-ing to size: the 2,200 bp fragment (COI-16S) was cloned in TOPO TA cloning (Invitrogen - Life Technologies), the 2,800 bp fragment (Cyb-12S) was cloned in pGEM-T EASY (Promega) and the fragments of 4,500 bp (16S-Cybe12S-COI) in TOPO XL PCR cloning (Invitrogen - Life Technologies). The protocol followed the manu-facturer’s instructions. The TOPO 10 F` strain from
Escherichia coli bacteria was transformed with recom-binant plasmids.
Genome assembly and sequencing analysis � The shotgun sequencing reads obtained from 521 DNA tem-plates, including those obtained using the 54 primers specifically designed for primer walking were analysed using PHRED/PHRAP/CONSED (Ewing et al. 1998, Ew-ing & Green 1998, Gordon et al. 1998) in order to read sequencer trace data, write the base calls and quality val-ues, assemble shotgun DNA sequence data and to visually inspect, edit and finish the alignments. A PHRED quality value of 20, which corresponds to an error probability of 1/100 in the base call at each position of the read and a minimal overlap of 50 bp with 92% identity were used as initial constraints in the clustering for genome assembly.
Tandem Repeat Finder software was used to find and analyse repeats in the B. tenagophila assembled genome. Repeat Masker (AFA Smit & P Green, unpublished ob-servations) together with Repbase databank (http://www. girinst.org) were used to identify known repeats and mask low complexity regions in the mollusc genome.
Analyses of the B. tenagophila assembled genome using different algorithms such as BLAST and FASTA were carried out using different databases including: the protein database from National Center for Biotech-nology Information (NCBI), the database of Clusters of Orthologous Groups of proteins (http://www.ncbi.nlm. nih.gov/COG/), a simple modular architecture research tool (SMART) (http://smart.emblheidelberg.de/), pro-tein families database of alignments and HMMs (http:// www.sanger.ac.uk/Software/Pfam/) and Gene Ontol-ogy (http://www.geneontolOntol-ogy.org/). Locally compiled mollusca and ribosomal RNA DBs were built by pars-ing public databases.
The annotation and graphical output of the B. tena� gophila genomic sequence was performed with an AR-TEMIS (http://www.sanger.ac.uk/Software/Artemis/) and in-house developed PERL scripts to analyse and format the results. All insilico searches and analyses described above, together with specific pipelines and PERL scripts developed during this work, were run in a local server us-ing in-house copies of databases and software.
The search for tRNA genes in genomic sequences was performed using a combinatorial approach using
ab initio predictions made by tRNAscan-SE software together with similarity searches against a locally com-piled tRNA database.
Phylogenetic inference and genome analysis � Putative gene products of the assembled genome were compared to the available complete proteomes of other mitochondrial genomes together and with general protein DBs such as to the non-redundant protein data set from NCBI in order to investigate the evolutionary relationships among them.
Clustal W (Thompson et al. 1994) and MAFFT (Ka-toh & Toh 2008) were used to perform a global multiple sequence alignment between the structural features anno-tated in the predicted genomes and proteomes of B. tena� gophila and B. glabrata. Analysis reports showing the sta-tistics for the multiple alignments were obtained through the use of Alistat software (Krogh et al. 1994).
The methods used for phylogenetic reconstruction, us-ing protein amino acid sequences (except for ATP8), were MP, NJ and ML. The MP and NJ were performed using algorithms provided in Phylogenetic Analysis Using Par-simony (PAUP v. 4.0) (Swofford 2002). MP analyses were carried out through heuristic searches by rearranging the branches. This method involves moving branches in order to achieve new topologies through a new reorganization. This procedure was performed by sectioning the tree into two pieces and connecting them to other parts of the tree in a process named “tree bisection and reconnection”. In total, 10,000 random replications were created. This process was carried out with the characters with unroots and unweights and the gaps introduced in the alignment process being treated as data errors and topological re-strictions were not applied. In order to test the reliability degree of the phylogenetic trees, the bootstrap method (Felsenstein 1985) was used with 10,000 pseudo-repli-cations. For genetic distance analysis, NJ (Saitou & Nei 1987) was generated by the model Kimura-2 parameter, including 10,000 pseudo-replication bootstraps. The ML method, using the JTT model (Whelan & Goldman 2001) of amino acid evolution with Gama variation rate, was carried out with PHYML software (Guindon & Gascuel 2003) by aligning protein amino acid sequences (except for ATP8). In order to test the reliability degree of phy-logenetic trees, bootstrap values (Felsenstein 1985) with 100 replications were used. As the outgroup, the mollusc species Katharina tunicata (Polyplacophora) was includ-ed in phylogenetic analyses.
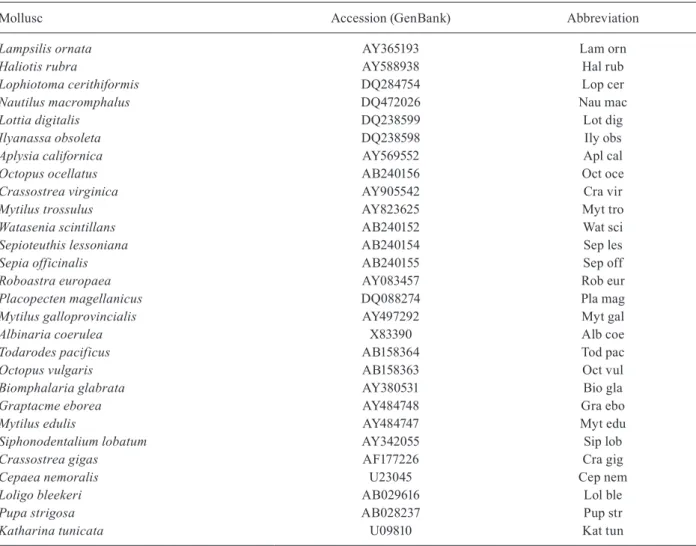
Table II shows molluscs used in the phylogenetic study.
RESULTS
mtDNA content � B. tenagophila mtDNA was com-pletely sequenced and characterised. The genome size encompasses 13,722 bp. This genome codes for two rR-NAs, 13 protein genes and a set of 22 tRNAs. The propor-tion of AT was 75.78%. Nine non-coding regions ranging from 1-54 bp consisted of a total of 110 bp. The largest non-coding regions were located between the NAD1 and NAD4L genes and between COIII and tRNAIle,
consist-ing of 54 and 42 bp, respectively. Nineteen overlappconsist-ing regions were found in B. tenagophila mtDNA and the largest overlap was found between NAD4L and Cytb genes comprising 29 bp.
The tRNAscan software identified six out of the 22 tRNA (Asp, Asn, Thr, Val, Ala, Pro). The other tRNAs were identified by nucleotide alignment with its corre-spondent in B. glabrata and B. tenagophila tRNA had an average size of 63 bp.
The genes found in the mitochondrial genome cod-ing for proteins were analysed based on the mitochon-drial genetic code of invertebrates. Most protein-coding genes were located on the plus strand (NAD5, NAD1, NAD4L, Cytb, COII, NAD4, NAD2, COI, NAD6). Genes coding the ATP6, ATP8, NAD3 and COIII pro-teins were located on the minus strand.
Regarding protein size, COII, NAD2, NAD4 and NAD4L were longer in B. tenagophila than in B. glabra� ta. The protein with the largest size difference between the two species proteins was NAD1, which was 11 ad-ditional amino acids shorter in B. glabrata. The sizes of NAD1 and NAD6 were smaller in B. tenagophila than in
B. glabrata. For ATP8, ATP6, NAD2, NAD4 and COIII, the termination codon is likely completed by adding an A during mRNA transcription. The least conserved pro-tein was ATP8, with 60% identity in the two species and the most conserved protein was COI, with 98% identity between these two species.
Four mtDNA initiation codons were found in B. tenagophila, namely: ATT (in 5 proteins), ATA (in 5 proteins), ATG (in 2 protein) and TTG (in 1 protein). The stop codons were TAA (in 6 proteins) and TAG (in 2 proteins), which have been described for mitochondri-al genes (Wolstenholme 1992). Incomplete stop codons were found in five proteins (ATP6, ATP8, COI, COII, NAD3, NAD4).
TABLE I
Specific primers
Primers Sequences
16SL1 16SL2 COIL2 COIR4 CybLF CybLR 12SLR 12SLF
5’GCACAGTCAAGGTACTGCGGCCATTTAAAAAAAATATCACTGG 5’AATCTCAAATGTATCCTGCCCAGTGATATTTTTTAAATGG 5’GGCCTGGTTGGAACTGGGTTATCTTTACTTATTCGTTTAGAGC 5’CCAAGCTCTAAACGAATAAGTAAAGATAACCCAGTTCCAACCAG
5’AAAGGAAGAACTAAGCCTTTAGGAGATTTAAACCATTTGG 5’TTAAATGGGATTTTTTCCAAATGGTTTAAATCTCCTAAAGG
Ribosomal RNAs 16S and 12S comprised 981 and 708 nucleotides, respectively. Sequence identity found between B. glabrata and B. tenagophila was 88% for rRNA 16S and 84% for rRNA 12S.
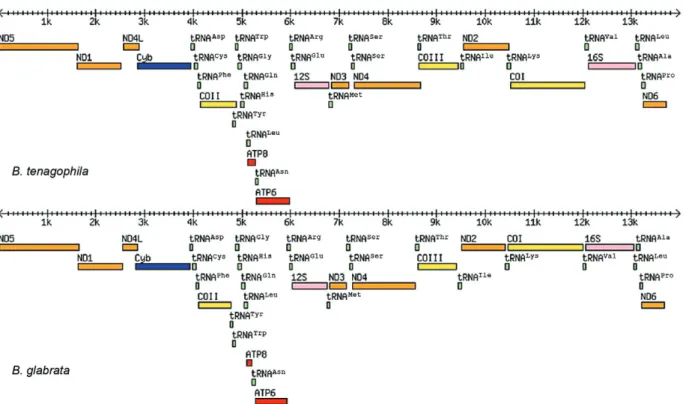
The same mitochondrial gene order was found in both B. tenagophila and B. glabrata (Fig. 1).
Phylogenomic analysis � mtDNA amino acid se-quences of 29 organisms from the Mollusca phylum were aligned (except for ATP8) and used for phylogenomic positioning analysis of B. tenagophila and B. glabrata in comparison with other molluscs.
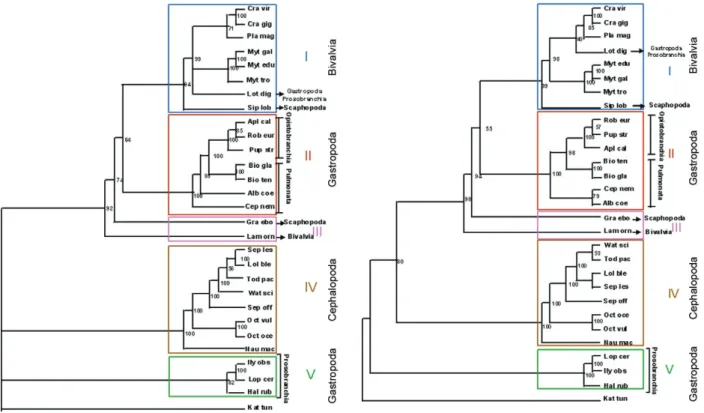
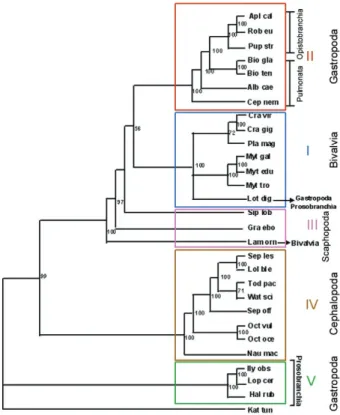
Regardless the phylogenetic methodology, the trees showed similar topology, comprising five groups. Group I: MP bootstrap, 94% (Fig. 2), ML bootstrap, 99% (Fig. 3) encompassed six molluscs of the Bivalvia class (Pro-tobranchia sub class, Pteriomorphia super order), one species of the Gastropoda class (Prosobranchia) and one species of the Scaphopoda class (Gadelida). In the NJ tree (Fig. 4), this group clustered the same molluscs when compared with MP and ML trees, except for the
species belonging to the Scaphopoda class (Gadelida) that are located in Group III with a bootstrap value of 100%. Group II comprised the Gastropoda class in all tree topologies, including Pulmonata and Opistobran-chia sub-classes, which was supported by a bootstrap value of 100%. Group III was located in a basal posi-tion in relaposi-tion to Groups I and II. In MP and ML trees, one species of the Scaphopoda class (Dentaliida) and another species of the Bivalvia class (Protobranchia sub class, Heterodonta super order) were closely positioned. In the NJ tree, three species were closely positioned, being two species of the Scaphopoda class (Dentaliida and Gadelida) and the same species of the Bivalvia class (Protobranchia sub class, Heterodonta super order). This group was supported by the following bootstrap values: 97% (NJ), 94% (ML) and 74% (MP). Group IV included species of the Cephalopoda class in all tree topologies, supported by a high bootstrap value of 100%. Group V comprised species of the Gastropoda class (Protobran-chia sub class) in all tree topologies, supported by 100% bootstrap values in both NJ and ML and 82% in MP.
TABLE II
Molluscs used in the phylogenetic study
Mollusc Accession (GenBank) Abbreviation
Lampsilis ornata AY365193 Lam orn
Haliotis rubra AY588938 Hal rub
Lophiotoma cerithiformis DQ284754 Lop cer
Nautilus macromphalus DQ472026 Nau mac
Lottia digitalis DQ238599 Lot dig
Ilyanassa obsoleta DQ238598 Ily obs
Aplysia californica AY569552 Apl cal
Octopus ocellatus AB240156 Oct oce
Crassostrea virginica AY905542 Cra vir
Mytilus trossulus AY823625 Myt tro
Watasenia scintillans AB240152 Wat sci
Sepioteuthis lessoniana AB240154 Sep les
Sepia officinalis AB240155 Sep off
Roboastra europaea AY083457 Rob eur
Placopecten magellanicus DQ088274 Pla mag
Mytilus galloprovincialis AY497292 Myt gal
Albinaria coerulea X83390 Alb coe
Todarodes pacificus AB158364 Tod pac
Octopus vulgaris AB158363 Oct vul
Biomphalaria glabrata AY380531 Bio gla
Graptacme eborea AY484748 Gra ebo
Mytilus edulis AY484747 Myt edu
Siphonodentalium lobatum AY342055 Sip lob
Crassostrea gigas AF177226 Cra gig
Cepaea nemoralis U23045 Cep nem
Loligo bleekeri AB029616 Lol ble
Pupa strigosa AB028237 Pup str
DISCUSSION
In the present paper, B. tenagophila mtDNA was fully sequenced and characterized. Its genome consisted of 13,722 bp, which was approximately the same size as most sequenced mollusc genomes and comprised two rRNA genes, 13 protein genes and 22 tRNA genes. The B. tenagophila mtDNA size is larger than that of B. glabrata
(13,670 bp), which is the smallest mollusc mitochondrial genome sequenced to date. The AT nucleotide content was slightly higher in B. tenagophila (75.78%) than in B. glabrata (74.6%). The protein-coding genes found in the plus and minus strands of B. tenagophila were the same those in B. glabrata.
The B. tenagophila tRNA set showed an average size of 63 nucleotides, with the exception of tRNAGlu
consist-ing of 69 nucleotides. This small size and the compact mtDNA in molluscs may account for shifts in tRNA secondary structure due to a reduction in chain size (Ya-mazaki et al. 1997).
Gastropods are the largest class of the phylum Mol-lusca and exhibit the highest diversity in morphology and ecology. However, phylogenetic relationships of tropods have been controversial and there are many gas-tropodan subgroups whose systematic positions are still ambiguous (Salvini-Plawen & Steiner 1996).
In the current paper, tree topologies obtained through different methods, including the NJ, MP and ML
meth-ods, were similar. The only specimen of the Bivalvia class that was not positioned in Group I is a fresh-water mol-lusc, Lampsilis ornata, whose ATP8 coding gene is in the mtDNA. The other specimens belonging to the Bivalvia class are marine and have no ATP8 coding gene located in mtDNA. The specimens of the Gastropoda class were located in different groups and specimens belonging to the sub-class Opistobranchia and to the sub-class Pul-monata were clustered in Group II. Most Prosobranchia specimens were located in Group V and only one species of this subclass, Lottia digitalis, was always located in Group I (Bivalvia). The mtDNA of L. digitalis is consider-ably larger than that of most Prosobranchia and possesses repetitive regions. Indeed, the mtDNA size in L. digitalis
(26,836 bp) is more similar to those of Bivalvia species. In addition, this mollusc has only 20 tRNA coding genes, whereas the other Prosobranchia molluscs have 22 genes. These results show that the Gastropoda constitute a para-phyletic group. The molluscs belonging to the Cephalopo-da class (Group IV) exhibited a fixed position in all tree topologies, comprising a monophyletic group.
B. tenagophila and B.glabrata were located in the same branch. However, both are more closely related with Opistobranchia than with other Pulmonata, sup-ported by high bootstrap values (98% and 100%). This result suggests that Pulmonata is a paraphyletic group, unlike Opistobranchia, which were located in a single
Fig. 1: gene rearrangements in the Biomphalaria tenagophila and Biomphalaria glabrata mitochondrial genomes. No transfer RNAs (tRNA) was found among ND6, ND5, ND1, ND4L and Cytb genes, but the following tRNAs were identified: between Cytb and COII genes for Asp, Cys and Phe; between COII and ATP8, six tRNAs (Tyr, Trp, Gly, His, Gln, Leu); between ATP8 and ATP6, tRNAAsn; between ATP6 and rRNA 12S,
two tRNAs (Arg and Glu); between rRNA 12S and NAD3, tRNAMet; between NAD3 and NAD4, two tRNAs for Ser; between NAD4 and COIII,
tRNAThr; between COIII and NAD2, tRNAIle; between NAD2 and COI, tRNALys; between COI and rRNA 16S, tRNAVal and between rRNA 16S
branch and thus, comprise a monophyletic group. The B. glabrata and B. tenagophila molluscs were shown to con-stitute an Opistobranchia sibling group.
Knudsen et al. (2006) carried out a phylogenetic study of molluscs using complete amino acid sequences of all mitochondrial proteins (except for ATP8) and showed that
B. glabrata was located in a branch separated from Pulmo-nata (Albinaria and Cepaea), corroborating the hypothesis that Pulmonata constitutes a paraphyletic group. More-over, the authors showed that the order Basommatophora was an Opistobranchia sibling taxon and that Opistobran-chia and Euthyneura constitute a monophyletic group. Our results support these data when accounting for another Pulmonata, B. tenagophila. Note that the tree topologies generated in our study were similar to those reported by Knudsen et al. (2006), who have also used mtDNA amino acid sequences, despite investigating a distinct set of mol-lusc species from ours.
Other phylogenetic investigations used nucleotide se-quences as data sources. However, amino acid sese-quences may provide more accurate data to compare organisms and carry out phylogenetic inferences, since they are free of synonym substitutions and thus less affected by high rates of mutation (Foster et al. 1997). Accordingly, investi-gators have chosen to use amino acid sequences in order to provide phylogenetic inferences for different organisms.
Grande et al. (2004) amplified a mtDNA region (partial COI, rrnL, complete NAD6-complete, partial-NAD5) of Gastropoda molluscs and used amino acid sequences to undertake phylogenetic inferences on Euthyneura (Opistobranchia + Pulmonata). The results have precluded Gastropoda from being regarded as a monophyletic group. However, Pulmonata organisms are considered as a monophyletic group based on mor-phological features (presence of lungs and many species have shells, despite the fact that they can be either modi-fied or absent in some groups).
Noteworthy is that the analyses using the mitochon-drial genome have provided more accurate results than those based on individual mitochondrial genes (Whel-an et al. 2001).
Our results suggest that the phylogenetic relation-ship of the phylum Mollusca is more complex than other groups of organisms due to the wide variety of both organisms and gene arrangement. Therefore, to better understand the phylogenetic relationships within this phylum, a larger number of mollusc species should be sequenced. Our results and conclusions may raise many issues concerning the current classification of the phy-lum Mollusca, suggesting further studies of biology, ul-trastructure, behaviour and genetics, to corroborate these findings obtained through a phylogenetic approach.
Fig. 2: the phylogeny of the mollusc. The tree was inferred from the well aligned positions of the mitochondrial protein sequences (ex-cluding ATP8), using maximum parsimony method. The bootstrap values are shown in the tree for 100 replicates.
Fig. 4: the phylogeny of the mollusc. The tree was inferred from the well aligned positions of the mitochondrial protein sequences (ex-cluding ATP8), using neighbor-joining method. The bootstrap values are shown in the tree for 100 replicates.
REFERENCES
Avise JC 1986. Mitochondrial DNA and the evolutionary genetics of higher animals. Philos Trans R Soc Lond B Biol Sci 312: 325-342.
Barbosa L 2001. Transferência de resistência ao Schistosoma man-soni em Biomphalaria tenagophila por transplante do órgão he� matopoiético de linhagem resistente (Taim, RS) para linhagem suscetível (Cabo Frio, RJ), MSc Thesis, Universidade Federal de Minas Gerais, Belo Horizonte, 40 pp.
Barbosa L, Caldeira RL, Carvalho OS, Vidigal TH, Jannotti-Passos LK, Coelho PM 2006. Resistance to Schistosoma mansoni by transplantation of APO Biomphalaria tenagophila. Parasite Im� munol 28: 209-212.
Bezerra FSM, Nogueira-Machado JA, Martins-Souza RL, Chaves MM, Correa RF, Coelho PMZ 2003. Effect of gamma radiation on the activity of hemocytes and on the course of Schistosoma mansoni infection in resistant Biomphalaria tenagophila snails. Mem Inst Oswaldo Cruz 98: 73-75.
Boore JL, Brown WM 1994. Mitochondrial genomes and phylogeny of mollusks. Nautilus 108 (Suppl. 2): 61-78.
Brusca RC, Brusca GJ 2007. Invertebrados, 2nd ed., Guanabara Koogan, Rio de Janeiro, 1098 pp.
Cheng S, Chang SY, Gravitt P, Respess R 1994. Long PCR. Nature 369: 684-685.
Coelho JR, Bezerra FSM 2006. Compatibility of Biomphalaria tenagophila with Schistosoma mansoni: a study of homologous plasma transference. Mem Inst Oswaldo Cruz 101: 111-112.
de Freitas JR, Boschi MB, dos Santos MB 1985. Suscetibilidade de “híbridos” de Biomphalaria tenagophila à cepa LE (BH) do Schistosoma mansoni. Rev Inst Med Trop Sao Paulo 27: 6-12.
DeJong RJ, Emery AM, Adema CM 2004. The mitochondrial genome of Biomphalaria glabrata (Gastropoda, Basommatophora), inter-mediate host of Schistosoma mansoni. J Parasitol 90: 991-997.
Ewing B, Green P 1998. Base-calling of automated sequencer traces using phred. II. Error probabilities. Genome Res 8: 186-194.
Ewing B, Hillier L, Wendl MC, Green P 1998. Base-calling of au-tomated sequencer traces using phred. I. Accuracy assessment. Genome Res 8: 175-185.
Felsenstein J 1985. Confidence limits on phylogenies: an approach using the bootstrap. Evolution 39: 783-791.
Folmer O, Black M, Hoeh W, Lutz R, Vrijenhoek R 1994. DNA prim-ers for amplification of mitochondrial cytochrome c oxidase sub-unit I from diverse metazoan invertebrates. Mol Mar Biol Bio� technol 3: 294-299.
Foster PG, Jermiin LS, Hickey DA 1997. Nucleotide composition bias affects amino acid content in proteins coded by animal mitochon-dria. J Mol Evol 44: 282-288.
Gordon D, Abajian C, Green P 1998. Consed: a graphical tool for se-quence finishing. Genome Res 8: 195-202.
Grande C, Templado J, Cervera JL, Zardoya R 2004. Molecular phylogeny of euthyneura (Mollusca: Gastropoda).Mol Biol Evol 21: 303-313.
Guindon S, Gascuel O 2003. A simple, fast and accurate algorithm to estimate large phylogenies by maximum likehood. Syst Biol 52: 696-704.
Katoh K, Toh H 2008. Recent developments in the MAFFT multiple sequence alignment program. Brief Bioinform 9: 286-298.
Knudsen B, Kohn AB, Nahir B, McFadden CS, Moroz LL 2006. Complete DNA sequence of the mitochondrial genome of the sea-slug, Aplysia californica: conservation of the gene order in Euthyneura. Mol Phylogenet Evol 38: 459-469.
Kocher TD, Thomas WK, Meyer A, Edwards SV, Pääbo S, Villablanca FX, Wilson AC 1989. Dynamics of mitochondrial DNA evolution in animals: amplification and sequencing with conserved prim-ers. Proc Natl Acad Sci USA 86: 6196-6200.
Krogh A, Brown M, Mian IS, Sjölander K, Haussler D 1994. Hidden Markov models in computational biology. Applications to protein modeling. J Mol Biol 235: 1501-1531.
Lecanidou R, Douris V, Rodakis GC1994. Novel features of metazoan mtDNA revealed from sequence analysis of three mitochondrial DNA segments of the land snail Albinaria turrita (Gastropoda: Clausiliidae). J Mol Evol 38: 369-382.
Martins-Souza RL, Pereira CA, Coelho PM, Negrão-Corrêa D 2003. Silica treatment increases the susceptibility of the Cabo Frio strain of Biomphalaria tenagophila to Schistosoma mansoni in-fection but does not alter the natural resistance of the Taim strain. Parasitol Res 91: 500-507.
Palumbi SR 1996. Nucleic acids II: the polymerase chain reaction. In DM Hillis, C Moritz, BK Mable (eds.), Molecular systematics, Sinauer Associates, Suderland, p. 233.
Paraense WL 1955. Self and cross-fertilization in Australorbis glabra� tus. Mem Inst Oswaldo Cruz 53: 285-291.
Paraense WL, Corrêa LR 1978. Differential susceptibility of Biomphalaria tenagophila populations to infection with a strain of Schistosoma mansoni.J Parasitol 64: 822-826.
Rosa FM 2002. Biomphalaria tenagophila: Estudos parasitológicos, genéticos e moleculares em descendentes do cruzamento entre linhagens resistente (Taim � RS) e susceptível (Joinville � SC) ao Schistosoma mansoni, MSc Thesis, Universidade Federal de Mi-nas Gerais, Belo Horizonte, 81 pp.
Rosa FM, Caldeira RL, Carvalho OS, Godard ALB, Coelho PMZ 2004. Dominant character of the molecular marker of Biomphalaria tenagophila strain (Mollusca: Planorbidae) resistant to Schisto� soma mansoni. Mem Inst Oswaldo Cruz 99: 85-87.
Rosa FM, Godard AL, Azevedo V, Coelho PM 2005. Biomphalaria
tenagophila: dominant character of the resistance to Schisto�
soma mansoni in descendants of crossbreedings between resis-tant (Taim, RS) and susceptible (Joinville, SC) strains. Mem Inst Oswaldo Cruz 100: 19-23.
Rosa FM, Godard ALB, Negrão-Correa D, Rodrigues HA, Car-valho OS, Caldeira RL, Teles HMS, Maciel E, Jannotti-Passos LK, Coelho PMZ 2006. Biomphalaria tenagophila: dynamics of populations of resistant and susceptible strains to Schistosoma mansoni, with or without pressure of the parasite. Mem Inst Oswaldo Cruz 101 (Suppl. I): 247-251.
Saitou N, Nei M 1987. The neighbor-joining method: a new method for reconstructing phylogenetic trees. Mol Biol Evol 4: 406-425.
Salvini-Plawen LV, Steiner G 1996. Synapomorphies and plesiomor-phies in higher classification of Mollusca. In TD Taylor (ed.), Origin and evolutionary radiation of the Mollusca, Oxford Sci-entific, Oxford, p. 29-35.
Santos MBL, Freitas JR, Corrêa MCR, Coelho PMZ 1979. Suscetibili-dade ao Schistosoma mansoni de híbridos de Biomphalaria tena� gophila do Taim, RS, Cabo Frio, RJ, e Belo Horizonte, MG. Rev Inst Med Trop Sao Paulo 21: 281-286.
Simon C, Paabo S, Kocher TD, Wilson AC 1990. Evolution of mi-tochondrial ribosomal RNA in insects as shown by the poly-merase chain reaction. In M Clegg, S O’Brien (eds.), Molecular evolution, UCLA Symposia on Molecular and Cellular Biol-ogy, Liss, p. 235-244.
Spatz L, Vidigal THDA, Caldeira RL, Dias Neto E, Cappa SMG, Carvalho OS 1999. Study of Biomphalaria tenagophila tenago� phila, B. t. guaibensis and B. occidentalis by polymerase chain reaction amplification and restriction enzyme digestion of the ribosomal RNA intergenic spacer regions. J Molluscan Stud 65: 143-149.
Swofford DL 2002. PAUP*: Phylogenetic Analysis Using Parsimony, (*and other methods), Versin 4.0. Sinauer, Sunderland, MA.
Thompson JD, Higgins DG, Gibson TJ 1994. CLUSTAL W: improv-ing the sensitivity of progressive multiple sequence alignment through sequence weighting, position-specific gap penalties and weight matrix choice. Nucleic Acids Res 22: 4673-4680.
Whelan S, Goldman N 2001. A general empirical model of protein evolution derived from multiple protein families using a maxi-mum-likehood approach. Mol Biol Evol 18: 691-699.
Whelan S, Liò P, Goldman N 2001. Molecular phylogenetics: state-of-the-art methods for looking into the past. Trends Genet 17: 262-272.
Wolstenholme DR 1992. Animal mitochondrial DNA: structure and evolution. Int Rev Cytol 141: 173-216.