Patterns of molecular evolution in pathogenesis-related proteins
Nicole M. Scherer
1,2*, Claudia E. Thompson
1*, Loreta B. Freitas
1, Sandro L. Bonatto
3and Francisco M. Salzano
11
Universidade Federal do Rio Grande do Sul, Instituto de Biociências, Departamento de Genética,
Porto Alegre
,
RS, Brazil.
2
Heinrich Heine Universität, Bioinformatik Institut, Düsseldorf, Germany.
3
Pontifícia Universidade Católica do Rio Grande do Sul, Faculdade de Biociências,
Centro de Biologia Genômica e Molecular, Porto Alegre
,
RS, Brazil.
Abstract
The genes encoding 13 classes of pathogenesis-related (PR) proteins were examined for positive selection using maximum-likelihood (ML) models of codon substitution. The study involved 194 sequences from 54 species belonging to 37 genera. Although the sizes of the sequences examined varied from 237 bp for PR12 to 1,110 bp for PR7, most classes (9 out of 13) contained sequences made up of more than 400 nucleotides. Signs of positive selection were obtained for sites in PR proteins 4, 6, 8, 9 and 15 using an ML-based Bayesian method and likelihood ratio tests. These results confirm the importance of positive selection in proteins related to defense mechanisms already observed in a wide array of organisms.
Key words:pathogenesis-related proteins, PRs, molecular variability, positive selection, maximum-likelihood methods.
Received: September 23, 2004; Accepted: March 31, 2005.
Introduction
Pathogenesis-related (PR) proteins are coded by host plants as a response to pathological or related situations, and normally accumulate not only locally in the place of in-fection, but are formed systemically following infection by bacteria, fungi or viruses, or after induction by abiotic stress factors. Such proteins have a wide array of functions in that they can be hydrolases, transcription factors, prote-ase inhibitors, enzymes associated with various metabolic pathways and allergenic products. The functional motifs of PR proteins are related to a number of eukaryotic intra and intercellular proteins involved in very distinct functions, e.g. sperm-maturation glycoproteins in rodents, store pro-teins in seeds or flower development and differentiation. It is possible, therefore, that the defensive functions of PR proteins evolved after their emergence as gene families (see review in van Loon and van Strien, 1999).
It is clear that PR proteins are important not only to the plants themselves but also to any attempt to improve plants through artificial selection, and it is, therefore, of in-terest to establish how such proteins evolved naturally. The
neutralist theory of molecular evolution (Kimura, 1983) states that the majority of nucleotide and amino acid substi-tutions have no adaptive consequences, although tests de-veloped to verify this assumption (Wayne and Simonsen, 1998) in some cases reject a strictly neutral model but are unable to distinguish between different forms of natural se-lection. A powerful method to detect positive selection at the molecular level is the comparison of synonymous (dS) and non-synonymous (dN) substitution rates in genes which code for proteins using the expressionw= dN/dS. If amino acid changes are advantageouswwill be greater than one, while if they are deleteriouswwill be lower than one, with neutral mutations yieldingw= 1. However, this simple ra-tio does not account for variable rates of selecra-tion between sites. Appropriate codon-based models were developed by Nielsen and Yang (1998) and Yanget al. (2000) who devel-oped a series of 14 different models (M0-M13) to thor-oughly investigate the variability ofwratios between sites, each model having a different assumption about the nature of the distribution that could be found. However, some of those models are hard to use and only models 0 (one-ratio), 1 (neutral), 2 (selection), 3 (discrete), 7 (beta) and 8 (beta & w) are recommended by Yanget al. (2000).
The subject of the present paper is a survey of the pri-mary structure of representatives of 13 of the 15 PR protein
www.sbg.org.br
Send correspondence to Francisco M. Salzano, Departamento de Genética, UFRGS, Caixa Postal 15053, Porto Alegre-RS, Brazil 91501-970 E-mail: [email protected].
*N.M. Scherer and C.E. Thompson contributed equally to this work, the order of authorship being arbitrary.
families, searching for evidences of positive selection. It will be seen that the search resulted in the identification of several sites in which such a process is probably occurring.
Material and Methods
Data retrieval
The databanks used as sources for the protein and DNA sequences were the SWISS-PROT and TrEMBL (Bairoch and Apweiler, 2000) developed by the Swiss In-stitute of Bioinformatics and the European Bioinformatics Institute respectively. In a few cases the GenBank (Na-tional Center for Biotechnological Information, USA) was also utilized. These databanks and several other tools can be found in the Expert Protein Analysis System (ExPASy) site at http://www.expasy.org/.
The sequence search was based on the PR protein classification performed by van Loon and van Strien (1999), the descriptions and authors referenced for each PR protein in that article being used as key words for the searches.
Several searching tools were utilized with the objec-tive of covering all the sequences registered up to now. The tool which was found to be the most efficient for the recog-nition and identification of the available sequences was the Sequence Retrieval System (SRS) of Etzold and Argos (1993) available on the SWISS-PROT page. This proce-dure was used to obtain most of the sequences and was es-pecially useful for imperfectly described sequences because it permits several searching procedures,i.e.by bib-liographic reference, organism, key word, gene name or ac-cess code. The PSI BLAST Network Service (Altschulet al., 1997) was also employed and shown to be very compre-hensive, avoiding the retrieval of sequences that would not be useful in the analysis. This tool has a direct link with the SWISS-PROT access (http://www.expasy.org/sprot).
Methodology
The DNA sequences were aligned with the multiple sequence alignment CLUSTAL X program version 1.8 (Thompson et al., 1997; Jeanmougin et al., 1998) with manual corrections based on the codon pattern obtained us-ing the DNATagger program, a color program for DNA coding alignments (Monteiro de Basso and N.M. Scherer, unpublished). Considerable care was taken to guarantee a proper analysis of the data, and archives of the alignments are available on request.
The phylogenies were estimated for each family by maximum likelihood and neighbor-joining methods using the p distance option and the HKY substitution model (Hasegawaet al., 1985) implemented in the Tree-Puzzle program (Schmidtet al., 2002). The resultant tree topolo-gies were used to calculate the branch lengths using the M0 model through the CODEML program of the PAML packet (Yang, 1997). A relative measure of sequence divergence
was calculated using the average number of nucleotide changes per codon per branch, that isS/(2T-3), where 2T-3 is the number of branches of an unrooted tree ofTtaxa and Sis the number of nucleotide substitutions per codon along the tree.
Afterwards, analyses using the maximum-likelihood models recommended by Yang et al(2000) were imple-mented in the PAML program. All models were run using the F3x4 option in the PAML program, where expected codon frequencies were based upon nucleotide frequencies occurring at the three codon positions. The one-ratio model (M0) assumes onewratio for all sites. The neutral model (M1) presupposes a proportion p0of conserved sites with
w0= 0 and p1= 1 - p0of neutral sites withw1= 1, as would occur if almost all non-synonymous substitutions were ei-ther deleterious or neutral. The positive selection model (M2) adds an additional class of sites with frequency p2= 1-p0-p1andw2is estimated from the data. In the dis-crete model (M3), the probabilities (p0, p1and p2) of each site which was submitted to purifying selection, neutral se-lection and positive sese-lection, respectively, and their corre-spondingwratios (w0,w1,w2) are inferred from the data. The beta model (M7) is a null test for positive selection, as-suming a beta distribution withwbetween 0 and 1. Finally, the beta &w(M8) model adds one extra class with the same ratiow1. Sites which yielded posterior probabilities higher than 95% were considered significantly affected by selec-tion.
The likelihood ratio test (LRT) was used to verify whether the difference ratiow was significantly different from 1 for each pairwise comparison: M1vs.M2, M0vs. M3, M7vs.M8 and M8a (beta &w= 1)vs.M8 (beta &w ³ 1). The LRT performs a comparison of the likelihood scores of the two models, with the constraint ofw= 1 and without such constraint: LR = 2 (ln1 - ln2). This LRT statis-tic approximately follows a chi-square distribution and the number of degrees of freedom is equal to the number of ad-ditional parameters in the more complex model. The ques-tion of sequence divergence and the accuracy and power of the likelihood ratio test in detecting positive selection has been examined by Anisimovaet al.(2001, 2002) and we have followed their recommendations in the choice of the tests.
Results
The main characteristics of 13 of the 14 recognized PR protein families, plus one that may be soon included (L.C. van Loon, personal communication) are given in Ta-ble 1. As mentioned in the introduction, these proteins have a wide array of forms with different properties but they can be considered together due to their function in plant de-fense.
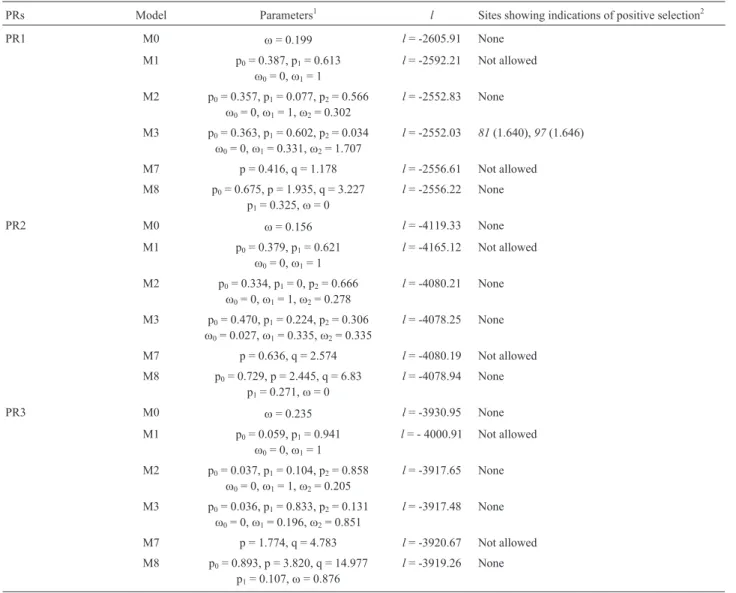
characteristics listed in Table 3. They varied markedly in sizes, from only 237 bp (PR12) up to 1,110 bp (PR2), the latter being 4.7 times larger than the first. The interval of values for the transition/transversion rates was from 1.45 (PR10) to 3.42 (PR15), while the relative sequence divergencies ranged between 0.027 (PR8) and 0.423 (PR3). Table 4 lists the parameter estimates and log-likelihood values under models of variable w ratios be-tween sites and those obtained with the M0 model (one-ratio), which assumes the same ratio for all sites. The re-sults for PR proteins 2, 3, 5, 12, and 14 were negative, while those for PR proteins 1, 10 and 13 were borderline in the sense that significant indications for positive selection are
suggested for one of the models with no confirmatory evi-dence from the other models. In contrast, the data for PR proteins 4, 6, 8, 9, and 15 were the most interesting, since the ML analysis inferred positive selection for those pro-teins in more than one model. In PR propro-teins 4, 6 and 8 all models examined for the presence of positively selected sites indicated the presence of such sites but for PR proteins 9 and 15 only two of them allow the same conclusion. How-ever, the statistical significance of the difference between the null models (M0, M1 and M7) and other models re-quired the application of likelihood ratio tests (LRTs).
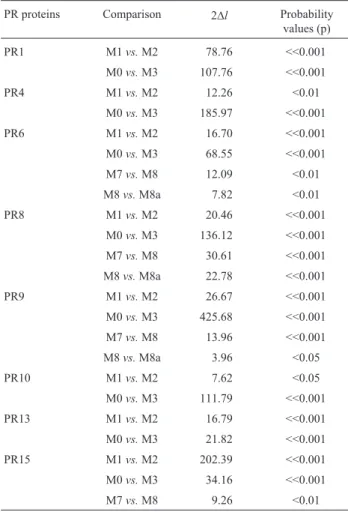
We calculated four LRTs, which compared M0 with M3, M1 with M2, M7 with M8, and M8 with M8a, the latter being a procedure available in the PAML program, in which a null M8a, withw= 1 fixed is compared with the
al-Table 1 - Information about the pathogenesis-related (PR) proteins investigated in the present study.
Family Properties Other remarks
1 Unknown Specific members have antifungal activities
2 Beta-1,3 glucanase A tryptophan residue is important in the interaction with the glucan substrate
3 Chitinases types I, II, IV, V, VI, VII
Activities on colloidal chitin may vary over 100-fold
4 Chitinases types I, II Typical members are barwins, ex-tracted from barley
5 Thaumatin-like Intensely sweet tasting, they are in-volved both in the acquired sys-temic resistance and reaction to stress
6 Proteinase-inhibitor Implicated in defense against in-sects and other herbivores, micro-organisms, and nematodes
8 Chitinase type III Basic isoforms possess substantial lysozyme activity
9 Peroxidase They strengthen plant cell walls by catalyzing lignin deposition in re-action to microbial attack
10 Ribonuclease-like Typical members are the plant al-lergens of the Bet v 1 multigenic family
12 Defensin or gamma-purothionin
Antifungal activity
well-recognized, rich in cystein residues, widely distributed
13 Thionin Their type member is not elicited by salicylates, suggesting a differ-ent activation route
14 Lipid-transfer protein
They transfer phospholipids be-tween two membranesin vitro, and probably insert themselves in the pathogen cell membrane, its cen-tral hydrophobic cavity forming a pore that leads to intracellular ion loss and its death
15 Oxalate oxidase Typical members are the germins, also involved in seed ger-mination
Source: van Loon and van Strien (1999).
Table 2- Pathogenesis-related (PR) proteins to which the sequences considered belong, and respective accession numbers in the data banks.
PR proteins Accession numbers of the sequences
PR1 P35792, P35793, Q05968, Q43489, Q04108, P04284, P07053, P08299, P09042, Q40397, Q40557, Q9SC15, Q941G6, O82714, Q94F73
PR2 Q01413, P23431, P23432, P23433, P23546, P23547, P27666, P52399, O65360, P52401
PR3 O22065, O22066, O22067, O22068, O22069, O22070, O22071, O22072, O22073, O22074, O22075, O22076, P19172, Q9XFW7, O23803, O23804, O23805, O23806
PR4 P43082, O48880, P02877, P93180, P32045, P29062, P29063, Q40558, P09762, O64392, O64393, O81228, Q41802
PR5 P50695, P50696, P50697, P50698, Q9ARG0, Q9SMH2, CAB99485, P32937, P32938, P12670, Q9M3X2, O82546, Q9FSG7, Q40428, P14170, P25871, Q40529, Q94JN9, P50694, O80327, Q9S776, Q9ZSN0, P50701, P50702, Q9FT35, P27357, Q94F70
PR6 P05118, P20076, P16231, Q03198, Q03199, Q02214, AAA697, P08454, Q00783, Q07459, Q41434, Q43648, Q43651
PR8 P1971, Q9S838, Q9SXJ2, Q9SXJ3, Q95SXJ4, Q9S7J5, Q9M7H3, Q9M7H4, Q9M7H2, Q9M7H0, Q9M7H1, Q9SXJ1, Q9M7G7, Q9M7G9, Q9M7G6, Q9M7H5, Q9M7G4, Q9M7G0, Q9M7G1, Q9M7G2, Q9M7F9, Q9M7F7, Q9M7F4, Q9M7F5, Q9M7G5
PR9 Q8S3U4, Q8RVP3, Q42905, Q40949, Q40950, Q43049, Q43050, Q43051, Q43099, Q43100, Q43101, Q43102
PR10 P49372, P15494, P43176, P43177, P43178, P43179, P43180, P43183, P43184, P43185, P43186, P45431, P26987, P19417, P19418, P27538, P25985, P25986, P13239, P14710, P27047
PR12 P30225, Q39313, Q94IN7, Q9FS38, O24331, O24332, P30230
PR13 P08772, P09617, P09618, P21742, Q42838, Q9ZNY5, P01543, P32032, Q9T0P2, Q43205
PR14 Q42614, Q42615, Q42616, Q42642, Q43304, O49200, Q9FVA5, Q9M6B6, Q9M6B8, Q43129, P27056, P93224, Q03461, Q42952
Table 3- Information about the material investigated in the present study.
Pathogenesis-related proteins
Number of sequences
Number of species
Sizes of sequences (bp)
Aligned nucleotides
Kappa (ts/tv)1
Relative sequence divergence
PR1 15 5 477-504 513 2.11 0.185
PR2 10 4 1026-1110 1134 1.76 0.234
PR3 18 3 795-906 906 1.73 0.423
PR4 13 10 348-360 360 1.58 0.314
PR5 28 15 507-753 840 1.64 0.235
PR6 13 5 282-357 357 1.50 0.131
PR8 25 13 867-1005 1047 2.75 0.027
PR9 12 6 909-978 978 2.09 0.254
PR10 21 6 462-480 483 1.45 0.210
PR12 7 4 237-240 240 3.40 0.126
PR13 10 3 408-411 414 2.09 0.125
PR14 14 5 342-360 363 1.54 0.216
PR15 9 3 669-672 672 3.42 0.149
1ts: transitions; tv: transversions.
Table 4- Parameters estimates and log-likelihood values under models of variablewratios among sites.
PRs Model Parameters1 l Sites showing indications of positive selection2
PR1 M0 w= 0.199 l= -2605.91 None
M1 p0= 0.387, p1= 0.613
w0= 0,w1= 1
l= -2592.21 Not allowed
M2 p0= 0.357, p1= 0.077, p2= 0.566
w0= 0,w1= 1,w2= 0.302
l= -2552.83 None
M3 p0= 0.363, p1= 0.602, p2= 0.034
w0= 0,w1= 0.331,w2= 1.707
l= -2552.03 81(1.640),97(1.646)
M7 p = 0.416, q = 1.178 l= -2556.61 Not allowed
M8 p0= 0.675, p = 1.935, q = 3.227
p1= 0.325,w= 0
l= -2556.22 None
PR2 M0 w= 0.156 l= -4119.33 None
M1 p0= 0.379, p1= 0.621
w0= 0,w1= 1
l= -4165.12 Not allowed
M2 p0= 0.334, p1= 0, p2= 0.666
w0= 0,w1= 1,w2= 0.278
l= -4080.21 None
M3 p0= 0.470, p1= 0.224, p2= 0.306
w0= 0.027,w1= 0.335,w2= 0.335
l= -4078.25 None
M7 p = 0.636, q = 2.574 l= -4080.19 Not allowed
M8 p0= 0.729, p = 2.445, q = 6.83
p1= 0.271,w= 0
l= -4078.94 None
PR3 M0 w= 0.235 l= -3930.95 None
M1 p0= 0.059, p1= 0.941
w0= 0,w1= 1
l= - 4000.91 Not allowed
M2 p0= 0.037, p1= 0.104, p2= 0.858
w0= 0,w1= 1,w2= 0.205
l= -3917.65 None
M3 p0= 0.036, p1= 0.833, p2= 0.131
w0= 0,w1= 0.196,w2= 0.851
l= -3917.48 None
M7 p = 1.774, q = 4.783 l= -3920.67 Not allowed
M8 p0= 0.893, p = 3.820, q = 14.977
p1= 0.107,w= 0.876
Table 4 (cont.)
PRs Model Parameters1 l Sites showing indications of positive selection2
PR4 M0 w= 0.117 l= -2421.80 None
M1 p0= 0.441, p1= 0.559
w0= 0,w1= 1
l= -2423.41 Not allowed
M2 p0= 0.483, p1= 0.494, p2= 0.023
w0= 0,w1= 1,w2= 6.565
l= -2417.28 99(6.427)
M3 p0= 0.579, p1= 0.401, p2= 0.020
w0= 0.011,w1= 0.290,w2= 1.985
l= -2328.82 37(1.941),99(1.985)
M7 p = 0.272, q = 1.426 l= -2332.36 Not allowed
M8 p0= 0.983, p = 0.323, q = 2.114
p1= 0.017,w= 2.098
l= -2329.67 99(2.060)
PR5 M0 w= 0.148 l= -5352.25 None
M1 p0= 0.187, p1= 0.813
w0= 0,w1= 1
l= -5521.84 Not allowed
M2 p0= 0.230, p1= 0.770, p2= 0
w0= 0,w1= 1,w2= 999.0
l= -5519.66 None
M3 p0= 0.218, p1= 0.538, p2= 0.243
w0= 0,w1= 0.127,w2= 0.440
l= -5238.33 None
M7 p = 0.664, q = 3.033 l= -5242.50 Not allowed
M8 p0= 1, p = 0.664, q = 3.033
p1= 0,w2= 2.123
l= -5242.50 None
PR6 M0 w= 0.460 l= -1339.56 None
M1 p0= 0.314, p1= 0.686
w0= 0,w1= 1
l= -1322.46 Not allowed
M2 p0= 0.315, p1= 0.668, p2= 0.016
w0= 0,w1= 1,w2= 8.045
l= -1314.11 25(8.040),84(7.903)
M3 p0= 0.625, p1= 0.362, p2= 0.013
w0= 0.145,w1= 1.061,w2= 6.328
l= -1305.29 2(1.082),12(1.586),19(1.026),21(1.113),22
(1.017),25(6.291),35(1.072),36(1.057),39
(1.058),47(1.289),52(1.072),54(1.027),62
(1.129),64(1.063),78(1.190),84(5.882),86(1.046)
M7 p = 0.373, q = 0.497 l= -1312.53 Not allowed
M8 p0= 0.986, p = 0.440 , q = 0.533
p1= 0.014,w= 5.606
l= -1306.48 25(5.593)
PR8 M0 w= 0.292 l= -2906.21 None
M1 p0= 0.669, p1= 0.331
w0= 0,w1= 1
l= -2859.22 Not allowed
M2 p0= 0.667, p1= 0.309, p2= 0.024
w0= 0,w1= 1,w2= 5.152
l= -2848.98 128(5.065),131(5.070),248(3.174)
M3 p0= 0.543, p1= 0.406, p2= 0.051
w0= 0.019,w1= 0.361,w2= 3.097
l= -2838.15 128(3.096),131(3.097),145(2.994),
211(3.096),221(3.093),248(3.096),279(3.054)
M7 p = 0.124, q = 0.370 l= -2853.46 Not allowed
M8 p0= 0.953, p = 0.426, q =1.992
p1= 0.046,w= 3.234
l= -2838.15 128(3.229),131(3.231),211(3.228),
221(3.218),248(3.228),279(3.113)
PR9 M0 w= 0.227 l= -6058.13 None
M1 p0= 0.407, p1= 0.593
w0= 0,w1= 1
l= -5976.13 Not allowed
M2 p0= 0.425, p1= 0.550, p2= 0.025
w0= 0,w1= 1,w2= 5.070
l= -5962.79 45(5.291),155(4.820),161(5.089)
M3 p0= 0.322, p1= 0.455, p2= 0.223
w0= 0,w1= 0.161,w2= 0.967
l= -5845.29 None
M7 p = 0.269, q = 0.741 l= -5850.23 Not allowed
M8 p0= 0.978, p = 0.311, q = 0.980
p1= 0.022,w= 2.461
Table 4 (cont.)
PRs Model Parameters1 l Sites showing indications of positive selection2
PR10 M0 w= 0.249 l= -3982.76 None
M1 p0= 0.143, p1= 0.857
w0= 0,w1= 1
l= -4022.14 Not allowed
M2 p0= 0.158, p1= 0.823, p2= 0.019
w0= 0,w1= 1,w2= 6.189
l= -4018.33 98(5.990)
M3 p0= 0.445, p1= 0.517, p2= 0.038
w0= 0.083,w1= 0.468,w2= 1.445
l= -3927.47 None
M7 p = 0.802, q = 1.632 l= -3926.73 Not allowed
M8 p0= 0.986, p = 0.877, q = 1.913
p1= 0.014,w= 1.879
l= -2838.15 None
PR12 M0 w= 0.161 l= -744.54 None
M1 p0= 0.725, p1= 0.275
w0= 0,w1= 1
l= -739.39 Not allowed
M2 p0= 0, p1= 0.129, p2= 0.871
w0= 0,w1= 1,w2= 0.060
l= -735.63 None
M3 p0= 0.268, p1= 0.602, p2= 0.131
w0= 0.059,w1= 0.059,w2= 0.989
l= -735.63 None
M7 p = 0.158, q = 0.738 l= -735.99 Not allowed
M8 p0= 0.992, p = 0.234, q = 1.276
p1= 0.008,w= 7.187
l= -733.88 None
PR13 M0 w= 0.392 l= -1519.56 None
M1 p0= 0.340, p1= 0.660
w0= 0,w1= 1
l= -1517.22 Not allowed
M2 p0= 0, p1= 0.292, p2= 0.708
w0= 0,w1= 1,w2= 0.183
l= -1508.83 None
M3 p0= 0.498, p1= 0.264, p2= 0.238
w0= 0.208,w1= 0.208,w2= 1.200
l= -1508.65 56(1.172),67(1.190),70(1.185),71(1.158),
78(1.157),118(1.178),137(1.196)
M7 p = 0.595, q = 0.831 l= -1510.31 Not allowed
M8 p0= 1, p = 0.595 , q = 0.831
p1= 0,w= 3.253
l= -1510.31 None
PR14 M0 w= 0.283 l= -2199.44 None
M1 p0= 0.338, p1= 0.663
w0= 0,w1= 1
l= -2171.57 Not allowed
M2 p0= 0.282, p1= 0.311, p2= 0.406
w0= 0,w1= 1,w2= 0.241
l= -2150.59 None
M3 p0= 0.503, p1= 0.191, p2= 0.306
w0= 0.046,w1= 0.676,w2= 0.676
l= -2148.94 None
M7 p = 0.330, q = 0.564 l= -2149.39 Not allowed
M8 p0= 0.545, p = 0.902 , q = 12.034
p1= 0.455,w= 0.708
l= -2148.85 None
PR15 M0 w= 0.066 l= -2510.46 None
M1 p0= 0.670, p1= 0.330
w0= 0,w1= 1
l= -2596.11 Not allowed
M2 p0= 0.433, p1= 0.013, p2= 0.554
w0= 0,w1= 1,w2= 0.106
l= -2494.91 None
M3 p0= 0.752, p1= 0.245, p2= 0.003
w0= 0.025,w1= 0.189,w2= 4.016
l= -2493.38 48(4.009)
M7 p = 0.454, q = 5.598 l= -2498.05 Not allowed
M8 p0= 0.997, p = 0.614, q = 8.438
p1= 0.003,w= 4.007
l= -2493.42 48(3.999)
1w
=dN/dS= average over sites; p0, p1and p2indicate the proportions of groups 0, 1 and 2 in each model, respectively;w0,w1andw2indicate thewvalues of
groups 0, 1 and 2 in each model, respectively. p and q are beta parameters.
2
ternative M8 with the constraint thatwshould be equal or greater than one. The significant results of these LRTs are shown in Table 5.
The LRT results (Table 5) indicate that all compari-sons for PR proteins 6, 8 and 9 were statistically significant and for PR15 in three comparisons. For PR1, PR4, PR10 and PR13 significance was achieved in the M1vs.M2 and M0vs.M3 comparisons only.
Let us briefly summarize the cases in which values of wsignificantly higher than one were obtained in at least two models. The highest values ofw~ 6 were obtained for PR6. Seventeen sites yielded posterior Bayesian probabilities for positive selection above 95% under the M3 model and two of them (25 and 84) gave confirmatory indications with model M2. Values ofwof about 3 in 5% of the sites were obtained for PR8 and sites 128, 131 and 248 yielded signifi-cant values under models M2, M3 and M8. A lowerw num-ber (~2.5 in 2% of the sites) was obtained for PR9. Two sites in this protein (45 and 161) showed indications of pos-itive selection in M2 and M8. For PR4 we found thatw~ 2 in 2% of the sites and site 99 showed significant numbers in
the M2, M3 and M8 models. A value ofw~ 4 was found for PR15 but only for site 48 with models M3 and M8.
It is important to observe that the M0vs.M3 compari-son is rather a test of variable selective pressure between sites than a test of positive selection (Anisimova et al. 2001,Wonget al.2004). However, in all cases in which this comparison showed significant values, additional indica-tions of positive selection were found in relation to other models.
Discussion
The evidence for positive selection at the molecular level is now overwhelming. Wolfe and Li (2003) list 16 genes or proteins related to defensive systems or immunity, 18 related to evading defensive systems or immunity, 12 re-lated to male reproduction, five rere-lated to female reproduc-tion and 22 which they placed in a miscellaneous category in which such type of selection was verified. To these we could add the results of Swanson and Aquadro (2002) on members of the antifreeze protein multigene family, of Rodríguez-Trelleset al. (2003) on the xanthine dehydro-genase gene and of Clark et al. (2003) on human-chimpanzee-mouse orthologous trios. In relation specifi-cally to innate immunity in plants and animals, Nürnberger and Brunner (2002) identified a series of parallels between the recognition of general elicitors and pathogen-associated molecular patterns.
The approach developed by Z. Yang and collabora-tors has been especially useful for these investigations. A general evaluation of the methods involved in the compari-son between synonymous and non-synonymous substitu-tion rates in protein-coding DNA sequences was made by Yang (2001). Details on the accuracy and power of Bayesan approaches to this problem were presented by Anisimovaet al. (2001, 2002) and Suzuki and Nei (2002, 2004), while Yang and Nielsen (2002) and Yang and Swanson (2002) explored additional questions regarding codon-substitution models.
The physiological significance of the results pre-sented in the present paper needs further investigation. Re-stricting our attention to the PR proteins in which clear indications of positive selection were found, we verify that PR proteins 4 and 8 are chitinases (although of different types: PR4 = types I, II; PR8 = type III), PR6 is a proteinase inhibitor, PR9 a peroxidase and PR15 an oxalate oxidase. Bishopet al.(2000) extensively discussed the molecular structures and patterns of amino acid replacements in chitinases I and III, concluding that they are basically dif-ferent, and that the unusual pattern of adaptive replace-ments in the active site cleft of chitinase I may be due to an arms race between the plant and inhibitors developed by the pathogenic species. We have identified a higher number of sites with indications of positive selection (w~ 3 in 5% of the sites) in PR8 (a chitinase III type protein) than in PR4
Table 5- Likelihood ratio statistics (2Dl) for some comparisons between pathogenesis-related (PR) proteins.
PR proteins Comparison 2Dl Probability values (p)
PR1 M1vs.M2 78.76 <<0.001
M0vs.M3 107.76 <<0.001
PR4 M1vs.M2 12.26 <0.01
M0vs.M3 185.97 <<0.001
PR6 M1vs.M2 16.70 <<0.001
M0vs.M3 68.55 <<0.001
M7vs.M8 12.09 <0.01
M8vs.M8a 7.82 <0.01
PR8 M1vs.M2 20.46 <<0.001
M0vs.M3 136.12 <<0.001
M7vs.M8 30.61 <<0.001
M8vs.M8a 22.78 <<0.001
PR9 M1vs.M2 26.67 <<0.001
M0vs.M3 425.68 <<0.001
M7vs.M8 13.96 <<0.001
M8vs.M8a 3.96 <0.05
PR10 M1vs.M2 7.62 <0.05
M0vs.M3 111.79 <<0.001
PR13 M1vs.M2 16.79 <<0.001
M0vs.M3 21.82 <<0.001
PR15 M1vs.M2 202.39 <<0.001
M0vs.M3 34.16 <<0.001
M7vs.M8 9.26 <0.01
1The degrees of freedom used comparing models M1vs.M2, M0vs.M3,
(w~ 2 in 2% of the sites) which includes both types I and II chitinases. Additionally, sites 128, 131 and 145 are close to one of the catalytic sites while site 279 is near an active site residue. In contrast, no indication of positive selection was found for PR3, also a chitinase.
PR6 is a proteinase inhibitor which directly acts against insects and other herbivores, micro-organisms and nematodes, positive selection at certain of its sites is there-fore not surprising.
The PR9 peroxidases probably function in strength-ening plant cell walls by catalyzing lignin deposition in re-action to microbial attack. Its sites 45 and 191 are located respectively between helix 2 and beta sheets, and in helix 13, near the active site of the peroxidase chain (Pfam Pro-tein Families Database; Batemanet al., 2002) and should be functionally important.
Oxalate oxidases influence different stages of the plant’s metabolism. Site 48 of PR15 may be significant in this regard, but structural data are needed to verify this pos-sibility.
The presence of positive selection is of course deter-mined by the role that a given protein has in the biology of a determined organism. Ongoing unpublished results of our group have detected the absence of positive selection in maturases, oleosins and auxins of several plant species and the presence of positive selection in glycoproteins belong-ing to four other plant species.
Acknowledgments
We thank Arndt von Haeseler for thoughtful com-ments on the manuscript. This work was supported by the Programa de Apoio a Núcleos de Excelência (PRONEX), Conselho Nacional de Desenvolvimento Científico e Tec-nológico (CNPq), Financiadora de Estudos e Projetos (FINEP), Coordenação de Aperfeiçoamento de Pessoal de Nível Superior (CAPES), Fundação de Amparo à Pesquisa do Estado do Rio Grande do Sul (FAPERGS) and Pró-Rei-toria de Pesquisa da Universidade Federal do Rio Grande do Sul (PROPESQ-UFRGS).
References
Altschul SF, Madden TL, Schäffer AA, Zhang J, Zhang Z, Miller W and Lipman DJ (1997) Gapped BLAST and PSI-BLAST: A new generation of protein database search programs. Nucl Ac Res 25:3389-3402.
Anisimova M, Bielawski JP and Yang Z (2001) Accuracy and power of the likelihood ratio test in detecting adaptive mo-lecular evolution. Mol Biol Evol 18:1585-1592.
Anisimova M, Bielawski JP and Yang Z (2002) Accuracy and power of Bayes prediction of amino acid sites under positive selection. Mol Biol Evol 19:950-958.
Bairoch A and Apweiler R (2000) The SWISS-PROT protein se-quence database and its supplement TrEMBL in 2000. Nucl Ac Res 28:45-48.
Bateman A, Birney E, Cerruti L, Durbin R, Etwiller L, Eddy SR, Griffiths-Jones S, Howe KL, Marshall M and Sonnhammer
ELC (2002) The Pfam Protein Families Database. Nucl Ac Res 30:276-280.
Bishop JG, Dean AM and Mitchell-Olds T (2000) Rapid evolu-tion in plant chitinases: Molecular targets of selecevolu-tion in plant-pathogen coevolution. Proc Natl Acad Sci USA 97:5322-5327.
Clark AG, Glanowski S, Nielsen R, Thomas PD, Kejariwal A, Todd MA, Tanenbaum DM, Civello D, Lu F, Murphy B, Ferreira S, Wang G, Zheng X, White TJ, Sninsky JJ, Adams MD and Cargill M (2003) Inferring nonneutral evolution from human-chimp-mouse orthologous gene trios. Science 302:1960-1963.
Etzold T and Argos P (1993) SRS - An indexing and retrieval tool for flat file data libraries. Comp Appl Biosc 9:49-57. Hasegawa M, Kishino H and Yano T (1985) Dating of the
hu-man-ape splitting by a molecular clock of mitochondrial DNA. J Mol Evol 22:160-174.
Jeanmougin F, Thompson JD, Gouy M, Higgins DG and Gibson TJ (1998) Multiple sequence alignment with Clustal X. Trends Biochem Sci 23:403-405.
Kimura M (1983) The neutral theory of molecular evolution. Cambridge University Press, Cambridge.
Nielsen R and Yang Z (1998) Likelihood models for detecting positively selected amino acid sites and applications to the HIV-1 envelope gene. Genetics 148:929-936.
Nürnberger T and Brunner F (2002) Innate immunity in plants and animals: Emerging parallels between the recognition of gen-eral elicitors and pathogen-associated molecular patterns. Curr Op Plant Biol 5:318-324.
Rodríguez-Trelles F, Tarrío R and Ayala FJ (2003) Convergent neo-functionalization by positive Darwinian selection after ancient recurrent duplications of the xanthine dehydro-genase gene. Proc Nat Acad Sci 100:13413-13417. Schmidt HA, Strimmer K, Vingron M and von Haeseler A (2002)
TREE-PUZZLE: Maximum likelihood phylogenetic analy-sis using quartets and parallel computing. Bioinformatics 18:502-504.
Suzuki Y and Nei M (2002) False-positive selection identified by ML-based methods: Examples from theSig1gene of the dia-tomThalassiosira weissflogii and thetaxgene of a human T-cell lymphotropic virus. Mol Biol.Evol 21:914-921. Suzuki Y and Nei M (2004) Simulation study of the reliability and
robustness of the statistical methods for detecting positive selection at single amino acid sites. Mol Biol Evol 19:1865-1869.
Swanson WJ and Aquadro CF (2002) Positive Darwinian selec-tion promotes heterogeneity among members of the anti-freeze protein multigene family. J Mol Evol 54:403-410. Thompson JD, Gibson TJ, Plewniak F, Jeanmougin F and Higgins
DG (1997) The Clustal X windows interface: Flexible strat-egies for multiple sequence alignment aided by quality anal-ysis tools. Nucl Ac Res 24:4876-4882.
Van Loon LC and van Strien EA (1999) The families of pathogenesis-related proteins, their activities, and compara-tive analysis of PR-1 type proteins. Physiol Mol Plant Pathol 55:85-97.
Wayne ML and Simonsen KL (1998) Statistical tests of neutrality in the age of weak selection. Tr Ecol Evol 13:236-240. Wolfe KH and Li W-H (2003) Molecular evolution meets the
Wong WSW, Yang Z, Goldman N and Nielsen R (2004) Accu-racy and power of statistical methods for detecting adaptive evolution in protein coding sequences and for identifying positively selected sites. Genetics 168:1041-1051.
Yang Z (1997) Phylogenetic Analysis by Maximum Likelihood (PAML), version 1.4. Department of Integrative Biology, University of California, Berkeley.
Yang Z (2001) Adaptive molecular evolution. In: Bishop M and Cannings C (eds) Handbook of Statistical Genetics. Wiley, New York, pp 327-350.
Yang Z and Nielsen R (2002) Codon-substitution models for de-tecting molecular adaptation at individual sites along spe-cific lineages. Mol Biol Evol 19:908-917.
Yang Z and Swanson WJ (2002) Codon-substitution models to detect adaptive evolution that account for heterogeneous se-lective pressures among site classes. Mol Biol Evol 19:49-57.
Yang Z, Nielsen R, Goldman N and Pedersen AMK (2000) Codon-substitution models for heterogeneous selection pressure at amino acid sites. Genetics 155:431-449.