Can genetic data help us understand a
major demographic event in human
prehistory?
Ana Rita Rodrigues Rasteiro de Campos
Dissertation presented to obtain the Ph.D degree in Biology
Instituto de Tecnologia Química e Biológica | Universidade Nova de Lisboa
Can genetic data help us understand
a major demographic event in human
prehistory?
Ana Rita Rodrigues Rasteiro de Campos
Dissertation presented to obtain the Ph.D degree in Biology
Instituto de Tecnologia Química e Biológica | Universidade Nova de Lisboa
Research work coordinated by:
The Neolithic transition is probably the most important cultural, eco-nomic and demographic revolution in human prehistory. It profoundly modified the distribution of human genes, languages and cultures world-wide. However, the study of the transition from hunting and gathering to farming societies has generated major controversies among archae-ologists and geneticists alike, with one side favouring demic diffusion models and the other the cultural diffusion models. As a first approxima-tion two alternative demographic scenarios can be considered. Under the cultural diffusion models the transition to agriculture is regarded es-sentially as a cultural phenomenon, involving the movement of ideas and practices, rather than people. In the demic diffusion models, a movement of people is involved. It can be shown that both models can be seen as special cases of an admixture model between Palae-olithic/Mesolithic and Neolithic populations. In this thesis, I used non-equilibrium and spatial admixture model approaches to help answer this long-standing controversy. I showed that demic diffusion models better explain the patterns of genetic diversity found in today’s European and Japanese populations, but I do not rule out the role of cultural processes locally.
i.e. that there was admixture between the two groups of humans. We used Y-chromosome data and an admixture approach to quantify the level of admixture across the Japanese archipelago. The method used, which accounts for genetic drift since the admixture event, clearly points to a demic diffusion process, similar to the process that was suggested for Europe also using Y-chromosome data.
In the second part of my thesis, we integrated Y-chromosome and mito-chondrial DNA (mtDNA) data into the same admixture approach to study the European Neolithic transition. We found that contrary to several statements claiming the opposite, both contemporary Y-chromosome and mtDNA data clearly favour a demic diffusion process, i.e. both males and females underwent the same admixture history. However, key differences in the female and male demographic histories were also identified, most likely related with sex-related differences in effec-tive size and migration patterns. Additionally, using an Approximate Bayesian Computation approach and one of the largest ancient DNA dataset available, we compared several demographic models with and without population structure and admixture. Our results show that demic diffusion is again favoured, but population structure and differential growth between farmers and hunter-gatherers are necessary to explain the pro-cess.
A transição Neolítica é provavelmente a revolução cultural, económica e demográfica mais importante da Pré-História Humana. Esta mudou profundamente a distribuição de genes, de linguagens e culturas no mundo. No entanto, o estudo da transição de sociedades caçadoras-recolectoras para sociedades agricultoras tem gerado muita polémica tanto entre geneticistas, como entre arqueólogos, com um lado favore-cendo modelos de difusão démica e o outro modelos de difusão cul-tural. Nos modelos de difusão cultural, a transição para a agricul-tura é vista essencialmente como um fenómeno culagricul-tural, que envolve o movimento de ideias e práticas, ao invés de pessoas. Pelo contrário, nos modelos de difusão démica, um movimento de pessoas está en-volvido. Ambos os modelos podem ser vistos como casos especiais de miscigenação/mistura entre populações do Paleolítico/Mesolítico e Neolítico. Nesta tese foram usados métodos aplicados a modelos de miscigenação, quer em situações de não-equilíbrio, quer distribuídos no espaço, para ajudar a responder a esta controvérsia. Os nossos resultados mostram que modelos de difusão démica explicam melhor os padrões de diversidade genética encontrados actualmente, em pop-ulações europeias e japonesas, mas ao mesmo tempo não descartam o papel de processos culturais locais.
nunca foi abordada do ponto de vista de miscigenação, ainda que este seja o único ponto em que a maioria dos estudos concorda, ou seja, que houve um processo de miscigenação entre os dois grupos de seres humanos. Usámos dados do cromossoma Y e uma abordagem de mis-cigenação para quantificar o nível de mistura em todo o arquipélago japonês. O método utilizado, que tem em conta a deriva genética desde o evento de mistura, aponta claramente para um processo de difusão démica, similar ao processo que foi sugerido para a Europa, também usando dados do cromossoma Y.
Na segunda parte desta tese, integrámos dados de ADN mitocondrial (ADNmt) e de cromossoma Y na mesma abordagem de miscigenação, para estudar a transição Neolítica europeia. Mostrámos que, ao con-trário de várias várias declarações afirmando o concon-trário, tanto os da-dos de cromossoma Y e como os de ADNmt contemporâneos favore-cem claramente um processo de difusão démica, ou seja, tanto homens como mulheres foram submetidos à mesma história de miscigenação. No entanto, diferenças importantes nas histórias demográficas femi-ninas e masculinas também foram identificadas, provavelmente rela-cionadas com diferenças sexuais no tamanho efectivo das populações e padrões de migração. Além disso, utilizando a abordagem “Approxi-mate Bayesian Computation” e um dos maiores conjunto de dados de ADN antigo disponível, foram comparados vários modelos demográ-ficos com e sem estrutura populacional e mistura. Estes resultados favorecem novamente a difusão démica, mas também apontam a ne-cessidade de introduzir estrutura populacional e crescimento diferen-cial, entre os agricultores e caçadores-recolectores, para explicar o pro-cesso.
es-ropeia. Dados arqueológicos e antropológicos sugerem que mudanças nas regras de residência pós-marital, entre homens e mulheres, ocor-reram como consequência do sedentarismo e de novas regras de con-trolo da terra pelos homens. Os nossos resultados mostram que a transição Neolítica deve ter deixado sua marca no genoma europeu e confirmam que a agricultura foi acompanhada por uma redução da mi-gração masculina e pelo movimento de mulheres para o local de nasci-mento do seu marido.
The completion of this thesis would not have been possible without the help and encouragement of many people. Their support has taken many forms, and I want to show here my deepest gratitude to them.
Lounès Chikhi was both the instigator and the supervisor of the research presented in this thesis. The quality of my work owes much to his dynamic and motivating leadership at its high competence and scientific rigor. I also thanks for the friendship he has shown in me during these years.
Instituto Gulbenkian de Ciência (IGC) and Instituto de Tecnologia Química e Biológica (ITQB) for providing me a platform for my PhD work.
Isabel Gordo and Élio Sucena, who kindly have agreed to be members of my thesis committee.
Giorgio Bertorelle, António Amorim, Nuno Ferrand and Gabriela Gomes for agreeing to be part of my PhD defense jury.
The IT services of IGC for showing a great willingness to help me solve the computer problems I encountered during my work.
Comput-Vítor Sousa for introducing me to the wonderful world of R and High Performance Computing. Thank you for all the help and for our many discussions.
Bárbara Parreira for all the discussions, especially when the Pop-ulation and Conservation Genetics Group (PCG) was composed with just both of us, Vítor and Lounès.
To Pierre-Antoine Bouttier and Damien Mounier, INSA (Toulouse) students, who worked alongside us in the development of SINS.
To all members of PCG, past and current, for making possible to work on a pleasant, motivating and dynamic group. João, Isabel, Jordi, Cristina, Isa, Célia, Sam, Cécile, Fabrice, among others.
Special thanks to Reeta Sharma, for all the discussions, kindness and friendship.
List of Figures ix
List of Tables xiii
List of Algorithms xv
1 General Introduction 1
1.1 The use of genetic data to characterize human populations . . . 1
1.2 Neolithic transition . . . 3
1.3 Inference of Human Past Demography . . . 6
1.3.1 Admixture models . . . 8
1.3.1.1 Thus, how can one go about detecting admixture? . 9 1.3.2 Spatial models . . . 11
1.4 Aims . . . 14
1.5 References . . . 15
2.2 Introduction . . . 24
2.3 Material and Methods . . . 27
2.3.1 Populations used . . . 27
2.3.2 The Admixture Model . . . 28
2.3.3 Choice of parental populations . . . 28
2.3.4 Calculating Drift . . . 30
2.3.5 Spatial variation of admixture: regression analysis . . . 30
2.3.6 FSTanalysis . . . 31
2.4 Results . . . 31
2.4.1 Admixture proportions . . . 31
2.4.2 Drift . . . 35
2.4.3 FST . . . 37
2.5 Discussion . . . 39
2.5.1 Dual origins of Japanese . . . 39
2.5.2 The continental origin of the Yayoi farmers . . . 40
2.6 References . . . 42
3 Admixture in Europe 47 3.1 Abstract . . . 47
3.2 Introduction . . . 48
3.3 Material and Methods . . . 51
3.3.1 Estimating admixture between Palaeolithic HG and Neolithic farmers using extant genetic data . . . 51
3.3.1.2 Populations used . . . 52
3.3.1.3 Choice of Parental Populations . . . 53
3.3.1.4 Validation of the admixture analysis with negative controls . . . 53
3.3.1.5 Regression Analysis . . . 54
3.3.1.6 FST analysis . . . 55
3.3.2 aDNA and Coalescent Analysis . . . 55
3.3.2.1 Populations’ datasets . . . 55
3.3.2.2 Demographic Models: testing for the continuity and discontinuity hypotheses . . . 55
3.3.2.3 Distribution of pairwise FST values across models and validation of our simulation approach . . . 57
3.3.2.4 Approximate Bayesian Computations (ABC) for model choice and parameter estimation . . . 58
3.4 Results . . . 62
3.4.1 Admixture analyses: The Neolithic contribution decreases with distance from the Near-East, for both NRY and mtDNA data . 62 3.4.2 The Neolithic transition in the Caucasus and European is-lands: NRY admixture analyses . . . 62
3.4.3 Drift in paternal and maternal lineages: NRY and mtDNA data support the DDM but not the same demographic histories . . 63
3.4.4 Ancient DNA, coalescent simulations and model identification using ABC . . . 66
3.5.1 Both contemporary NRY and mtDNA data support DDM, but tell different demographic histories . . . 69
3.5.2 aDNA supports Demic Diffusion . . . 72
3.5.3 Towards an integrated model of Neolithic transition . . . 73
3.6 Conclusion . . . 76
3.7 References . . . 77
4 Sex-biased migration in the Neolithic 85
4.1 Summary . . . 86
4.2 Introduction . . . 87
4.3 Material and Methods . . . 89
4.3.1 General Framework . . . 89
4.3.2 Neolithic transition model . . . 91
4.3.3 Variable parameters: sex-biased migration and admixture . . 92
4.3.4 Fixed Parameters . . . 93
4.3.5 Summary statistics . . . 93
4.4 Results . . . 94
4.4.1 General results across all scenarios . . . 94
4.4.2 No admixture scenarios . . . 95
4.4.3 Influence of HG postmarital behaviour on the Farmers genetic diversity . . . 97
4.4.4 Influence of HG postmarital behaviour on the Farmers genetic differentiation . . . 100
4.5.1 Main results: (i) first farmers were patrilocal and (ii) different postmarital residence systems have a different impact on hu-man genetic patterns . . . 100
4.5.2 Behaviour of summary statistics . . . 101
4.5.3 Mutation rates can generate asymmetries between mtDNA and NRY data . . . 102
4.5.4 Admixture decreases Farmers NRY genetic diversity . . . 102
4.5.5 Comparison with other sex-biased migration studies . . . 103
4.6 Conclusion . . . 104
4.7 References . . . 104
5 SINS: Simulating INdividuals in Space 111
5.1 Summary . . . 111
5.2 Introduction . . . 112
5.3 Methods . . . 112
5.3.1 Demography . . . 112
5.3.2 Genetics . . . 114
5.3.3 Outputs and Summary Statistics . . . 114
5.4 Implementation . . . 115
5.5 Discussion . . . 115
5.6 References . . . 116
6 General Discussion 117
6.1 Neolithic transition in Japan and Europe . . . 117
6.3 Perspectives . . . 121
6.3.0.1 SINS’ new features . . . 121
6.3.0.2 SINS’ in an ABC framework . . . 122
6.4 Conclusion . . . 123
6.5 References . . . 124
A Appendix: Admixture in Europe 127
A.1 Supplementary Tables . . . 127
A.2 Supplementary Figures . . . 129
B Appendix: Neolithic transition in the Iberian Peninsula 135
C Appendix: Sex-biased migration in the Neolithic 149
C.1 Details on the simulation framework . . . 149
C.1.1 Carrying Capacity and Friction . . . 149
C.1.2 Admixture . . . 149
C.1.3 Logistic growth . . . 150
C.1.4 Short range migrations . . . 151
C.2 Simulation framework algorithm . . . 152
C.3 Mutation rates . . . 154
C.4 Validation of the method . . . 154
C.5 Supplementary Tables . . . 155
C.6 Supplementary Figures . . . 158
D.1 General Introduction . . . 171
D.2 Demographic model . . . 172
D.2.1 Logistic Growth . . . 172
D.2.2 Migration . . . 173
D.2.2.1 Number of migrants . . . 173
D.2.2.2 Sex-biased migration . . . 174
D.2.3 Interaction between layers . . . 174
D.2.3.1 Competition . . . 174
D.2.3.2 Admixture . . . 175
D.3 Genetic Model . . . 175
D.3.1 Reproduction . . . 176
D.3.2 Mutation model . . . 176
D.4 SINS organization and Settings . . . 177
D.4.1 SINS Inputs . . . 178
D.4.1.1 World and output files . . . 179
D.4.1.2 Environment folder . . . 183
D.4.1.3 Genetic Folder . . . 183
D.4.1.4 Layer parameters folder . . . 186
D.4.2 SINS Outputs . . . 187
D.4.2.1 Demographic output . . . 187
D.4.2.2 Genetic output . . . 188
D.5 SINS-stat: sampling and genetic analysis . . . 190
D.5.2 SINS-stats summary statistics and outputs . . . 192
D.6 SINS and SINS-stat Implementation and Installation . . . 193
D.7 Running SINS and SINS-stat . . . 194
E References to Appendices 195
1.1 SE-NW gradients in Europe . . . 2
1.2 Neolithic transition . . . 4
1.3 Cultural and Demic diffusion models . . . 5
1.4 Demographic models used in Population Genetics . . . 8
1.5 Neolithic contribution across Europe . . . 10
1.6 Admixture model . . . 11
2.1 Map of the Japanese Islands . . . 25
2.2 Jomon contribution, across Japan . . . 33
2.3 Jomon and Yayoi contributions, across Japan . . . 34
2.4 Spatial variation of admixture and drift . . . 35
2.5 Distributions of theti’s for all Japanese populations . . . 36
2.6 Population differentiation with Ainu and Okinawa populations . . . . 38
3.1 Spatial variation of admixture and drift, across Europe . . . 60
3.2 Genetic diversity across Europe . . . 64
3.4 Demographic models used in the aDNA analysis and their posterior probabilities . . . 66
3.5 Probability of obtaining genetic differentiation values close to the ob-served in the real data . . . 69
4.1 Model of spatial expansion . . . 90
4.2 Genetic diversity and differentiation in modern populations, under no admixture . . . 95
4.3 Genetic diversity in present-day Farmers, under admixture . . . 98
A.1 Split with differential growth model (SDG) . . . 129
A.2 Palaeolithic contribution to modern European (p1) posterior distribu-tions . . . 130
A.3 Linear regression of Neolithic contribution (1 − p1), against
geo-graphical distance from the Near East, using NRY data . . . 131
A.4 Caucasus and European Islands: linear regression of Neolithic con-tribution (1−p1), against geographical distance from the Near East, using NRY data . . . 132
A.5 Distributions of theti’s for all populations, using NRY . . . 133
A.6 Distributions of theti’s for all populations, using mtDNA . . . 134
C.1 Genetic diversity under admixture scenarios . . . 158
C.2 Genetic diversity in a 30×30 lattice, for patrilocalFarmersunder ad-mixture scenarios . . . 160
C.3 Genetic differentiation in present-day populations under admixture scenarios . . . 162
C.5 Genetic differentiation in a 30×30 lattice, for patrilocalFarmersunder admixture scenarios . . . 166
C.6 Framework validation . . . 168
C.7 Genetic diversity and differentiation in the no admixture scenarios, with a sampling scheme . . . 169
D.1 SINS organization . . . 177
D.2 Inputs and outputs of SINS . . . 178
D.3 Input files and folders . . . 179
D.4 Example of a world.txt file, for a one-layer scenario . . . 181
D.5 Example of a world.txt file, for a two-layer scenario . . . 182
D.6 Example of an output.txt . . . 183
D.7 Example of a genotype.txt file . . . 185
D.8 Allele files . . . 185
D.9 Example of a <name of layer>.txt . . . 186
D.10 Output folders and files generated by SINS . . . 188
D.11 Demography output . . . 189
D.12 Genetic output . . . 189
D.13 SINS-stat . . . 190
D.14 SINS-stat input folders and files . . . 191
D.15 Layout of sampling<g>.txt . . . 192
2.1 Spatial variation of admixture and drift . . . 32
2.2 Population differentiation in Japan . . . 39
3.1 Demographic parameters estimated under the Split with Differential
Growth (SDG) model . . . 68
3.2 Probability of simulated FST values being higher than observed ones 68
A.1 Validation of the ABC model selection procedure . . . 127
A.2 Neolithic archaeological sites dates . . . 128
C.1 Sex ratio migration parameters . . . 155
C.2 Expected Heterozygosity among European populations. . . 156
C.1 Simulation framework algorithm . . . 153
1.1
The use of genetic data to characterize human
popu-lations
The study of human variation has a long and controversial history. During centuries, human variation was classified only by phenotypic traits and was the root of social inequalities among different populations [Marks, 2007].
At the turn of the 20thcentury, the immunological characterization of the ABO blood group system and its mode of inheritance provided the first genetic marker to mea-sure human variation. However, it was at the end of World War I that the first study in human population genetics came about. Hirschfeld and Hirschfeld [1919] analysed blood samples from soldiers and locals assembled in the Macedonian front and demonstrated that there was variability in the frequency of the ABO blood groups, in the so-called ‘racial groups’. Other blood groups systems were discov-ered and the same type of results were found [Boyd, 1950; Mourant, 1949]. Later, in the 1950s, it was already possible to ascertain the degree of population genetic variation in the serum proteins [Connell & Smithies, 1959; Smithies, 1959].
Figure 1.1: SE-NW gradients in Europe - Synthetic map of the first principal com-ponent of variation found by Cavalli-Sforza and colleagues [1994]). For the authors, this genetic cline represents the spread of agriculture from the Near East, during the Neolithic transition.
between populations are investigated simultaneously, they often correspond to pop-ulation migrations due to, for example, new sources of food, improved transporta-tion, or shifts in political power. In fact, the genetic clines found in Europe can be connected to the demographic past of the European populations, based on archae-ological and linguistic data [Cavalli-Sforzaet al., 1994]. Thus, human variation can be seen as continuous, as opposite to discrete, and is not compatible with racial classifications [Marks, 2007]. It was in this context that archaeogenetics emerged. Having been coined independently by Colin Renfrew [2001] and António Amorim [1999], it refers to the application of techniques of molecular population genetics to the study of the human past.
are gradually being used to reconstruct the demographic history and prehistory of human populations. Studies using mitochondrial DNA (mtDNA) and the non-recombining portion of the Y-chromosome (NRY) are particularly useful for genetic anthropology and archaeogenetics. Both mtDNA and NRY are inherited almost un-altered by the female and male lineages, respectively and are thus good markers to study sex-biased processes in human evolution [Wilkins, 2006; Wilkins & Marlowe, 2006].
However, how much information can genetic data really give us? It is in this context that this thesis is integrated with special emphasis for a specific human demo-graphic event: the Neolithic transition.
1.2
Neolithic transition
The development and spread of farming, referred to as the ‘Neolithic transition’ is one of the major demographic events of human prehistory. Gordon Childe [1936] named it Neolithic ‘Revolution’ and is considered by Mithen [2007] as the ‘defining event of human history’. The several transformations that occurred during this pe-riod: either social, demographic, economic, cultural or nutritional, were linked to a new way of life mostly based on food production and sedendism. This transition took place independently in different regions of the planet (Fig. 1.2), over a few
mil-lenia, and led to the domestication of many plants and animals [Abboet al., 2006;
Tresset & Vigne, 2011]. The shift from hunter-gathering to farming economies co-incide with an increase of archaeological data in the Near East [Bocquet-Appel, 2009, 2011; Gkiasta et al., 2003] and in other parts of the world [Bellwod & Oxen-ham, 2008]. This suggest a major demographic growth after this period [Bellwood, 2004; Price, 2000], that was named by Bocquet-Appel [2002] as ‘Neolithic Demo-graphic Transition’.
Figure 1.2: Neolithic transition - Different independent points of origin, in specific climatic and geographical contexts (adapted from Diamond and Bellwood [2003]).
want to understand how agriculture was adopted by human groups, clearly, a global approach should be taken and genetic data should be analysed using similar ap-proaches in different regions.
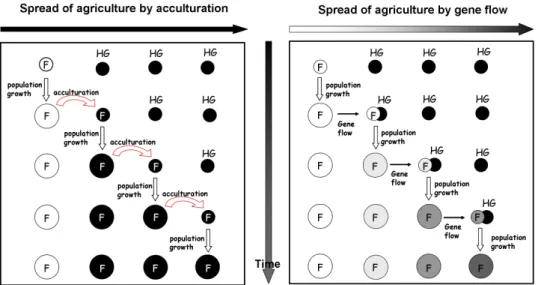
As a first approximation, it is possible to consider two alternative demographic sce-narios to explain the spread of farming technologies: the cultural (CDM) or the demic (DDM) diffusion models (see Fig. 1.3). Under the CDM the transition to agri-culture is regarded essentially as a cultural phenomenon, involving the movement of ideas and practices rather than people [Zvelebil & Zvelebil, 1998]. It is expected that the genetic impact of the neighbouring farmers on the local hunter-gatherers (HG) will be thus limited. In the DDM, a movement of people is involved, and the transmission of agriculture technologies is mostly due to a significant arrival of new people [Ammerman & Cavalli-Sforza, 1984].
particu-Figure 1.3: Cultural and Demic diffusion models- Two different models to explain the spread of agriculture. The CDM (on the left) assumes that the transmission of the farming technologies occurred by an acculturation process, whereas the DDM (on the right) assumes that a movement of individuals was involved and thus a movement of genes. In the CDM, the genetic makeup of present-today populations is expected to be similar to that of the Palaeolithic/Mesolithic HGs, whereas in the DDM, if admixture between populations occurred, it is a "mix" between HGs and farmers. Furthermore, in the DDM it is expected that through successive admixture events, the "Neolithic gene pool" would have suffered a dilution effect since the point of origin and along the axis of expansion (adapted from Jobling and colleagues [2003]).
lar, many studies found very strong correlations between genetic and archaeologi-cal maps representing the earliest dates of arrival of agriculture in Europe [Menozzi
et al., 1978] or between genetic and linguistic data across different regions
[Bar-bujani & Pilastro, 1993]. However, some authors argued, based on mtDNA data, that the contribution of the early Palaeolithic or Mesolithic HGs was more important
than previously thought [Richards, 2003; Richards et al., 1996, 2000, 2002]. The
of populations and that model-based approaches should be used to infer demo-graphic parameters [Barbujani & Chikhi, 2006; Barbujaniet al., 1995; Chikhi, 2009; Chikhiet al., 2002].
Despite the increasing amount of available data, and the numerous studies that have been published in the last decade, a very heated debate between the defend-ers of the CDM and DDM models was still taking place at the time of start of this thesis [Barbujani et al., 1998; Chikhi et al., 1998, 2002; Dupanloup et al., 2004; Richards, 2003; Richardset al., 2000; Seminoet al., 2000]. This clearly suggested that more work was needed to improve our understanding on the processes that took place during the Neolithic transition in different regions of the world. One of the reasons that have led to some controversy is the disagreement revolving around the manner in which genetic data should be analysed. It seemed that any method used to analyse the genetic data should be demonstrated to work on data for which the history is known with certainty. In other words, it should first be applied with suc-cess to simulated data. Unfortunately, the methods that have been most used in the literature are based on the interpretation of networks of DNA sequences [Bandelt
et al., 1999]. However, despite a very widespread use, these methods have never
been tested on simulated data sets. There is no demonstration, so far, that these network-based methods actually provide reliable inference when they are applied to real data, for which we do not know the history. This is why, in this thesis, I favoured model-based approaches, which have the advantages of explicitly stating the assumptions used to make inference, and of being testable using simulated data [Beaumontet al., 2010].
1.3
Inference of Human Past Demography using
model-based approaches
neighbour-ing populations. Moreover, real populations are not panmitic. In humans, panmixia could only be achieved if marriages were completely random, independently of ge-ographic boundaries, beliefs, languages, ethnies and social classes. And even then people would choose with whom to mate.
Genetic studies have consistently found differences between human populations [Cavalli-Sforza et al., 1994; Rosenberget al., 2002] and their actual structure and history is very complex. Therefore, genetic data can help us to infer parameters
values for simple [Beaumont et al., 2002] or more complex demographic models
[Fagundes et al., 2007]. This is called a parameter-based inference, where
pa-rameters are estimated and hypotheses tested to study the distribution of genetic diversity and variation.
The first step for demographic inference is to choose the demographic model(s), which could explain the patterns of genetic diversity that we see in today’s tions. As it is clearly impossible to model the full biological complexity of popula-tion demography, one should look for the simplest model that captures the relevant features of the known demography of the population. Population Genetics uses several types of demographic models that try to capture the demography of pop-ulations and that represent deviations to the Wright-Fisher model (see Fig. 1.4). However, the effects such complications have on population genetic inference, how such deviations can be detected and how it may be possible to estimate some of the important parameters relating to the demographic models are some of the main questions when using demographic inference.
Of course, any real population may well have experienced several of these
demo-graphic complexities and to model them we needa priori knowledge of the
demog-raphy of the populations. In the case of human populations, to build our models we use several fonts of information like archaeology, linguistics, anthropology or genet-ics.
time
time time
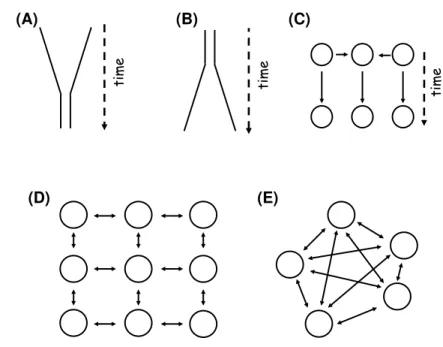
(A) (B) (C)
(D) (E)
Figure 1.4: Demographic models used in Population Genetics -(A) Bottleneck, (B)expansion and(C)admixture represent some of the non-equilibrium models used in Population Genetics. Population structure can also be modelled, with or without the dimension space integrated, like the(D)2D stepping-stone(E)or the island models, respectively. In the 2D stepping-stone model [Kimura & Weiss, 1964], individuals from one deme can only migrate to their neighbours, in the four cardinal directions, while in the island model [Wright, 1931] they are able to migrate in any direction.
1.3.1 Admixture models
to-gether and create an hybrid population and that modern populations are the result of this event.
It has been shown that the CDM and DDM can been seen as as extreme cases of an admixture model, whereby two or more parental populations mixed in the past to produce the hybrid ancestors of present-day populations [Chikhiet al., 2002; Currat & Excoffier, 2005]. Thus, in extreme cases of admixture, with no genetic contribu-tion of one of the parental populacontribu-tions (see Fig. 1.6), we would expect that the gene pool of present-day populations is similar to the Mesolithic HGs, in the case of CDM, or to the Neolithic farmers, in the case of DDM. However, it was also shown that the genetic consequences of CDM and DDM models are more complex than is usually believed particularly when spatial processes are considered [Chikhi et al., 2002; Currat & Excoffier, 2005] (see Fig. 1.3 and 1.5). For instance, if we consider a process where the first farmers arrive to a new land, admix with the indigenous populations (HGs) and, as a result, raise the carrying capacity of that same area, due to new ways of exploring the land and food resources. Consequently, the size of the newly admixed population increases until the carrying capacity is reached, forcing part of the individuals to move and repeat the admixture process. This pro-cess would lead to a dilution of the "Neolithic genes", through the axis of expansion and was described for the European Neolithic transition by Chikhiet al.[2002] (see Fig. 1.5).
1.3.1.1 Thus, how can one go about detecting admixture?
In 1931, Bernstein (see [Bertorelle & Excoffier, 1998]) was the first to describe how genetic data could be used to estimate the contribution of two parental populations to a hybrid one. Traditionally, over the last 60 years, the estimation of the degree of admixture relied on the comparison of allele frequencies of each parental and hybrid populations [Chakraborty & Weiss, 1986, 1988; Long, 1991].
Recently, several methods were developed that differ either on the type of informa-tion available for the putative parental populainforma-tions or on the assumpinforma-tions related to
the time of admixture. On on hand,For example, if there is no a priori choice for
Figure 1.5: Neolithic contribution across Europe- In 2002, Chikhi and colleagues analysed a large published Y-chromosome dataset [Seminoet al., 2000], using an ad-mixture approach (see Fig. 1.6) described in chapters 2 and 3. Their results revealed a significantly larger genetic contribution from Neolithic farmers than did previous in-direct approaches based on the distribution of haplotypes. In this figure (taken from Chikhi and colleagues [2002]) is represented the linear regression of Neolithic contri-bution (1-p1) against the geographic distance from the Near East, where they detected a significant decrease in admixture across the entire range between the Near East and Western Europe, supporting the DDM.
algorithms can be used to group similar classes of individuals within a population and identify individuals that are admixed [Pritchardet al., 2000]. In contrast, if there is information from putative source populations, even old admixture events can be detected and the relative contribution of source populations estimated [Chikhiet al.,
2001; Sousaet al., 2009; Wang, 2003]. Hence, admixture can be estimated by
in-corporating information on the molecular diversity present in the admixed and in parental populations [Bertorelle & Excoffier, 1998; Dupanloup & Bertorelle, 2001] and also by explicitly taking into account the genetic drift of allele frequencies since the admixture event [Chikhiet al., 2001; Sousaet al., 2009; Wang, 2003].
P
1P
hP
2Present
T
t1 = T/N1 th = T/Nh t2 = T/N2
p1 1 - p1
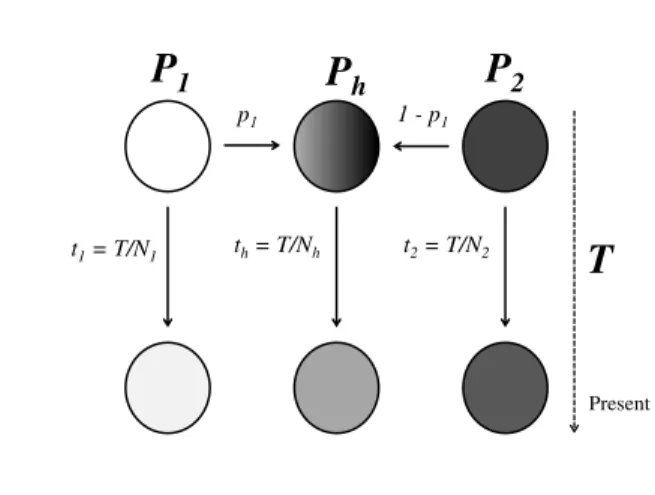
Figure 1.6: Admixture model- In this model, two populations join together sometime in the past to create an hybrid population. After the admixture event, the three popula-tions evolve independently under pure genetic drift, with no mutation, no selection and no migration involved. This is the model used by the Chikhiet al. [2001] method.
contribution of each parental population in single admixture event scenarios,
includ-ing Bayesian [Chikhi et al., 2001] (see Fig. 1.6) and maximum-likelihood [Wang,
2003] methods. While these approaches are computationally intensive, they have been shown to produce good estimates with smaller variances across independent simulations [Chikhi et al., 2001; Choisy et al., 2004; Wang, 2003]. More recently, a new Approximate Bayesian Computation (ABC) approach was developed to
esti-mate admixture parameters [Bray et al., 2010; Sousaet al., 2009]. This method is
considerable faster than the others and is able to model more complex scenarios, like with one or two admixture events and with two or three parental populations.
1.3.2 Spatial models
stepping-stone model [Kimura & Weiss, 1964], where demes can only change indi-viduals with their neighbours.
Recently, several studies have used this kind of models coupled with geographic information to study the consequences of spatial range expansions on genetic di-versity. Some studies used one-dimensional (1D) stepping-stone modelling, i.e. individuals can only migrate in two directions, to simulate the colonization of the world through a serial founder effect [Deshpandeet al., 2009; Estoupet al., 2004; Liuet al., 2006; Prugnolleet al., 2005; Ramachandranet al., 2005].
Other methods were developed, not only to study the consequence range ex-pansions, but also the consequence of the interaction between different cultural groups (like admixture) on genetic diversity. These methods use a more realistic geographic modelling approach, the two-dimensional (2D) stepping-stone model,
where individuals can migrate in the four cardinal directions. Itan et al. [2009]
applied this model to study of lactase persistence in Europe and found an asso-ciation between the lactase persistence expansion and the dissemination of the Neolithic culture in Central Europe. In this work, they modelled space using one layer (i.e. one 2D stepping-stone lattice), where each deme had associated differ-ent cultural groups (HG and dairying farmers) that could interact and have differdiffer-ent demographic parameters associated to them.
A similar, yet different approach, was developed the by Laurent Excoffier lab and
is partially incorporated in SPLATCHE [Currat et al., 2004], recently upgraded to
SPLATCHE2 [Rayet al., 2010]. Contrary to the Itan et al. [2009] study, each
cul-tural group is associated with a layer (i.e. a different 2D stepping-stone lattice). In turn, each layer can have different demographic parameters and different layers can interact either by admixture or competition. In addition, environmental infor-mation obtained from Geographical Inforinfor-mation Systems (GIS) can be added to constrain migration and deme densities. They applied this framework to several questions on human evolution, like the colonization of the world by early modern
humans [Rayet al., 2005] and to the Neanderthal and the modern humans
to study: i) gender-related asymmetries on gene flow [Hamiltonet al., 2005b]; ii) re-cent migration rates estimates after a spatial expansion [Hamiltonet al., 2005a]; iii) intra-deme molecular diversity in expanding populations [Ray et al., 2003]; iv) the fate of mutations that are on the edge of a range expansion, commonly know as "surfing" phenomenon [Klopfstein et al., 2006] and recently, v) the importance of the Gibraltar Strait on the Iberian peninsula [Currat et al., 2010]. Finally, as one of the most important issues on human evolution, the Neolithic transition was also ad-dressed by using this approach in Currat et al. [2005]. In this study, they estimate the contribution of HG and farmer populations to the genetic diversity of modern Europeans. Their results show that even a very limited HG contribution can lead to situations where the current human European gene pool could be traced to the Palaeolithic. The Neolithic contribution was also found to decrease very quickly along the axis of colonization, from the Neolithic point of origin. In fact, the allele frequency clines often found after a range expansion [Barbujaniet al., 1995; Chikhi et al., 2002; Currat & Excoffier, 2005; Hallatschek & Nelson, 2008; Klopfsteinet al.,
2006; Liu et al., 2006; Long, 1991] can be explained by demographic events like
"surfing" phenomena [Edmonds et al., 2004; Hallatschek & Nelson, 2008;
Klopf-stein et al., 2006; Long, 1991]. Surfing describes the geographic spread of an
allele that rides on the front of the wave of advance of a spatial expansion and is favoured when populations at the wave front grow rapidly and exchange genes with their neighbours [Hallatschek & Nelson, 2008]. Regarding the Neolithic transition, surfing alleles can explain the "dilution" of the Neolithic lineages along the axis of expansion (see also section 1.3.1).
All the frameworks presented above use coalescent theory to generate the genetic diversity of the populations. Thus, the whole population does not need to be simu-lated. While this has several advantages in efficiency and computing time, as only the sampled genealogies are simulated, there are some disadvantages as well. For example, with this kind of approach more complex scenarios that take into account certain aspects of cultural practices, like sex-biased migration, cannot be model.
In addition, at the time of start of this thesis, SPLATCHE2 [Ray et al., 2010] was
groups, in our case HG and farmers. This is why we developed and tested a new simulation framework, based on forward simulations, that enable us to model differ-ent cultural groups and to address more realistic scenarios in human populations (see chapters 4 and 5).
1.4
Aims
Despite the progress made in the last decade, both in terms of the increasing num-ber of datasets, and the new model-based approaches that have been developed, (i) the debate between the two opposite models (CDM and DDM), is still going on and (ii) more work is needed to model the Neolithic transition in different regions of the world. Thus the work presented here aims to:
• Study the spread of farming using genetic data, taking into account anthropo-logical, linguistic and archaeological data
• Model the consequence of admixture between the Palaeolithic populations and the Neolithic ones, using contemporary and ancient DNA.
• Use model-based approaches to infer if the processes that can be inferred in Europe are also found in other regions of the world.
• Ascertain if different patterns of genetic differentiation and diversity are en-countered between present-day mtDNA and Y-chromosome data. Infer if these differences are due to different demographic histories for both females and males.
The results of the analysis of Chapter 3 led us to believe that there were differ-ences between the demographics histories of females and males. Chapters 4 and 5 explore the development and application to the European Neolithic of a spatial expansion simulation framework that allows the study of sex-biased processes.
1.5
References
ABBO, S., GOPHER, A., PELEG, Z., SARANGA, Y., FAHIMA, T., SALAMINI, F. & LEV-YADUN, S. (2006). The ripples of "the Big (agricultural) Bang": the spread of early wheat cultivation.Genome,49, 861–3.
AMMERMAN, A.J. & CAVALLI-SFORZA, L.L. (1984).The Neolithic transition and the
genet-ics of populations in Europe. Princeton University Press, Princeton.
AMORIM, A. (1999). Archaeogenetics.Journal of Iberian Archaeology,1, 15–25.
BANDELT, H.J., FORSTER, P. & ROHL, A. (1999). Median-joining networks for inferring intraspecific phylogenies.Mol Biol Evol,16, 37–48.
BARBUJANI, G. & CHIKHI, L. (2006). Population genetics: DNAs from the European Ne-olithic.Heredity,97, 84–85.
BARBUJANI, G. & PILASTRO, A. (1993). Genetic evidence on origin and dispersal of human populations speaking languages of the Nostratic macrofamily.Proc Natl Acad Sci U S A, 90, 4670–3.
BARBUJANI, G., SOKAL, R.R. & ODEN, N.L. (1995). Indo-European origins: a computer-simulation test of five hypotheses.Am J Phys Anthropol,96, 109–32.
BARBUJANI, G., BERTORELLE, G. & CHIKHI, L. (1998). Evidence for Paleolithic and Ne-olithic gene flow in Europe.Am J Hum Genet,62, 488–492.
BEAUMONT, M.A., ZHANG, W. & BALDING, D.J. (2002). Approximate Bayesian Computa-tion in populaComputa-tion genetics.Genetics,162, 2025–35.
BEAUMONT, M.A., NIELSEN, R., ROBERT, C., HEY, J., GAGGIOTTI, O., KNOWLES, L., ESTOUP, A., PANCHAL, M., CORANDER, J., HICKERSON, M., SISSON, S.A., FAGUNDES, N., CHIKHI, L., BEERLI, P., VITALIS, R., CORNUET, J.M., HUELSENBECK, J., FOLL, M., YANG, Z., ROUSSET, F., BALDING, D. & EXCOFFIER, L. (2010). In defence of model-based inference in phylogeography.Mol Ecol,19, 436–446.
BELLE, E.M.S. & BARBUJANI, G. (2007). Worldwide analysis of multiple microsatellites: language diversity has a detectable influence on DNA diversity.Am J Phys Anthropol, 133, 1137–46.
the Neolithic Demographic Transition, 13–34. Springer.
BELLWOOD, P. (2004).First Farmers: the origins of agricultural societies. Blackwell Pub-lishing, Oxford.
BERTORELLE, G. & EXCOFFIER, L. (1998). Inferring admixture proportions from molecular data.Mol Biol Evol,15, 1298–1311.
BOCQUET-APPEL, J.P. (2002). Paleoanthropological traces of a Neolithic demographic tran-sition.Curr Anthropol,43, 637–650.
BOCQUET-APPEL, J.P. (2009). The demographic impact of the agricultural system in human history.Curr Anthropol,50, 657–660.
BOCQUET-APPEL, J.P. (2011). When the world’s population took off: the springboard of the Neolithic Demographic Transition.Science,333, 560–561.
BOYD, W.C. (1950). Use of blood groups in human classification.Science,112, 187–96. BRAY, T., SOUSA, V., PARREIRA, B., BRUFORD, M. & CHIKHI, L. (2010). 2BAD an
applica-tion to estimate the parental contribuapplica-tions during two independent admixture events.Mol
Ecol Resour,10, 538–541.
CAPELLI, C., REDHEAD, N., ABERNETHY, J.K., GRATRIX, F., WILSON, J.F., MOEN, T., HERVIG, T., RICHARDS, M., STUMPF, M.P.H., UNDERHILL, P.A., BRADSHAW, P., SHAHA, A., THOMAS, M.G., BRADMAN, N. & GOLDSTEIN, D.B. (2003). A Y chromo-some census of the British Isles.Curr Biol,13, 979–84.
CARVAJAL-CARMONA, L.G., SOTO, I.D., PINEDA, N., ORTÍZ-BARRIENTOS, D., DUQUE, C., OSPINA-DUQUE, J., MONTOYA, M.M.P., ALVAREZ, V.M., BEDOYA, G. & RUIZ-LINARES, A. (2000). Strong Amerind/White sex bias and a possible sephardic contri-bution among the founders of a population in Northwest Colombia.Am J Hum Genet, 67, 1287–1295.
CAVALLI-SFORZA, L.L., MENOZZI, P. & PIAZZA, A. (1994).The History and Geography of
Human Genes. Princeton University Press, Princeton.
CHAKRABORTY, R. & WEISS, K.M. (1986). Frequencies of complex diseases in hybrid populations.Am J Phys Anthropol,70, 489–503.
CHAKRABORTY, R. & WEISS, K.M. (1988). Admixture as a tool for finding linked genes and detecting that difference from allelic association between loci.Proc Natl Acad Sci U S A, 85, 9119–9123.
CHIKHI, L. (2009). Update to Chikhi et al.’s "Clinal variation in the nuclear DNA of euro-peans" (1998): genetic data and storytelling–from archaeogenetics to astrologenetics?
Hum Biol,81, 639–643.
G. (1998). Clinal variation in the nuclear DNA of Europeans.Hum Biol,70, 643–657. CHIKHI, L., BRUFORD, M.W. & BEAUMONT, M.A. (2001). Estimation of admixture
pro-portions: a likelihood-based approach using Markov chain Monte Carlo.Genetics,158, 1347–1362.
CHIKHI, L., NICHOLS, R.A., BARBUJANI, G. & BEAUMONT, M.A. (2002). Y genetic data support the Neolithic demic diffusion model.Proc Natl Acad Sci U S A,99, 11008–11013. CHILDE, V.G. (1936).Man Makes Himself. Oxford University Press, Oxford.
CHOISY, M., FRANCK, P. & CORNUET, J.M. (2004). Estimating admixture proportions with microsatellites: comparison of methods based on simulated data.Mol Ecol, 13, 955– 968.
CONNELL, G.E. & SMITHIES, O. (1959). Human haptoglobins: estimation and purification.
Biochem J,72, 115–121.
CURRAT, M. & EXCOFFIER, L. (2004). Modern humans did not admix with Neanderthals during their range expansion into Europe.PLoS Biol,2, e421.
CURRAT, M. & EXCOFFIER, L. (2005). The effect of the Neolithic expansion on European molecular diversity.Proc R Soc B,272, 679–688.
CURRAT, M. & EXCOFFIER, L. (2011). Strong reproductive isolation between humans and Neanderthals inferred from observed patterns of introgression.Proc Natl Acad Sci U S A,108, 15129–15134.
CURRAT, M., RAY, N. & EXCOFIER, L. (2004). SPLATCHE: a program to simulate genetic diversity taking into account environmental heterogeneity.Mol Ecol Notes,4, 139–142. CURRAT, M., POLONI, E.S. & SANCHEZ-MAZAS, A. (2010). Human genetic differentiation
across the Strait of Gibraltar.BMC Evol Biol,10, 237.
DESHPANDE, O., BATZOGLOU, S., FELDMAN, M.W. & CAVALLI-SFORZA, L.L. (2009). A serial founder effect model for human settlement out of Africa.Proc Biol Sci,276, 291– 300.
DIAMOND, J. & BELLWOOD, P. (2003). Farmers and their languages: the first expansions.
Science,300, 597–603.
DUPANLOUP, I. & BERTORELLE, G. (2001). Inferring admixture proportions from molecular data: extension to any number of parental populations.Mol Biol Evol,18, 672–675. DUPANLOUP, I., BERTORELLE, G., CHIKHI, L. & BARBUJANI, G. (2004). Estimating the
impact of prehistoric admixture on the genome of Europeans.Mol Biol Evol, 21, 1361– 1372.
ESTOUP, A., BEAUMONT, M., SENNEDOT, F., MORITZ, C. & CORNUET, J.M. (2004). Ge-netic analysis of complex demographic scenarios: spatially expanding populations of the cane toad, Bufo marinus.Evolution,58, 2021–2036.
FAGUNDES, N.J.R., RAY, N., BEAUMONT, M., NEUENSCHWANDER, S., SALZANO, F.M., BONATTO, S.L. & EXCOFFIER, L. (2007). Statistical evaluation of alternative models of human evolution.Proc Natl Acad Sci U S A,104, 17614–9.
FISHER, R.A. (1922). On the dominance ratio.Proc R Soc Edin,42, 321–341.
GKIASTA, M., RUSSELL, T., SHENNAN, S. & STEELE, J. (2003). Neolithic transition in Europe: the radiocarbon revisited.Antiquity,77, 45–62.
GRONAU, I., HUBISZ, M.J., GULKO, B., DANKO, C.G. & SIEPEL, A. (2011). Bayesian inference of ancient human demography from individual genome sequences.Nature
Ge-netics,43, 1031–1034.
HALLATSCHEK, O. & NELSON, D.R. (2008). Gene surfing in expanding populations.Theor
Popul Biol,73, 158–170.
HAMILTON, G., CURRAT, M., RAY, N., HECKEL, G., BEAUMONT, M. & EXCOFFIER, L. (2005a). Bayesian estimation of recent migration rates after a spatial expansion. Genet-ics,170, 409–417.
HAMILTON, G., STONEKING, M. & EXCOFFIER, L. (2005b). Molecular analysis reveals tighter social regulation of immigration in patrilocal populations than in matrilocal pop-ulations.Proc Natl Acad Sci U S A,102, 7476–80.
HIRSZFELD, L. & HIRSZFELD, H. (1919). Serological differences between the blood of dif-ferent races.Lancet,194, 675–679.
ITAN, Y., POWELL, A., BEAUMONT, M.A., BURGER, J. & THOMAS, M.G. (2009). The origins of lactase persistence in Europe.PLoS Comput Biol,5, e1000491.
JOBLING, M.A., HURLES, M. & TYLER-SMITH, C. (2003).Human Evolutionary Genetics:
Origins, Peoples and Disease. Garland Science, New York.
KIMURA, M. & WEISS, G.H. (1964). The stepping stone model of population structure and the decrease of genetic correlation with distance.Genetics,49, 561–76.
KLOPFSTEIN, S., CURRAT, M. & EXCOFFIER, L. (2006). The fate of mutations surfing on the wave of a range expansion.Mol Biol Evol,23, 482–490.
LAVAL, G., PATIN, E., BARREIRO, L.B. & QUINTANA-MURCI, L. (2010). Formulating a His-torical and Demographic Model of Recent Human Evolution Based on Resequencing Data from Noncoding Regions.PLoS One,5, e10284.
LONG, J.C. (1991). The genetic structure of admixed populations.Genetics,127, 417–428. MARKS, J. (2007). Long shadow of Linnaeus’s human taxonomy.Nature,447, 28.
MENOZZI, P., PIAZZA, A. & CAVALLI-SFORZA, L. (1978). Synthetic maps of human gene frequencies in Europeans.Science,201, 786–792.
MITHEN, S. (2007). Did farming arise from a misapplication of social intelligence? Philos
Trans R Soc Lond B Biol Sci,362, 705–718.
MOURANT, A.E. (1949). The ethnological distribution of the Rh and MN blood-groups.Adv Sci,5, 313.
PRICE, T.D. (2000). Europe’s First Farmers: an introduction, chap. 1, 1–18. Cambridge University Press, Cambridge.
PRITCHARD, J.K., SEIELSTAD, M.T., PEREZ-LEZAUN, A. & FELDMAN, M.W. (1999). Popu-lation growth of human Y chromosomes: a study of Y chromosome microsatellites.Mol
Biol Evol,16, 1791–1798.
PRITCHARD, J.K., STEPHENS, M. & DONNELLY, P. (2000). Inference of population structure using multilocus genotype data.Genetics,155, 945–959.
PRUGNOLLE, F., MANICA, A. & BALLOUX, F. (2005). Geography predicts neutral genetic diversity of human populations.Curr Biol,15, R159–R160.
QUINTANA-MURCI, L., QUACH, H., HARMANT, C., LUCA, F., MASSONNET, B., PATIN, E., SICA, L., MOUGUIAMA-DAOUDA, P., COMAS, D., TZUR, S., BALANOVSKY, O., KIDD, K.K., KIDD, J.R.,VAN DERVEEN, L., HOMBERT, J.M., GESSAIN, A., VERDU, P., FRO-MENT, A., BAHUCHET, S., HEYER, E., DAUSSET, J., SALAS, A. & BEHAR, D.M. (2008). Maternal traces of deep common ancestry and asymmetric gene flow between Pygmy hunter-gatherers and Bantu-speaking farmers.Proc Natl Acad Sci U S A, 105, 1596– 601.
RAMACHANDRAN, S., DESHPANDE, O., ROSEMAN, C.C., ROSENBERG, N.A., FELDMAN,
M.W. & CAVALLI-SFORZA, L.L. (2005). Support from the relationship of genetic and geographic distance in human populations for a serial founder effect originating in Africa.
Proc Natl Acad Sci U S A,102, 15942–15947.
RAY, N., CURRAT, M. & EXCOFFIER, L. (2003). Intra-deme molecular diversity in spatially expanding populations.Mol Biol Evol,20, 76–86.
RAY, N., CURRAT, M., BERTHIER, P. & EXCOFFIER, L. (2005). Recovering the geographic origin of early modern humans by realistic and spatially explicit simulations.Genome Res,15, 1161–1167.
Bioinformatics,26, 2993–2994.
RENFREW, C. (2001). From molecular genetics to archaeogenetics.Proc Natl Acad Sci U S A,98, 4830–4832.
RICHARDS, M. (2003). The neolithic invasion of Europe.Annu Rev Anthropol,32, 135–162. RICHARDS, M., CÔRTE-REAL, H., FORSTER, P., MACAULAY, V., WILKINSON-HERBOTS, H., DEMAINE, A., PAPIHA, S., HEDGES, R., BANDELT, H.J. & SYKES, B. (1996). Pale-olithic and nePale-olithic lineages in the European mitochondrial gene pool.Am J Hum Genet, 59, 185–203.
RICHARDS, M., MACAULAY, V., HICKEY, E., VEGA, E., SYKES, B., GUIDA, V., RENGO, C., SELLITTO, D., CRUCIANI, F., KIVISILD, T., VILLEMS, R., THOMAS, M., RYCHKOV, S., RYCHKOV, O., RYCHKOV, Y., GÖLGE, M., DIMITROV, D., HILL, E., BRADLEY, D., ROMANO, V., CALÌ, F., VONA, G., DEMAINE, A., PAPIHA, S., TRIANTAPHYLLIDIS, C., STEFANESCU, G., HATINA, J., BELLEDI, M., RIENZO, A.D., NOVELLETTO, A., OPPEN-HEIM, A., NØRBY, S., AL-ZAHERI, N., SANTACHIARA-BENERECETTI, S., SCOZARI, R., TORRONI, A. & BANDELT, H.J. (2000). Tracing european founder lineages in the Near Eastern mtDNA pool.Am J Hum Genet,67, 1251–1276.
RICHARDS, M., MACAULAY, V., TORRONI, A. & BANDELT, H.J. (2002). In search of geo-graphical patterns in European mitochondrial DNA.Am J Hum Genet,71, 1168–1174. ROSENBERG, N.A., PRITCHARD, J.K. & FELDMAN, M.W. (2002). Genetic Structure of
Hu-man Populations.Science,298, 2381–2385.
SALZANO, F.M. (2004). Interethnic variability and admixture in latin America–social impli-cations.Rev Biol Trop,52, 405–15.
SEMINO, O., PASSARINO, G., OEFNER, P.J., LIN, A.A., ARBUZOVA, S., BECKMAN, L.E., BENEDICTIS, G.D., FRANCALACCI, P., KOUVATSI, A., LIMBORSKA, S., MARCIKIAE, M., MIKA, A., MIKA, B., PRIMORAC, D., SANTACHIARA-BENERECETTI, A.S., CAVALLI-SFORZA, L.L. & UNDERHILL, P.A. (2000). The genetic legacy of Paleolithic Homo sapi-ens sapisapi-ens in extant Europeans: a Y chromosome perspective. Science, 290, 1155– 1159.
SMITHIES, O. (1959). An improved procedure for starch-gel electrophoresis: further varia-tions in the serum proteins of normal individuals.Biochem J,71, 585–587.
SOUSA, V.C., FRITZ, M., BEAUMONT, M.A. & CHIKHI, L. (2009). Approximate bayesian computation without summary statistics: the case of admixture. Genetics, 181, 1507– 1519.
WANG, J. (2003). Maximum-likelihood estimation of admixture proportions from genetic data.Genetics,164, 747–765.
WEALE, M.E., WEISS, D.A., JAGER, R.F., BRADMAN, N. & THOMAS, M.G. (2002). Y chromosome evidence for Anglo-Saxon mass migration.Mol Biol Evol,19, 1008–21. WILKINS, J.F. (2006). Unraveling male and female histories from human genetic data.Curr
Opin Genet Dev,16, 611–7.
WILKINS, J.F. & MARLOWE, F.W. (2006). Sex-biased migration in humans: what should we expect from genetic data?Bioessays,28, 290–300.
WRIGHT, S. (1931). Evolution in Mendelian Populations.Genetics,16, 97–159.
ZVELEBIL, M. & ZVELEBIL, K. (1998). Agricultural transition and Indo-European dispersals.
Japan: an admixture perspective
Rita Rasteiro1 and Lounès Chikhi1,2,3
1Instituto Gulbenkian de Ciência, Rua da Quinta Grande, 6, 2780-156 Oeiras,Portugal;2CNRS, Laboratoire
Évo-lution et Diversité Biologique (EDB), Bât. 4R3 b2, 118 Route de Narbonne, 31062 Toulouse cédex 9, France;
3Université de Toulouse, UPS, EDB, Bât. 4R3 b2, 118 Route de Narbonne, 31062 Toulouse cédex 9, France
Data collection: R Rasteiro
Analysis: R Rasteiro
Manuscript:R Rasteiro and L Chikhi
Citation: Rasteiro R, Chikhi L (2009) Revisiting the peopling of Japan: an admixture per-spective. J Hum Genet 54: 349-54
2.1
Abstract
The first inhabitants of Japan, the Jomon hunter-gatherers, had their culture sig-nificantly modified by that of the Yayoi farmers, who arrived at a later stage from mainland Asia. How this change took place is still debated, but it has been sug-gested that modern Japanese are the product of admixture between these two populations. Here, we applied for the first time an admixture approach to study the Jomon-Yayoi transition, using previously published Y-chromosomal data.
that could not have contributed to this process, our approach is able to detect in-consistencies when they are used as parental populations. However, despite these promising results, we could not locate precisely the geographical origin of the Yayoi in mainland Asia, as different potential sources gave similarly good results. This suggests that more loci would be required for a better understanding of the peo-pling of Japan.
Keywords:Japan/Neolithic/Jomon/Yayoi/admixture/Y-chromosome
2.2
Introduction
The development and spread of farming, referred to as the Neolithic transition was one of the major demographic events of human prehistory [Bellwood, 2004]. This process took place independently in different geographic areas, each one most likely associated with different demographic changes and with different domesti-cated animals and plants. In principle, each of these changes can be described as a process by which at least two human groups (Palaeolithic hunter-gatherers [HG] and Neolithic farmers) admixed to different extents. These processes can be seen as admixture models and although they have been used to study the Neolithic transition in Europe [Chikhiet al., 2002; Currat & Excoffier, 2005; Dupanloupet al., 2004], this has not been the case for Asia. Here, we focus on Eastern Asia, where the transition to agriculture has long been controversial, specifically regarding the
prehistory of Japan [Cavalli-Sforzaet al., 1994; Hanihara, 1991; Matsumura, 2001;
Mizoguchi, 1986].
Archaeological data suggest that there were probably two migratory waves of in-coming people, both from the Asian continent to Japan. The first migration took
placec.38,000 - 37,000 BP, before the Pleistocene land bridges were submerged
[Pope & Terrell, 2008], and later gave rise to the Jomon culture (≥12,000 BP) [Ono
et al., 2002]. Although they were a HG society, the Jomon were the holders of one
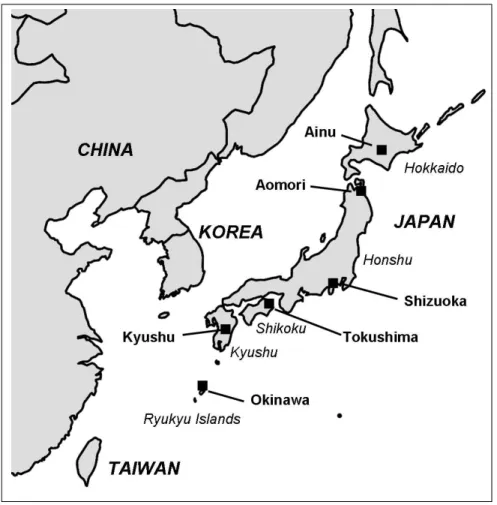
devel-Figure 2.1: Map of the Japanese Islands - Approximate geographical locations of the Japanese populations analysed in the present study. The other samples used as parental are not represented on the map.
oped agriculture [Bellwood, 2004; Highman, 2005]. A long time after this period,
c. 2,300 BP, a second wave of people, together with a ‘wet rice culture’,
weav-ing and metalwork, entered the southern Kyushu island (Figure 2.1), through the
Korean Peninsula [Jin et al., 2003], and then spread northeastward, starting the
the peopling of Japan and the contribution of both Jomon and Yayoi populations to modern Japanese. While the latter model claims that modern Japanese should be descendants of the incoming Yayoi who replaced completely the Jomon people [Cavalli-Sforzaet al., 1994], the former entails a movement of the Yayoi culture and ideas rather than people, with consequently no genetic contribution of the Yayoi to modern Japanese [Mizoguchi, 1986]. However, reality must have been less ex-treme and currently, it is widely accepted that modern Japanese are the result of admixture between the two populations that produced both the Jomon and Yayoi cultures. This was suggested by Hanihara [1991] and Matsumura [2001] based on dental and cranial characteristics, and more recently by a number of authors who used genetic data [Hammer & Horai, 1995; Hammeret al., 2006; Horaiet al., 1996; Omoto & Saitou, 1997; Sokal & Thomson, 1998], including ancient DNA [Ho-raiet al., 1991; Ootaet al., 1995].
Since, one of the few points on which all studies agree is that at least two human groups admixed at some point in the past, a simplified way to explain the data is the use of an admixture approach. However, one of the limitations, of most of admix-ture models, is that they usually ignore genetic drift since the admixadmix-ture event. This
is why we used an approach [Chikhiet al., 2001] that has already been applied to
address the Neolithic transition in Europe [Belle et al., 2006; Chikhi, 2003; Chikhi
et al., 2002] and where drift is explicitly accounted for. We expect that the
pop-ulations is based on archaeological evidence and is described in the Material and Methods section.
Thus, the aim of this work was to determine whether an admixture approach could be fruitful to study the Neolithic transition in Japan. To do this we analysed Y-chromosomal data from the literature, using different ‘parental’ populations, in or-der to test different hypotheses. In a first set of analyses, the parental populations were chosen among a set of Asian populations (see below for details). The data were also analysed by using, as a negative test, populations that were unlikely to have contributed to the gene pool of modern Japanese, namely a European (Sar-dinia) and a geographically closer (Oceania) population, and for which comparable Y-chromosomal data was available. Altogether, we show that admixture models can provide indeed interesting insights in the peopling of Japan. In particular, our re-sults strongly suggest that the Yayoi immigrants spread by a process similar to the demic diffusion, first proposed for Europe by Ammerman and Cavalli-Sforza [1984].
2.3
Material and Methods
2.3.1 Populations used
The analyses presented in this work were based on published non recombining Y-chromosome (NRY) data of Japanese and other Asian populations. A total of 275 individuals, representing each of the Japanese islands (Figure 2.1), were anal-ysed: Ainu (20), Aomori (26), Shizuoka (61), Tokushima (70), Kyushu (53) and Okinawa (45). All the Japanese data were published by Hammer and colleagues [2006], except the Ainu data that were pooled with data from Tajima et al. [2004].
Mainland Asian data [Hammer et al., 2006] were obtained for populations from
Northeast (441), Southeast (683) and Central (419) Asia and also a sample from Korea (43) [Xueet al., 2006]. We also used two additional populations, Sardinia (77) [Seminoet al., 2000] and Oceania (209) [Hammeret al., 2006], as parental popula-tions in the admixture model used (see below). Y-chromosome binary haplogroups, were defined by the analysis of the binary polymorphisms described in Hammer et
Asia, Korea, Oceania and Sardinia followed the haplogroups nomenclature of the Y Chromosome Consortium [2002].
2.3.2 The Admixture Model
The admixture method used assumes that an ‘admixed’ or ‘hybrid’ population (H),
of sizeNh, is the result of the admixture of two independent parental populations,
P1and P2, of sizeN1 andN2,T generations ago, with respective contributionsp1 andp2(p2=1−p1). After the admixture event, the three populations are isolated and assumed to evolve independently under pure genetic drift (Fig. 1.6). The ad-vantage of this model, and of the associated inference methods, is that (i) the three populations have differentNi(wherei can be1, 2 or h) and (ii) drift and admixture are separated. It is important to note that, by explicitly accounting for drift after the admixture event, the method allows for present-day samples from parental popula-tions to have drifted significantly from the original unknown parental populapopula-tions. Also, the method does not fix the original parental allele frequencies. Instead, they were allowed to vary and this uncertainty is explicitly taken into account. A Bayesian full-likelihood method based on this model was developed by Chikhi and colleagues [2001], implemented in the LEA (Likelihood-based Estimation of
Admix-ture) software [Langellaet al., 2001]. LEA implements a Monte Carlo Markov Chain
algorithm to jointly infer all the parameters of the admixture model, including the an-cestral allelic configurations that are compatible with the present, observed allelic frequencies. For each analysis, LEA was run for 300 000 steps, as it has been shown that it is enough to reach equilibrium for Y-chromosomal data [Chikhiet al., 2001, 2002].
2.3.3 Choice of parental populations
For simplicity and consistency, the P1 population was always used to represent
the HG or Jomon, whereas the population P2 was used to represent the farmers
of the Yayoi period. Hence, the parameterp1represents the ‘Jomon’ contribution,
However, like all admixture methods, it requires that these parental populations be defined. While it is unlikely that today’s populations are direct descendants from any of the original groups, we can use current archaeological and anthropological data to identify populations that are likely to be less admixed, and use them as de-scendants from the original parental populations. It is noteworthy that if there has been a lot of admixture in these parental populations, the general effect should be to blur the original signal, and make it less clear. Therefore, any signal observed today should be an indication that some information is still present in the data. Al-though the Jomon culture has almost been replaced across Japan, there are some indigenous minority ethnic groups who live in the peripheral areas of Japan, which
are considered descendants of this ancient culture [Hanihara, 1991; Horai et al.,
1996; Omoto & Saitou, 1997; Tajimaet al., 2004]. Those are the Ainu people, in the northern part of the Hokkaido Island, and the Ryukyuans, in the southern Ryukyu Islands. Moreover, the Ainu lived in relative isolation until the end of the 19th cen-tury [Hudson, 1994], and show unique physical characteristics such as hairiness, wavy hair and deep-set eyes, which are different from those of most Japanese. On the other hand, the Ryukyuan kingdom had past-relations with mainland Japan since medieval, with possibly frequent gene flow [Haneji et al., 2007; Toma et al., 2007], but it is thought to have nevertheless maintained genetic differentiation from
mainland Japan [Yamaguchi-Kabataet al., 2008]. For these reasons the admixture
analyses were performed using either the Ainu or the Ryukyuans, the latter repre-sented by the Okinawa sample, as descendants of theP1population, in the different
analyses. For the descendants of the Yayoi (considered the P2 population),
differ-ent pardiffer-ental populations from mainland Asia were also used, namely NEA (North East Asia), SEA (South East Asia), CAS (Central Asia), and Korea.
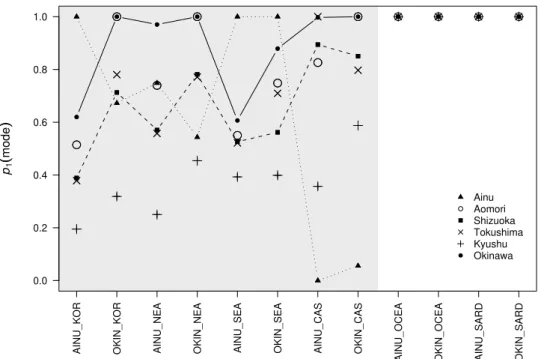
To determine whether our approach was robust to incorrect specification of the
parental populations, we also used as P2two populations that are unlikely to have
(Aomori, Shizuoka, Tokushima, Kyushu) were analysed using two populations for
P1 (Ainu and Okinawa), six populations for P2 (including Sardinia and Oceania),
making a total of 12 different sets of admixture analyses. In addition, for each ad-mixture analysis, the parental populations were also considered as ‘admixed’ pop-ulations. For example, we used the Ainu asP1, as H, against the six different P2 populations. This kind of analysis allowed us to quantify the uncertainty around the estimation ofp1, since the hybrid and one parental (hereP1) are exactly identical.
Thus, thep1posteriors should always have a mode equal or very close to one, with
a variance related to both the sample size and drift since the admixture event. Of course, when the Ainu and Okinawa are used as ‘pseudo-hybrids’ the correspond-ing posteriors were not used in the regression analysis described below.
2.3.4 Calculating Drift
The LEA software also allowed us to estimate genetic drift since the admixture
event in the three populations, through the parameters ti = T/Ni, where i
corre-sponds to1(Jomon parental population),2(Yayoi parental population) orh(Japanese
hybrid population). Populations that have developed agriculture earlier would have increased in size earlier and would thus exhibit lower amounts of drift since the
admixture event. Consequently, if the admixture model is consistent, the
ttextsub-script1 values should in general be higher than the t2 values, whereas th values
should be more variable across populations.
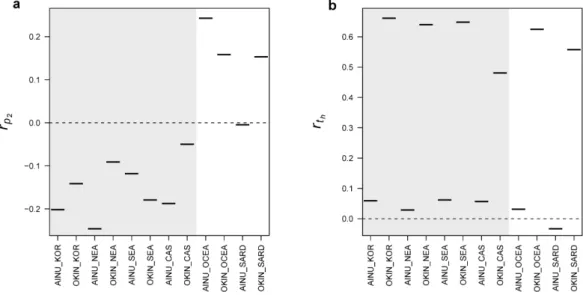
2.3.5 Spatial variation of admixture: regression analysis
To detect, quantify, and assess the significance of any geographical trend in admix-ture proportions across Japan, we used a linear regression approach similar to that used by Chikhi et al. [2002]. The idea is to determine whether there is a correla-tion between the ‘Yayoi contribucorrela-tion’, measured byp2, and the geographic distance
from the population used forP2. For each location sampled in Japan, we computed
a geographic distance from the sample used asP2and then estimated a linear
![Figure 1.1: SE-NW gradients in Europe - Synthetic map of the first principal com- com-ponent of variation found by Cavalli-Sforza and colleagues [1994])](https://thumb-eu.123doks.com/thumbv2/123dok_br/15765862.640469/36.765.227.583.217.465/figure-gradients-europe-synthetic-principal-variation-cavalli-colleagues.webp)
![Figure 1.2: Neolithic transition - Different independent points of origin, in specific climatic and geographical contexts (adapted from Diamond and Bellwood [2003]).](https://thumb-eu.123doks.com/thumbv2/123dok_br/15765862.640469/38.765.122.690.228.498/neolithic-transition-different-independent-specific-climatic-geographical-bellwood.webp)
![Figure 1.5: Neolithic contribution across Europe - In 2002, Chikhi and colleagues analysed a large published Y-chromosome dataset [Semino et al., 2000], using an ad-mixture approach (see Fig](https://thumb-eu.123doks.com/thumbv2/123dok_br/15765862.640469/44.765.196.607.206.486/figure-neolithic-contribution-colleagues-analysed-published-chromosome-approach.webp)