EFFECTS OF MATERNAL
NUTRITION
ON FETAL
GROWTH
AND INFANT
DEVELOPMENT17 2
R. E. Klein, P. Arenales, H. Iklgado, P. L. Engle, G. GuzmBn,
M. Irwin, R Lasky, A. Lechtig, R. Martorell, V. Mejia Pivaral,
P. Russell, and C. Yarbrough3
A study of childTen from four chronically malnourished Gua-
temalan villages has demonstrated a significant association
between food sufifilementation during Pregnancy and loweT firevalences of growth Tetardation and infant mortality. Sufifilementation of the children’s diets also correlated with better #eTformance on jxychological tests.
Introduction
Infant mortality is a major public health problem in developing countries, where an
average of almost two out of every 10
liveborn infants die within their first year. By comparison, in the developed countries only about two out of every 100 infants die in the first 12 months.
At the same time, physical growth retar- dation at birth and during the first year of postnatal life is widespread in many poor
communities around the world. And it is
known that babies with early growth
retardation are less likely to survive than those whose growth has been normal. Fur-
‘Paper originally presented at the XIV Meeting of the PAHO Advisory Committee on Medical Research (Washington, 7-11 July 1975): also appearing in Spanish in Bol Of Sanit Panam, 1977.
‘Research supported by grant PH 43-65-640 from the National Institute of Child Health and Human Development, U.S. National Institutes of Health, Bethesda, Maryland, U.S.A.
3A11 of the Division of Human Development, Institute of Nutrition of Central America and Panama, Guatemala City, Guatemala. Dr. Klein is Head of the Division.
thermore, babies with physical growth re- tardation frequently perform poorly in tests of mental development. It is widely believed that the factors accounting for most of the growth failure, developmental retardation, and high mortality in developing countries are environmental in nature and therefore can be prevented.
Maternal and child malnutrition has
been postulated as one of several factors contributing to these high rates of develop-
mental retardation and infant death.
However, confirmation of its role has been difficult in populations with chronic mod-
erate malnutrition-partly because of the
imprecision involved in defining maternal and child nutritional status and partly
because information is lacking on other
PAHO BULLETIN l vol. x, no. 4, I976
that could be produced by improved
nutrition.
The analysis that follows is based on a study in which food supplements were given to pregnant a.nd lactating women and their children in four rural Guatemalan villages. Subsequent changes in the children’s physi- cal size, mental development, and health were then measured, and various factors
capable of obscuring or influencing the
postulated effects of improved nutrition were investigated.
Materials and Methods
Experimental Design
The present analysis was based on data provided by an earlier longitudinal investi- gation of the effects of chronic malnutrition on physical growth and mental development
(I). Table 1 lists the variables that were monitored, as well as the general types of information that were gathered. Two food supplements, stole 4 and fresco,5 were used, each being given in two villages. Attend-
ance at the supplementation center was
voluntary, and consequently there was a
wide range in intake. The preparations
were chosen for their nutrient content
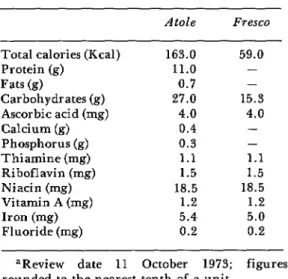
(Table 2): fresco had no protein and pro- vided only one-third of the calories present in an equal volume of stole, but both had similar concentrations of vitamins and
minerals whose absence could possibly be
limiting factors in the local diet.
The Study Po#ulation
Moderate malnutrition and infectious
diseases are endemic in the four villages, and the median family income is only about US$200 a year. The typical house is built of adobe and has no sanitary facilities.
Drinking water is contaminated with
4Local name for a gruel commonly made with corn. 5Local name for a cool, refreshing drink.
Table 1. Design of the experiment.
Supplement provided in four villages:
l Study population of two villages received
atoEe,a a protein-calorie supplement
l Study population of two villages received
fresco, b a calorie supplement
Information collected from mothers and chil- dren:
l Independent variables:
Subjects’ attendance at feeding center Amount of supplement ingested
l Dependent variables:
Assessment of child’s physical growth Assessment of child’s mental development
l Other data:
Mother’s obstetric historyC Details of the delivery Details of clinical examination Family dietary status Maternal morbidity status Family socioeconomic status
aA gruel commonly made with corn. bA cool, refreshing drink.
‘%ased on diagnosis of pregnancy by absence of menstruation.
enteric bacteria. Corn and beans are the principal staples of the home diet, animal protein providing some 12 per cent of total
Table 2. Nutrient content of the food supplements (180 ml).=
Atole Fresco
Total calories (Kcal) Protein (g) Fats (9) Carbohydrates(g) Ascorbic acid (mg) Calcium (g) Phosphorus (g) Thiamine (mg) Riboflavin (mg) Niacin (mg) Vitamin A (mg) Iron (mg) Fluoride (mg)
163.0 59.0
11.0 -
0.7 -
27.0 15.3
4.0 4.0
0.4 -
0.3 -
1.1 1.1
1.5 1.5
18.5 18.5
1.2 1.2
5.4 5.0
0.2 0.2
Klein et al. l MATERNAL NUTRITION 303
protein intake. The average mother’s height studied for each of the variables. The total and weight are low -149 cm and 49 kg, sample of 1,083 children included 671 born
respectively. Among the women studied the during the period January 1969-February
number of previous deliveries varied from 1973, as well as 412 already living who were zero to 13 and the reproductive age ranged under 3 years of age when data collection from 14 to 46 years.
VariabEes and Sam#le Size
Ingestion of supplemented calories was
selected as the criterion for assessing
supplement intake, since the home diet
appeared to be more limiting in calories than in proteins (2). It should be stressed, however, that while calories appeared to be limiting in this study population, other populations may experience very different nutritional conditions. The main variables
measured were: prevalence of physical
growth retardation at birth and at 36
months of age, psychological test perform- ance at birth and at 24 and 36 months of age, and infant mortality.
Table 3 gives the size of the sample
Table 3. Size of the population samples studied.
Children Total
born into children the study in the study Total children available
Children tested for phys- ical growth
At birth At 36 months
Children tested for men- tal development At birth At 6 months At 15 months At 24 months At 36 months
Children dying in 1st year of life
671
405 330=
157 472 452 453= 329=
44
1,083
405 581=
157 472 460 480= 565=
began in January 1969.
Results and Discussion
Physical Growth Retardation
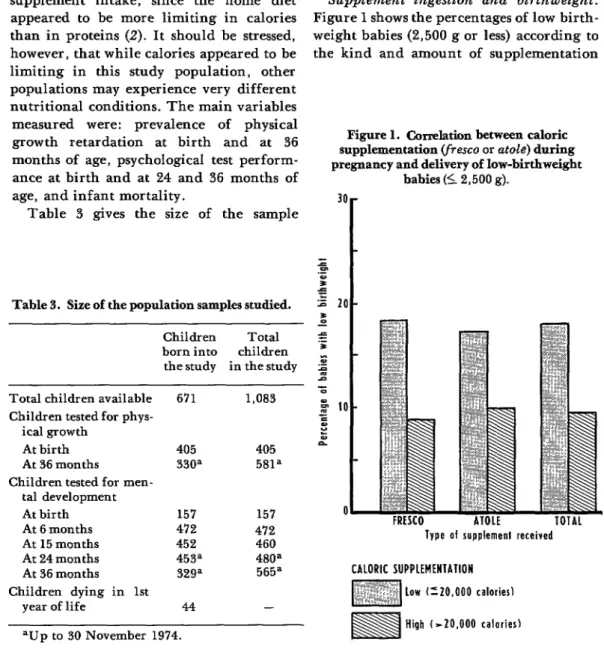
Supplement ingestion and birthweight.
Figure 1 shows the percentages of low birth- weight babies (2,500 g or less) according to the kind and amount of supplementation
Figure 1. Ckm&ticm between caloric supplementation (fresco or atok) during pregnancy and delivery of low-birthweigbt
babies (I 2,500 g).
Type of rupplemenl received
CALORIC SUPPLEMENiATlON
304 PAHO BULLETIN l vol. X, no. 4, 1976
received by the mother. The mothers are
divided into four groups, depending on
whether they received able or fresco and whether they received over 20,000 calories of supplementation during their pregnan- cies or less than that amount. There were 68
women in the high-calorie (over 20,000)
fresco group, 118 in the low-calorie, fresco
group, 102 in the high-calorie stole group, and 117 in the low-calorie stole group. The proportion of mothers producing low-birth-
weight infants was lower in the two
high-calorie groups. In fact, the risk of delivering a low-birthweight baby was only about half as great as it was for women in the low-calorie groups. Since home caloric intake was similar in all the groups, it is safe to assume that the calories received from the supplements were in fact additional calories in the maternal diet. Among the high-calo- rie subjects, the extra amount ingested appears to have averaged about 35,000 per pregnancy, or roughly 125 a day.
This association between birthweight and supplement intake cannot be accounted for
by the other major maternal variables
considered-home diet, body height and/or weight, morbidity, obstetric characteristics,
or socioeconomic status. Nor can it be
explained by individual maternal factors such as the tendency for certain mothers to have large babies, since a difference based
on supplementation was observed in con-
secutive siblings. It could thus be concluded
that if the same mother consumed more
calories during one pregnancy than an-
other, there was a tendency for the baby of that pregnancy to be heavier at birth. The result of the analysis, therefore, is that in the population studied caloric supplementa- tion during pregnancy caused the decrease in the proportion of low-weight babies.
The matter of protein intake requires
comment. In the particular population
under study the protein-calorie ratio in the home diet was high, on the order of 1:9. Hence it was considered feasible to improve the mothers’ total diet by merely adding
more calories. In other populations with other diets, however, the situation might be entirely different. The best supplement for one population might not necessarily be the best for another; indeed, it might even be harmful rather than beneficial (3).
Growth at 36 months of age. For purposes of the present analysis retardation of growth (whether of weight, height, or head circum- ference) was defined as any deficit placing the subject in the lower 30th percentile of the study population. Since this limit is 10 centiles lower than the Denver standard (4), and since it was not felt that the populations
differ in genetic potential (5), such a
deficit, the authors consider, can well be regarded as true retardation. For example, in the case of weight the lower limit corresponded to a point equivalent to 78 per cent of the mean weight of the Denver standard (4).
The children with retardation in weight, height, or head circumference at 36 months of age were grouped according to whether
they received a low, medium, or high
amount of caloric supplement (Figure 2). If a child received more than 10,000 supple- mental calories per quarter for at least 14
quarters, either directly or through its
mother, it was assigned to the “high”
category; if the number of calories was
between 5,000 and 10,000, it was placed in
the “medium” group; and if the amount
was less than 5,000, the level of supplemen- tation was considered “low.” The data point to a strong correlation between the level of
supplementation and all three kinds of
physical growth retardation.
Klein et al. l MATERNAL NUTRITION 305
Figure 2. Correlation between caloric supplementation (both maternal during pregnancy and of the child up to 36 months)
and indicators of growth retardation (total 581 children,fresco and atde combined).
0
WEIGH1 HEIGHI HEAD ClRtUHFERtWCE
presented for weight retardation in Figure
3. The differences among children who
could not have received the supplement and the differences among children who could have but did not were the same or very nearly so. The data also show, however, that
the children who received a medium
amount of calories via fresco were more likely to be small than those who received a comparable amount via stole. This observa- tion again raises the question of the separate roles of protein and calories in the diet of the study population. Further investigation of this subject is currently underway.
Still, it should be stressed that an associa-
tion between caloric supplementation and
reduced prevalence of growth retardation was evident in all the four villages. That is to say, the proportion of growth-retarded children was consistently greater in each low-supplement group than in the middle-
or high-supplement group in the same
village. Furthermore, in the overall four- village sample the risk of growth retarda-
tion was nearly three times greater among the children who received a low amount of supplement than it was in the high-supple-
ment group. Both in the analysis of
birthweight and in that of growth retarda- tion the associations observed were repli-
cated in analyses of variance and in
regressions. Moreover, the associations
could not be explained by maternal varia- bles such as home diet, body height and/or weight, morbidity, obstetric characteristics, or socioeconomic status. Thus the present authors now consider this relationship to be causab, estimating that the final result of continued food supplementation up to seven years of age would close the gap between the
Denver height standard and the average
height of the low-supplement children by
about 50 per cent (6).
Figure 3. Correlation between caloric supplementation (both maternal during pregnancy and of the child up to
56 months) and weight retardation, by type of supplement received.
LE TOIAL
CALORIC IlJPPLEMtWlAllOll
306 PAHO BULLETIN l vol. X, no. 4, 1976
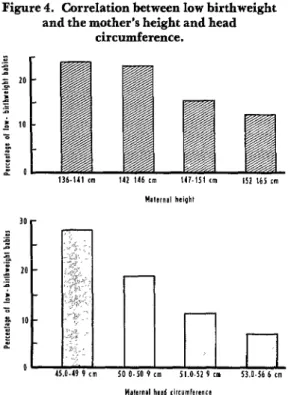
Birthweight and maternal measurements.
Maternal head circumference and height
were shown to be associated with birth-
weight: smaller mothers tended to have
smaller babies (Figure 4). Since the bulk of
adult head circumference and height
retardation results from events occurring in the first few years of life, the association between maternal measurements and birth-
Figure 4. Correlation between low birthweight and the mother’s height and head
circumference.
weight could possibly mirror the effect of
early maternal nutrition on subsequent fetal nutrition. Other maternal anthropo- metric variables are currently under inves- tigation. It has been found, for example, that a significant association exists between birthweight and maternal arm circumfer- ence. It is felt that this latter correlation may reflect the influence of the mother’s more recent nutritional status.
Birthweight and maternal morbidity during pregnancy. A pooled indicator of
morbidity during pregnancy, composed of
the sum of days ill with diarrhea or ano- rexia and of days confined for other sick- ness, correlated negatively with birthweight (Table 4). The proportion of low-birth- weight babies was 33.3 per cent among the
high-morbidity mothers, compared with
10.5 per cent among the low-morbidity group. Since the mothers with high morbi- dity also tended to have a low home caloric
intake, the preliminary interpretation of
these results is that morbidity during
pregnancy is apt to be associated with low dietary intake, which in turn results in retardation of fetal growth (7).
Birthweight and cord leuels of IgM. There is evidence that high cord levels of IgM may be a sign of intrauterine infection, and also that at least several intrauterine infections are associated with low birth- weight (8). The overall study population in
the four villages showed some but not
Table 4. Correlation between birthweight and measures of maternal morbidity.
Indicator of morbidity
Number of Probability Correlation high-morbidity value
value cases less than
Pooled score of days ill with diarrhea or anorexia plus days confined for other ill-
ness - .15 249 .05
Klein et al. l MATERNAL NUTRITION 307
Figure 5. Low birthweight correlated with level of food supplementation and maternal stature, by
socioeconomic status.
low malarnal rtalure I- 147 cm1
SOCIOECOWOMIC SCORE
LOW
High maternal stature 1’147 cm1
significant correlation between higher cord IgM levels (over 20 mg per cent) and lower
birthweight (Table 4). This observation
could mean that heavier babies produce
greater quantities of antibodies, or else that intrauterine infection tends to produce both increased levels of IgM and retarda- tion of fetal growth (9).
Birthweight and socioeconomic factors.
In the study population a low family
socioeconomic score and low maternal
height were found to be correlated with low birthweight (Figure 5). This association has important implications for public health (10).
Significance of low birthweight. It has
been established that low-birthweight ba-
bies have greater rates of infant mortality than babies with higher birthweight (II).
This means that nutritional programs
) 1 High
aimed at decreasing infant mortality could maximize their effectiveness if they were
focused on mothers at high risk of
delivering low-birthweight babies. Accord- ingly, identification of some of the mater-
nal characteristics associated with such
births may be useful in developing methods
for anticipating the likelihood of low-
weight births and for selecting target
populations for nutritional intervention - methods that could be applied effectively
among populations that do not have ade-
quate health services (12).
Determinants of Psychological Test Performance
Psychological testing was done at inter- vals over the period from the children’s
308 PAHO BULLETIN l vol. X, no. 4. 1976
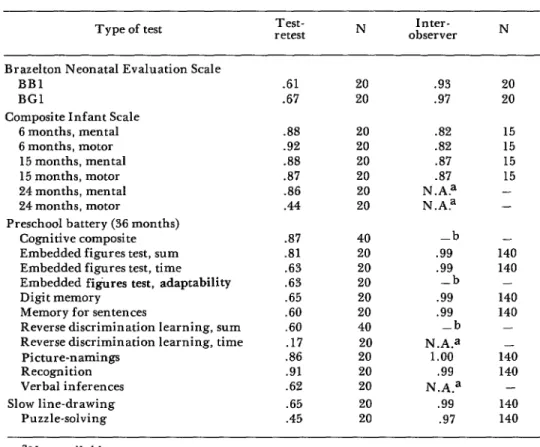
Table 5. Test-retest and interobserver reliability of psychological test measures.
Type of test retest Test- N observer Inter- N
Brazelton Neonatal Evaluation Scale BBl
BGI
Composite Infant Scale 6 months, mental 6 months, motor 15 months, mental 15 months, motor 24 months, mental 24 months, motor
Preschool battery (36 months) Cognitive composite Embedded figures test, sum Embedded figures test, time Embedded figures test, adaptability Digit memory
Memory for sentences
Reverse discrimination learning, sum Reverse discrimination learning, time
Picture-namings Recognition Verbal inferences Slow line-drawing
Puzzle-solving
.61 20 .93
.67 20 .97
.88 20 .82
.92 20 .82
.88 20 .87
.a7 20 .87
86 20 N.A?
.44 20 N.A?
.a7 40 -b
.81 20 .99
.63 20 .99
.63 20 -b
.65 20 .99
.60 20 .99
.60 40 -b
.I7 20 N.A.a
.86 20 1.00
.91 20 -99
.62 20 N.A.a
.65 20 .99
.45 20 .97
20 20
15 15 15 15 - -
- 140 140 - 140 140 - 140 140 - 140 140
aNot available.
bNot appropriate: score is constructed, not observed.
considered that the data collected were
sufficient in quantity and the sample large enough to allow the authors to address the question of a relationship to food supple- mentation.
Two standards were used as a measure of
food supplementation: first, the total
amount ingested by the mother during her pregnancy and lactation together with that received by the child directly up to the time of evaluation; and second, the child’s intake used in arriving at the high, medium, and
low levels reported in Figure 2. The
principal difference between these two
measures is that the first reflects total ingestion over the entire span of time while the second, a weighted figure, indicates the
specific amounts of supplement received
during discrete segments of the child’s life. The various psychological performance tests were selected on the basis of theoretical and statistical criteria from a larger battery which has been discussed in detail elsewhere (23). The test-retest and interobserver reliability of the test measures are indicated in Table 5. From these figures it can be seen that there is ground for speaking with some precision about the relationships encoun- tered between psychological test perform- ance and food supplementation.
Table 6 shows the association observed between mental development test scores and supplement ingestion at various ages.
Table 6. Correlation between food supplement intake and psychological test performance.
Type of test Standard deviation (approximate)
Test scores, grouped according to levels of supplement intakea Low Medium High
F Correlation with total No. supplement testedb
intake Brazelton Neonatal
Evaluation Scale BBl
BGl
Composite Infant Scale 6 months, mental 6 months, motor 15 months, mental 15 months, motor 24 months, mental 24 months, motor 36-month battery
cognitive composite Embedded
figures, sum Embedded
figures, time Embedded figures,
adaptability Digit memory Memory for sentences Reverse discrimina-
tion learning, sum Reverse discrimina-
tion learning, time Picture-naming Recognition Verbal inferences Slow line-drawing Puzzle-solving
Average 12.2 39.69 40.00 39.54
No. tested 42 32 83
Aver age 13.5 38.83 36.00 39.05
No. tested 42 32 83
Aver age 13.8 73.8 76.3 77.8
No. tested 150 221 101
Average 14.8 70.0 70.6 72.7
No. tested 150 221 101
Aver age 12.5 62.9 67.8 72.3
No. tested 140 243 77
Aver age 15.0 73.8 77.2 82.6
No. tested 140 248 77
Aver age 12.3 61.6 65.5 68.1
No. tested 206 192 82
Average 18.5 67.5 74.4 78.9
No. tested 206 192 82
Average 280.3 -5.28 48.97 54.20
No. tested 278 237 50
Average 3.4 9.43 10.03 9.70
No. tested 270 232 50
Average 11.4 31.5 30.1 28.9
No. tested 270 232 50
Average 24.0 9.42 12.71 72.40
No. tested 270 232 50
Average 8.3 10.11 10.87 12.92
No. tested 224 197 44
Aver age 12.8 12.6 14.22 14.60
No. tested 228 210 48
Average 20.5 23.18 23.83 20.93
No. tested 232 220 45
Average 11.0 23.4 20.7 18.3
No. tested 232 220 45
Average 4.3 6.44 7.44 8.06
No. tested 262 227 50
Average 5.6 19.40 20.62 20.70
No. tested 262 227 50
Average 1.2 1.25 1.52 2.08
No. tested 120 106 12
Aver age 45.0 105.9 93.4 94.4
No. tested 250 220 50
Average 5.4 5.98 5.86 6.46
No. tested 203 223 50
.02 .66
2.87c .030 472
1.13 -.017 472
4.65d .130d 460
6.25d .134d 460
8.45d .161 480
11.61d .221d 480
2.75 .060 565
1.91 .069’
1.58 -.079c
1.48 .023
2.22 .073
1.85 .076
.38 -.061 5.13d -. 176d 5.07d .117d 2.83’ .060 3.28’ .157d 4.8qd .121d .25 .0002
-.032 157
-.042 157
552 552 552 465 486 497 497 539 539 238 520 476
aLow = under 5,000 calories per quarter for 14 quarters: medium = between 5,000 and 10,000; high = over 10,000.
bUp to 30 November 1974. CP < .05.
dP < .Ol.
310
ante on the Brazelton Neonatal Evaluation Scale was not affected. The two Brazelton variables reported here are derived from clusters of items that appeared together in factor analysis of all the test items. BBl includes negative signs of tonus, motor maturity, vigor, pull to sit, visual following and interest in the examiner, and trem- bling. BGI is in some respects the opposite of BBl, since it includes positive signs of some of the same things, including vigor, visual following, social interest in the examiner, and motor maturity.
The next set of tests corresponds to the Composite Infant Scale taken at six, 15, and 24 months of age. This scale, a mixture of psychomotor items, provides both a mental and a motor score for each of the testing
periods. At six months of age only the
mental score was significantly associated
with supplement ingestion. From age 15
months onward, however, there was a clear pattern: well-nourished subjects performed significantly better in the motor as well as the mental category. This was so both for the discrete measure of high, medium, and low levels of supplementation and for the measure of total supplement ingestion.
The individual test items used in the Composite Infant Scale at 15 and 24 months of age were examined separately. In gen- eral, the impact of supplement ingestion seems to have been more closely related to
motor and manipulative skills than to
language and other emerging cognitive
abilities. However, the tests themselves are heavily weighted with motor and manipula- tive items, since these are the principal
behavioral characteristics which infants
uniformly display at 15 and 24 months of age.
Cognitive abilities begin to emerge rapid- ly starting at three years, and for this reason performance at later ages is of interest. Psychological performance and its relation-
ship to food supplement ingestion was
examined in children 36 months of age
using a psychometric battery designed to test
PAHO BULLETIN l vol. X, no. 4, 1976
numerous and diverse skills. Of 13 variables examined, five revealed significantly better
performances by well-supplemented chil-
dren than by poorly supplemented ones and five others showed trends in this direction (Table 6). The most significant associations
were in picture-naming and recognition
(both estimates of child vocabulary) and in verbal inferences (a verbal reasoning test). The two other tests that showed a significant correlation were the response time for the reverse discrimination learning task and the line-drawing task, in which the child is asked to draw a line as slowly as possible. In both instances the food-supplemented chil- dren had better average levels of perform- ance.
At this age there were relatively few sex differences with respect to the impact of food supplementation. In general, perform- ances by boys and girls were quite compa- rable across the board, the two sexes res- ponding similarly to food supplementation with very few exceptions.
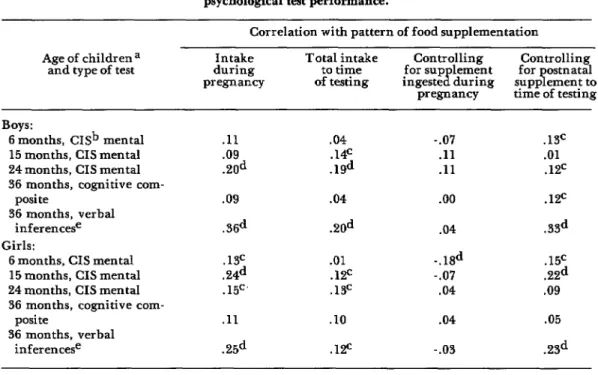
The timing of supplementation also
appeared to affect psychological test per- formance. Table 7 shows correlations and partial correlations of supplement ingestion with Composite Infant Scale mental scores at six, 15, and 24 months, and also with cognitive composite and verbal inference scores at 36 months. Column 1 gives the correlation with previous supplementation of the mother’s diet during pregnancy;
column 2 shows the correlation with
cumulative supplement ingested by the
child and its mother up to the time of test- ing; column 3 indicates the correlation of test performance with cumulative supple- mentation when maternal supplementation
during pregnancy is partialed out; and
column 4 shows the reverse of column 3: correlation with supplement ingested dur-
ing pregnancy after postnatal intake is
partialed out.
Klein et al. l MATERNAL NUTRITION 311
Table 7. Correlation between pattern of food supplementation and psychological test performance.
Correlation with pattern of food supplementation Age of children a
and type of test during Intake pregnancy
Total intake
to time for sup lement Controlling Controlling
B for ostnatal
of testing ingeste during supp ement to T pregnancy time of testing
Boys:
6 months, CISb mental 15 months, CIS mental 24 months, CIS mental 36 months, cognitive com-
posi te
36 months, verbal inferencese Girls:
6 months, CIS mental 15 months, CIS mental 24 months, CIS mental 36 months, cognitive com-
posite
36 months, verbal inferencese
.ll .09 .ZOd .09
.3ed
.w
.24d .15C’
.ll .25d
.04 .14c .19d
.04
.20d
.Ol .W .13=
.lO .lF
-.07 .ll .ll
.oo
.04
.12c
.33d
-.lSd .15c
-.07 .22d
.04 .09
.04
-.03
.13c .Ol .12c
.05
.2Sd
aTotal of 250 subjects for all but verbal inferences test. bComposite Infant Scale.
cp < .05. dp < .ol.
e120 subjects only in the combined sample of boys and girls.
even more interesting, once gestational
supplementation is removed from considera- tion there is no longer any relevant pattern of association. Moreover, the correlation
with prenatal supplementation is not di-
minished when later supplementation is
partialed out. Thus, pregnancy is the cru- cial period for supplementation as far as
later psychological test performance is
concerned.
It was recognized that the design of the
study in question, like that of many
large-scale intervention studies, does not completely eliminate the opportunities for possible confusion and subsequent misinter- pretation of results. Accordingly, a series of detailed analyses were conducted exploring other possible interpretations of the results just presented. First, associations between
food supplementation and psychological test
performance were examined among chil-
dren with the same mother. Thus, these
analyses were controlled for family socio- economic status, as well as other family- level variables. As in the case of birth- weight, statistically significant relationships emerged. That is to say, even among siblings the mother’s greater intake of supplement during one specific pregnancy was found to be associated with superior test performance later on by that particular child.
A variety of other potential contributing factors were also analyzed. These included the possible effect of: repeated psychological testing, child morbidity, level of parental cooperation with the project, differences
among the four villages. In addition,
312 PAHO BULLETIN l vol. X, no. 4, 1976
impact of attendance at supplementation centers per se on mental development, as well as the general problem of social and economic differences among the families of the children involved. For the most part,
however, these factors do not provide a
reasonable alternative explanation for the relationship observed between food supple- ment ingestion and improved psychological test performance. Curiously, at 36 months
of age there seemed to be an inverse
relationship between family socioeconomic status and food supplement intake. That is,
there was a tendency for children who
received more supplement to have lower
family socioeconomic status scores than
those who received less supplement. This tendency was not statistically significant for the total sample, although in some indivi- dual villages it was significant. In view of
this negative correlation, the superior
performance of the well-supplemented chil- dren is even more striking, since it would be
expected that if supplementation had
produced no effect the children with the
higher socioeconomic status would have
scored higher on the psychological tests. Thus, comparison of the psychological test scores of the groups receiving high, me- dium, and low levels of supplement without regard for socioeconomic status is a conserv- ative test of the association between supple- mentation and psychological performance.
A similar pattern was observed with
respect to the children’s home diet. Those in the least supplemented group tended to have more adequate home diets than those who received large amounts of supplement. For calories in the home diet this relationship was not significant; however, at all ages the
least supplemented children had more
adequate protein in their home diets than did the ones receiving high supplementa- tion.
These findings suggested that the effects of supplementation would vary according to
socioeconomic status, particularly at the
later age of 36 months. Subsequent analysis
based on socioeconomic levels (high or low) bore out this assumption. At 36 months food supplementation was found to have a greater effect on test performances by more
socioeconomically deprived children than
on performances by those who were less
deprived. For boys, the results of four
tests-embedded figures, sum of correct
responses; embedded figures, adaptability to test; recognition vocabulary; and reverse discrimination, learning time-displayed the pattern described above. For girls the
results of two tests-embedded figures,
adaptability to test, reverse discrimination, and learning time-showed patterns of this type.
There is good cause for public health
concern about children scoring in the
lowest percentiles on mental development tests; such children are probably less likely to be independent self-sufficient members of the community than those who score in the higher ranges. Consequently, a child’s relative risk of being in the lowest decile in the overall measure of mental development was calculated vis-P-vis his level of supple-
mentation (Table 8). This comparison was
based on the 36-month composite test score, which was considered the most representa- tive measure of overall cognitive perform- ance at that age.
If nutritional supplementation had no
effect on the risk of low test performance, it
would be expected that about the same
proportion of children in each of the three
nutritional groups would fall into the
lowest decile. However, analysis revealed
that the proportion of low-supplement
children in the lowest decile (13 per cent) was more than twice as great as that of the high-supplement group (6 per cent). Simi- larly, 16 per cent of the high-supplement
children scored in the highest decile,
whereas only 7 per cent of the low-supple-
ment group did. Moreover, when high
Klein et al. l MATERNAL NUTRITION 313
Table 8. Psychological test performance (36 months, cognitive composite) correlated with both food supplementation and socioeconomic status, showing relative risk
of falling into the extreme lowest or top deciles.
Supplement intake
Absolute distribution Percentage distribution
of the children tested of the children tested Chi-square test
category Lowest Intervening Highest Total Lowest Intervening Highest Total x2 df p decile deciles decile decile deciles decide
Whole sample Low supplement Medium supplement High supplement Total
Low socioeconomic statusa Low supplement Medium supplement High supplement Total
High socioeconomic status=
Low supplement Medium supplement High supplement Total
35 224 19 278
19 185 29 237
3 39 8 -iii
57 452 56 Gz-
- - - -
16 104 3 123
13 94 13 120
2 19 4 25
31 217
- - 20268
18 116 16 150
6 95 15 iii?
1 20 4 25
25 - 231 - 35 291 -
13 80
8 80
6 78
10 80
- -
13 85
11 78
8 76
12 81
- -
12 77
5 82
4 80
9 79
- -
7 100 9.4 4 <.05 12 100
16 100 10 100 - -
2 100 9.3 4 < .lO 11 100
16 iG - 7 - 1o(i
11 #lJ 5.0 4 NS 1.3 100
16 100 12 loo - -
=No socioeconomic score data were available for the families of six children.
lowest decile as opposed to the highest. At the same time, a child in the high-supple- ment group was more than twice as apt to land in the highest decile. Nutritional sup-
plementation was Ialso found to have a
significant effect for children in the eight intervening deciles.
When these analyses were done with
respect to socioeconomic status, a child with a high score but low supplementation was found to have about the same probability of being in the highest decile as in the lowest. However, a child with a low score and low supplementation had more than a sixfold greater risk of being in the lowest decile than in the highest. When all the children were considered, it was found that nutri- tional status had a greater impact on the test
performance of the high socioeconomic
scorers than on that of the low socioeco- nomic scorers.
In summary, the analyses to date suggest
that food supplementation does affect
psychological test performance. The impact can be seen reasonably clearly at 15 months of age and continues to be apparent at 24
and 36 months of age. Moreover, food
supplementation during pregnancy appears
to have a greater effect on psychological test performance than does later food supple- mentation. These findings are consistent with observations reported earlier for this project (14).
Finally, a variety of other possible factors failed to provide reasonable alternative explanations for the results reported here. However, one of these factors, socioeco- nomic status, does appear to interact with food supplementation: at 36 months chil- dren from families with low socioeconomic scores in the study population were more
affected by supplementation than were
314 PAHO BULLETIN . vol. X, no. 4, 1976
Figure 6. Correlation between caloric supplementation during pregnancy and lactation and infant mortality.
A9s of infants af dealh
CALORIC SUPPLEMEWlAlIOfl
m Low f~20.000 caloriesI
m High 1-20.000 calories1
Determinants of Infant Mortality
Figure 6 shows a comparison of caloric
supplementation during pregnancy and
lactation, with stillbirth or infant death during the first year of life. Mortality was consistently higher in the low-supplement group than in the high-supplement group. Indeed, the risk of dying during the first year of life in the high-supplement group was only half what it was in the low-supple- ment group.
The observation that improved nutrition
during pregnancy and lactation reduced
infant mortality by nearly half deserves special comment. Until now, intervention
programs aimed at combating infant mor-
tality have tended to focus on the control of infectious diseases through the provision of
adequate health services and have paid
relatively little attention to nutrition. The
present results demonstrate that nutritional
intervention may have an exceedingly
important role in reducing infant mortality among poor rural populations.
Other variables were also associated with infant mortality: low socioeconomic status, low maternal height, low gestational age, severe hypoxia at birth, and low birth- weight (15). These five variables, either
alone or in combination, can serve as useful
indicators for identifying children who
need special attention in public health programs.
Conclusions
For the rural populations studied, food
supplementation received by the mother
Klein et al. l MATERNAL NUTRITION 315
physical growth retardation among chil-
dren up to 36 months of age. Nutrition also appeared to be associated with psychological test performance. Taken together, maternal height, head circumference, and arm cir- cumference, together with family socioeco- nomic status, can be indicative of the risk of
delivering a low birthweight baby. The
efficiency of nutritional programs seeking to reduce growth retardation and infant mortality could be significantly enhanced if
efforts were concentrated on women who
are vulnerable in terms of these variables.
Final Remarks
It should be pointed out that food supple-
mentation as used in the study was an
investigative device; the technique em-
ployed would not be appropriate for
programs serving large populations over
long periods of time. In many preindustrial societies the elimination of poverty itself
would be the most effective way of
improving nutritional status and reducing the prevalence of developmental retarda- tion and infant mortality.
SUMMARY
The results of a food supplementation study conducted in four chronically malnourished rural villages in Guatemala were analyzed to determine possible effects on the study children’s early mental and physical development. One of two food supplements, stole and fresco, were given to pregnant and lactating mothers and the infants born to them up to three years of age. The level of supplement received was noted and the subsequent course of the children’s develop- ment observed.
Food supplementation of pregnant mothers was found to correlate with higher weights of their babies at birth. No other major maternal variables-home diet, body height and/or weight, morbidity, obstetric characteristics, or socioeconomic status-could account for this association.
At 36 months of age the children who had received a large amount of food supplementation showed a far lower prevalence of growth retarda- tion than did those who received smaller quantities. Again, this correlation could not be attributed to any other major maternal varia- bles.
In regard to mental development, food supple- mentation was found to correlate with better performance in psychological tests beginning at six months of age. At 36 months the correlations were significant in five different tests.
The results of this analysis have wide-ranging implications for public health. Given the rec- ognized association between low birthweight and infant mortality, they point especially to the importance of maternal nutrition during preg nancy in programs aimed at reducing this serious problem.
REFERENCES (I) Klein, R. E., J-P, Habicht, and C. Yarbrough. Some methodological problems in field studies of nutrition and intelligence. In: D. J. Kallen (ed.), Nutrition, Develo#ment, and Social Behavior. DHEW Publication No. (NIH) 73-242. Washington, U.S. Department of Health, Education, and Welfare, Public Health Service, National Institutes of Health, 1973. pp. 61-75.
(2) Lechtig, A., J-P. Habicht, H. Delgado, et al. Effect of food supplementation during pregnancy on birthweight. Pediatl-its 56:508- 520, 1975.
(3) Martorell, R., A. Lechtig, C. Yarbrough,
et al. Protein calorie supplementation and postnatal physical growth: A review of findings from developing countries. Arch Latinoamef Nutr 26:115-128, 1976.
$2’) Hansman, C. Anthropometry and related data. In: R. W. McCammon (ed.), Human Growth and Development. Charles C. Thomas, Springfield, 1970. pp. 101-154.
(3) Habicht, J-P., R. Martorell, C. Yar- brough, et al. Height and weight standards for preschool children: Are there really ethnic dif- ferences in growth potential? Lancet 1:611-615, 1974.
316 PAHO BULLETIN l vol. X, no. 4, 1976
and Panama, Division of Human Development. Nutrition, crecimiento y desarrollo. BoZ Of Sanit Panam 78:38-51, 1975.
(7) Lechtig, A., J-P, Habicht, G. Guzman, et al. Morbilidad materna y crecimiento fetal en poblaciones rurales de Guatemala. Arch Latinoamer Nutr 22~243-253, 1972.
(8) Alford, C. A., J. W. Fort, W. J. Blankenship, et al. Subclinical central nervous system disease of neonates: A prospective study of infants born with increased levels of IgM. J Pediatr 75:1287-1291, 1969.
(9) Lechtig, A., L. J. Mata, J -P Habicht, et al. Levels of immunoglobulin M (IgM) in cord blood of Latin American newborns of low socio- economic status. Ecol Food Nutr 3171-173, 1974.
(10) Lechtig, A., H. Delgado, R. E. Lasky, et al. Maternal nutrition and fetal growth in developing societies: Socioeconomic factors. Am J Dis Child 129:434-437, 1975.
(II) Chase, H, C. Infant mortality and weight at birth: 1960 United States birth cohort. Am J Public Health 59:1618-1628, 1969.
(12) Lechtig, A., H. Delgado, C. Yarbrough,
et al. A simple assessment of the risk of low birth- weight to select women for nutritional interven- tion. Am J Obstet Gynec 125:25-34, 1976.
(13) Klein, R. E., J-P Habicht, C. Yarbrough, et al. Empirical findings with methodological implications in the study of malnutrition and mental development. In: Nutrition, the Nervous System, and Behavior. PAHO Scientific Publi- cation 251. Washington, Pan American Health Organization, 1972. pp. 43-47.
(14) Klein, R. E., C. Yarbrough, R. E. Lasky, et al. Correlations of mild to moderate protein- calorie malnutrition among rural Guatemalan infants and preschool children. In: Symfiosia of the Swedish Nutrition Foundation XII. Uppsa- la, Almquist and Wiksell Informations-industri AB, 1974. pp. 168-180.