Vol. 21, No. 1
March 2000
IN THIS ISSUE . . .
• Concepts and Methods in Epidemiology:
An integrated approach to communicable disease surveillance • Elimination of Leprosy in the Americas
An Integrated Approach to Communicable Disease Surveillance
Effective communicable disease control relies on effec-tive response systems and effeceffec-tive response systems rely on effective disease surveillance. A functional surveillance system is essential in providing information for action on priority communicable diseases; it is a crucial instrument for public health decision-making in all countries. Surveillance data provide information, which can be used, for priority set-ting, policy decisions, planning, implementation, resource mobilization and allocation, and prediction and early detec-tion of epidemics. A surveillance system can also be used for monitoring, evaluation and improvement of disease preven-tion and control programs. Disease surveillance is thus a critical component of the health system since it provides es-sential information for optimal health care delivery and a cost-effective health strategy.
Current situation
Many countries conduct surveillance activities for com-municable diseases in order to monitor those with a high burden, detect outbreaks of epidemic-prone disease and monitor progress towards the national or international con-trol or eradication targets set for endemic diseases. Surveil-lance activities have developed in an uneven way however, reflecting the particular history of infectious disease threats and the response to them in individual countries. Today most surveillance activities are supported and managed by a vari-ety of vertical disease-control programs. Some are effective and linked to well-supported programs, while others have lost momentum, are poorly maintained or have virtually col-lapsed. In some cases the surveillance function is far removed from any corresponding action such as disease control ef-forts, outbreak response, health resource allocation or na-tional health policy.
Outdated surveillance systems, in which new surveil-lance targets have been added but old ones never removed, often lead to central bodies collecting huge amounts of data with little or no analysis and use of the corresponding infor-mation. Feedback to the data collectors is rarely provided. The surveillance system becomes driven by the need to col-lect and move data while scant attention is given to using the data at each level of the health service for decision-making.
National surveillance data on infectious diseases is usu-ally collected by programs under different authorities, inclu-ding the ministry of health (diseases and health system moni-toring), the ministry of agriculture (environment, animals, plants and food products) and the ministry of the interior (central statistics offices). In addition, academic or research institutes may conduct specific surveillance activities while the private sector and nongovernmental organizations (NGOs) may also run surveillance systems in their area of interest. Within the health sector, multiple surveillance sys-tems may operate in parallel, sometimes in complete indepen-dence. This problem can be exacerbated by the influence of strong outside donors who may support specific surveillance and control programs.
Establishing surveillance activities within vertical pro-grams allows the surveillance and control functions to re-main closely linked. On the other hand, the overall surveil-lance function in a country may become badly disjointed and inefficient, with field workers participating in multiple compli-cated systems, which use different surveillance methodolo-gies, terminology, and reporting frequencies and forms. This leads to extra costs and training requirements, and often re-sults in health workers becoming overloaded and
demotiva-• Norms and Standards in Epidemiology:
ted. Furthermore, new priorities such as surveillance of anti-microbial drug resistance need to be addressed across verti-cal programs.
Paradigm shift – An integrated approach to sur-veillance
Integrated surveillance of communicable diseases is the sum of all surveillance activities which add up to the national surveillance system. The various surveillance activities be-come integrated into one system within the broader national health information system.
One national surveillance system
An integrated approach to communicable disease sur-veillance envisages all sursur-veillance activities in a country as a common public service, which carries out many functions using similar structures, processes and personnel. The sur-veillance activities that are well developed in one area may act as driving forces for strengthening other surveillance activities, offering possible synergies and common resour-ces.
Specialized surveillance systems are important, especially where surveillance is complex and has specific data needs. For example, eradication and elimination programs require strong surveillance systems aimed at detecting every case. Yet although specific disease control programs require dif-ferent surveillance data, they all require similar core activities (case detection, reporting, investigation, confirmation, ana-lysis, interpretation and action) and support functions (sur-veillance standards, epidemiology training, supervision, geo-graphical mapping, communications, laboratory support and financial resources).
It should thus be possible to envisage a holistic ap-proach, which takes into consideration all core activities and support functions, in order to strengthen the national sur-veillance system through coordination, prioritization and streamlining of all surveillance activities.
On the basis of an inventory of surveillance activities and the prioritization of surveillance targets, a gap analysis can be carried out, possible synergies identified, and existing activities reoriented as needed, while at the same time recog-nizing the special needs of individual programs. Integration should focus particularly on the support functions of all indi-vidual surveillance systems.
One national network of people
Personnel that contribute to the national surveillance and response system are the most valuable part of the
sys-tem itself. Whether at the peripheral, intermediate or national level, each individual plays an essential role to ensure that the system is functional, appropriate, timely and responsive. Experience has shown that the human factor is more impor-tant that the design of the surveillance system. In this per-spective, it is essential that appropriate training, support, feedback and motivation be guaranteed within the design of the surveillance system, and through its supervision and overall support mechanisms.
It is essential that feedback loops be built into national surveillance systems. This may be a regular epidemiological bulletin or website with tables and graphs showing trends, progress towards targets, and reports on the investigation and control of outbreaks. To maintain the momentum for the surveillance effort, it is crucial that the personnel involved in surveillance activities regularly see the impact of their work, since at the peripheral level it is usually done in addition to a heavy clinical workload.
Participants in the surveillance system should be pro-perly trained for their surveillance tasks, through both initial and ongoing inservice training. In an integrated multi-dis-ease approach, field or intervention epidemiology training will provide general surveillance and response skills, which can be applied almost anywhere in the system and for any disease surveillance and response needs. General surveil-lance and response skills are crucial in the event of the emer-gence of diseases not anticipated by the surveillance sys-tem. Short-term and long-term training courses in field epide-miology should be available in all countries.
Training in laboratory techniques should also take an integrated multidisease approach where the same or a similar technique (e.g. microscopy, serological assay) is used to di-agnose various diseases. The integrated approach to train-ing should also encourage basic laboratory traintrain-ing for epi-demiologists and some epidemiology training for laboratory technicians, in order to ensure that both groups understand each other’s needs and approach to surveillance.
National coordination
Coordina-tion is indispensable to provide overall supervision, identify possible synergies between activities and develop norms and standards for the surveillance system.
At the regional level, coordination of all national surveil-lance systems is also required through regional prioritiza-tion, standardization and the strengthening of integrated multidisease epidemiological and laboratory capacity. Spe-cific regional capacity may be needed, such as regional refer-ence laboratories, regional epidemic response teams and re-gional stocks of supplies (e.g. vaccine and drug storage).
At the international level the need to coordinate surveil-lance and response activities is growing with the increasing globalization of trade and travel. Global surveillance stan-dards for communicable diseases are recommended by WHO to support the global analysis of surveillance data through common terminology, common case definition and common surveillance methods.
Assessing the national surveillance system Because of the changing pattern of infectious disease threats reflecting the dynamism of the microbial world, coun-tries need to assess regularly the targets of their overall sur-veillance and response systems. The priorities of a national surveillance system should take into account the burden of each disease, but also the global and regional changes in disease epidemiology and their likely impact. The emergence of antimicrobial drug resistance, the possibility of new e-merging diseases and the possible impact of environmental changes should be carefully considered. Also, global targets such as those of eradication and elimination programs should be included as appropriate.
Any assessment should aim to develop or update a na-tional plan for communicable disease surveillance so that the national surveillance and response system is improved over-all. In a given country, it should bring together all those who have responsibility for surveillance of communicable dis-eases and assess systematically the national surveillance ac-tivities as one system. There should be participation where possible from those working in public sectors other than the health sector, such as the agricultural sector. In addition, the private sector and other relevant partners such as NGOs should be included in the assessment. The integrated or multidisease approach to assessment of the national surveil-lance system may be based on the WHO protocol developed
and field-tested in several countries and may complement the assessment of individual systems as developed by CDC. More specific multidisease assessment guidelines have also been developed by WHO for vaccine-preventable diseases and are under development for antimicrobial resistance sur-veillance.
Taking advantage of news tools
The arrival of electronic tools in all countries has already changed surveillance activities, going in the direction of in-tegrated multidisease surveillance. Electronic reporting of sur-veillance data is increasingly common, initially using diskettes and now using web-based reporting mechanisms.
Thanks to electronic databases, data can be analyzed more easily and rapidly and when geographical information is available, they can be linked to geographical information systems (GIS).1 The joint WHO-UNICEF HealthMap project,
initially developed and successfully used by the program for eradication of guinea-worm disease, has evolved into a multi-disease tool for data collection, mapping and geographical analysis. It provides a unique possibility for multidisease, multilevel and multisectoral surveillance. The dissemination of surveillance data and their presentation to a wider audi-ence, as well as internal feedback, are now also achieved through dedicated websites and compact disks.
The difficulties related to the timely collection of disease specific data have led to the concept of collecting informa-tion about syndromes. This syndromic approach is used suc-cessfully by the poliomyelitis eradication program, which collects data on acute flaccid paralysis (AFP) caused by sev-eral infectious or non-infectious diseases, but that will trig-ger an immediate response from the poliomyelitis surveillance system. The same approach could be applied in areas where rapid laboratory diagnosis cannot be obtained (such as at the periphery of many health systems). Although lacking specificity, the syndromic approach offers: a simple and sta-ble case definition; reliability (as it reports what is actually seen); immediate reporting (as there is no laboratory delay); a wider surveillance coverage allowing for the detection of emerging diseases; and, in some cases, the avoidance of dis-ease-associated stigma. This approach is complementary to a disease-specific list of notificable diseases, and is also be-ing considered in the context of the revision of the Interna-tional Health Regulations.
Investing in surveillance
A national plan to strengthen surveillance of priority diseases is the starting point for a long-term obligation to which governments and countries, at all levels, must be com-mitted. The success of national surveillance will depend heavi-ly on the highest political commitment and significant finan-cial support.
In 1999, the Director-General of WHO issued a call to invest in healthy development, which should also translate into investing in disease surveillance.2 Disease surveillance
is a long-term effort that requires investment in national ca-pacity-building, such as laboratory strengthening and field epidemiology training. Short-term and relatively low invest-ment can rapidly have a visible impact in the specific area of epidemic surveillance and response. However, the overall strengthening and sophistication of routine surveillance sys-tems is critical but necessarily more costly, and can only pro-duce tangible results on a mid- or long–term basis.
Investing in surveillance should take into account the investment already made to support specific control, elimina-tion or eradicaelimina-tion programs, and transform these time-li-mited efforts into a long-term undertaking, capitalizing on special efforts such as the onchocerciasis control program in the African Region and the global poliomyelitis eradication program. Since disease surveillance is a basic component of a health information system, and thus also of a national health system, partnership with development agencies (whether in-ternational, governmental or nongovernmental) is essential to improve national surveillance and response systems. This is particularly true in the context of health sector reform and other long-term development projects.
Lessons learnt and conclusion
There is little doubt that coordination streamlines both the surveillance and response activities, minimizes their cost and improves the overall efficiency of the national surveil-lance system. Building or strengthening national and region-al capacity can be achieved through 4 elements: training in epidemiology; laboratory strengthening; improved commu-nications infrastructure; and special attention to the health care sector, public or private, that constitutes the surveil-lance front-line. In addition to the lack of adequate supervi-sion and coordination, experience has shown that the central
level too often criticizes the periphery for insufficient report-ing, while not being geared itself to quickly analyze and re-spond to information coming from the periphery. This illus-trates the potential value of an integrated multidisease ap-proach to the assessment of national surveillance systems, with the participation of external experts.
In the area of epidemic surveillance and response, public health authorities should give more attention to information from sources other than the public health sector, including NGOs and the media. The capacity of public health authori-ties to rapidly respond to outbreak-related information from any source is essential for the efficiency and credibility of the entire surveillance effort. In order to achieve such credibility, building an integrated multidisease response capacity should be the first step towards improving national and regional surveillance systems, the second step being to build on ex-isting and successful surveillance activities.
A special effort is needed to design quality indicators for a multidisease surveillance and response system. It should take into account not only the need for generic universal indicators, but also the diversity of national surveillance sys-tems and their specific situations.
Overall, the commitment of all interested parties, includ-ing health and other sectors such as agriculture and com-merce, whether public or private, and the resolute support of the highest national authorities, are essential for the success of an integrated multidisease national surveillance and re-sponse system.
Source: This article was initially published in WHO’s Weekly Epidemi-ological Record, Vol. 75, No. 1 (2000). To obtain more information and download the documents mentioned in this article, please refer to: http://www.who.int/emc/surveill/index.html.
2WHO Report on Infectious Diseases – Removing obstacles to healthy development.
Two conferences on the elimination of leprosy in the Region of the Americas and in the world took place during the month of November 1999. The Third PAHO/WHO Re-gional Conference on the Elimination of Leprosy from the Americas was held in Caracas, Venezuela from 3 to 5 Novem-ber, in order to define a plan of action for the Region of the Americas. Convened by WHO from 15 to 17 November, the
Third International Conference for the Elimination of Lep-rosy took place in Abidjan, Ivory Coast, and led to the an-nouncement of the “Global Alliance to Eliminate Leprosy as a Public Health Problem in every country by the year 2005.” This initiative will give the effort against leprosy its final impulse.
The implementation of multidrug therapy (MDT) has dra-matically changed the epidemiological situation of leprosy in the Region of the Americas. The number of registered cases decreased from 369,846 in 1992 to 88,053 in 1999, while the detection rate per 10,000 population slightly increased at the regional level in the same period, with important progress in some countries such as Brazil. The geometrical mean of the annual decrease of the prevalence rate, now at the level of 18.7%, also reflects a decrease in the number of countries where leprosy is a public health problem, from 14 to 2 in Latin America1 (Brazil and Paraguay), and from 27 to 3 in the
Amer-ican continent as a whole.
The elimination of leprosy from the Americas by the year 2000, through a decrease of the prevalence rate to a level below 1 case per 10,000 population, is a reachable goal that involves a reduction in the current number of registered cases of less than 10% in most countries. In the case of Brazil, where the reduction from 75,000 to 16,000 registered cases is more significant, leprosy could be eliminated within 3 to 4 years.
The countries of the American Region can be classified into the five following groups, based on different levels of priority and according to criteria such as prevalence rate, absolute number of registered cases and newly detected cases in 1998:
•
Group 1: Brazil. This country is a top priority since it represents between 80 and 90% of the total burden of leprosy in the continent. Consequently, special and in-tensified efforts will be required to eliminate the diseasethrough the active involvement of municipalities.
•
Group 2: Paraguay and Suriname. Neither country haseliminated leprosy at the national level, but both present less than 1,000 registered cases, and initiatives to accel-erate the elimination of leprosy should be put in place in these countries.
•
Group 3: Argentina, Colombia, Mexico and Venezuela. These countries have already eliminated leprosy at the national level, but still present over 1,000 registered cases.•
Group 4: Cuba and the Dominican Republic. Both have eliminated leprosy at the national level and have less than 1,000 registered cases, but more than 200 new cases were detected in 1998.•
Group 5: the other countries of the Region, with the ex-ception of Chile (where leprosy is not endemic), the En-glish-speaking Caribbean islands, Canada and the United States of America. These countries present more favorable official indicators. Some Central American coun-tries had achieved elimination before MDT was imple-mented. In the other countries, difficulties with the infor-mation systems require detailed validation of the official data.In the case of Latin America, due to the socioeconomic situation and some characteristics of the national health sys-tems, it is reasonable to suspect that the elimination pro-grammes did not detect all of the existing cases in the area. Consequently, a hidden prevalence could exist, which can be estimated from the characteristics of the newly detected cases. Its importance was characterized in the following study, which includes some countries of Latin America only, due to the lack of data for the other countries.
In a group of 9 Latin American countries2 representing
around 80% of the population and of the leprosy prevalence in all the countries where leprosy was eliminated at the na-tional level, the hidden prevalence was estimated at 5,000 cases. From this figure, it can be estimated that there are about 7,000 unknown cases in Latin American countries that have already eliminated leprosy, i.e. excluding Brazil and Par-aguay.
In order to emphasize the importance and priority of the
1 Latin-America includes: Argentina, Bolivia, Brazil, Colombia, Costa Rica, Cuba,
Dominican Republic, Ecuador, Guatemala, Haiti, Mexico, Nicaragua, Paraguay and Venezuela.
Elimination of Leprosy in the Americas
2 Argentina, Bolivia, Colombia, Cuba, Dominican Republic, Ecuador, Mexico, Perú,
leprosy problem in areas where the elimination at the national level has already occurred, another group of 8 Latin Ameri-can countries3 where leprosy was eliminated was
consi-dered. Again, this sample included 80% of the population and of the leprosy prevalence in all the countries with elimi-nated leprosy at the national level. In these countries, ap-proximately 30 million people live in the territories of the first sub-national level (state, province or department) where lep-rosy has not been eliminated. Thus we can estimate that about 40 million people live in areas where leprosy is still a public health problem, in countries of Latin America where leprosy is considered to be eliminated at the national level. Further, of the 191 entities forming the first sub-national lev-el, 37 (19%) have not eliminated leprosy.
Therefore, elimination strategies should be sustained even when a given country has reached elimination of lepro-sy at the national level. Two steps are involved in the inte-grated approach to insure political commitment and technical cooperation:
•
The first step is confirmation, with prevalence as an indi-cator. In the confirmation stage, entities are classified according to their respective estimated prevalence rate and different strategies are put in place in order to eval-uate hidden prevalence. Once the search and evalua-tion of the hidden prevalence are achieved, if it is con-firmed that the prevalence is below one case per 10,000 population, other strategies will be implemented in order to confirm this “status”, using detection (incidence) as an indicator through the promotion of community aware-ness and training of local health teams.•
At a later stage, when no case is detected after a five-year period, the progressive introduction of an epidemi-ological surveillance system adequate for a low preva-lence scenario is proposed, using tools such as sentinel surveillance and zero reporting, until the interruption of transmission is reached, which means that the area is no longer endemic for leprosy.The “Global Alliance” proposed the following key strat-egies for the 2000-2006 period: 1) implement the diagnostic and treatment of leprosy in all the services of the endemic area; 2) guarantee the availability of free MDT treatment in health centers through appropriate logistic; 3) motivate peo-ple to ask for treatment, through creative and higher quality interventions, to spread the information on signs and symp-toms of the disease; 4) ensure high healing indices through
the introduction of innovative and flexible systems of admin-istration of MDT; and 5) monitor actively the situation to adopt appropriate actions to solve the detected problems rapidly.
In order to accelerate progress towards elimination of leprosy in Brazil, Paraguay and Suriname and to build inno-vative strategies to validate and consolidate the results ob-tained in the other countries, a pro-active and susob-tained ef-fort is proposed, through the implementation of a Regional Plan coordinated by PAHO/WHO. As agreed during the Vene-zuela conference, this action plan will be elaborated in 2000. From the time of its formulation, it should count on the full commitment of a wide spectrum of partners, and a close col-laboration between health care providers and users at every level of leprosy care. The objectives of the Regional Plan should be to prevent the re-emergence of the disease as well as, through the use of new technologies, the total interrup-tion of its transmission, i.e. the eradicainterrup-tion of leprosy from the Americas.
3 Argentina, Bolivia, Colombia, Cuba, Mexico, Peru, Dominican Republic, and
Venezuela
Situation of Leprosy in Latin Am erica - 1998
COUNTRY Registered Cases
Rate Prev. per 10,000
New cases
Rate Detected per 10,000
Coverage MDT (%)
Argentina 2,624 0.73 569 0.16 100
Bolivia 302 0.38 31 0.04 ...
Brazil* 75,000 4.54 44,000 2.66 99
Colombia 2850 0.76 586 0.16 99.9
Costa Rica 143 0.39 14 0.04 43.4
Cuba 597 0.54 246 0.22 98.8
Dominican Rep. 346 0.42 220 0.27 96
Ecuador 373 0.31 110 0.09 100
El Salvador 43 0.07 5 0.01 100
Guatemala 50 0.04 5 0 100
Haití 924 1.23 50 0.07 ...
Honduras 76 0.12 ... ... ...
Mexico 2,320 0.24 415 0.04 78
Nicaragua 114 0.26 42 0.1 100
Panama 15 0.06 4 0.01 86.7
Paraguay 652 1.25 362 0.69 100
Peru 266 0.11 107 0.04 89.5
Uruguay 14 0.04 10 0.03 100
Venezuela 1,344 0.58 662 0.28 99.6
Latin America 88,053 1.86 47,438 1.00 96.9
Sources: 1) SIL/PAHO; 2) WHO; 3) Population: PAHO/WHO, Health Situation in the Americas - Basic Indicators 1998
(*) Estimated (… ) Data not available
Argentina: Health Situation Analysis and Trends, 1986-1995
The following study attempts to discover patterns of geographical and socioeconomic distribution, by age, sex, and Years of Potential Life Lost (YPLL), considering total, child, and maternal mortality as well as health trends, mainly for the period 1986 to 1995.
Death certificates1 corresponding to the period of the
study were reviewed, in which the causes of deaths were coded according to the International Classification of Dis-eases (ICD-9), and population projections from the National Institute of Statistics and Census (INDEC)2 were used as
well. The causes of death were classified in 15 groups, as in previous studies.3 The mortality rates were adjusted by age
and sex, and YPLL were calculated for every group of causes. The resulting indicators were stratified according to 5 geographical regions, in which the mortality gaps were analyzed.
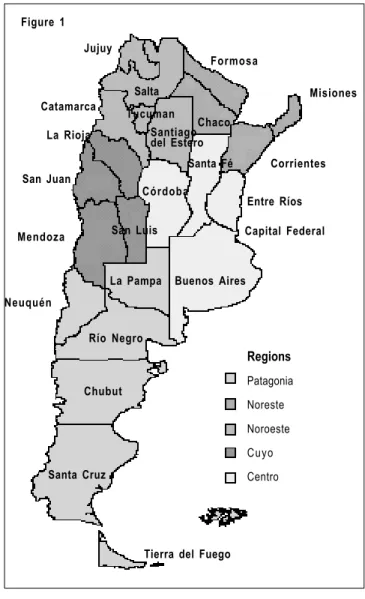
Argentina has an area of 2,780,400 km2, with a
popula-tion of 36.1 million inhabitants (1998) and an average densi-ty of population of 12.8 inhabitants by km2. The country is
highly urbanized with 88% of the population living in urban areas and more than 50% residing in the five larger cities.
Argentina is a federal country that comprises 23 inde-pendent provinces and a Federal Capital (figure 1). Each province has its own constitution, with its own executive, legislative and judicial branches. The president is elected by direct popular vote every four years and can be reelected only once.
The gross domestic product (GDP) of Argentina in 1997 was of 323.4 billion dollars, corresponding to a per capita GDP of US$9,066. The parity of the Peso to the US dollar has
been kept since 1991. The principal productive and econo-mic activities include agriculture, livestock, trade, and ser-vice industries. It is estimated that 42% of the population is economically active (1997) and the official unemployment rate was of 12.4% in 1998.
The health sector is divided into three sub-sectors: a public health sector, a social works sector and a private sec-tor that includes pre-payment and personal fee-for-service mechanisms. The per capita health expenditures were US$795 in 1995, of which 45% corresponded to the public sector and
1 Ministry of Health, Argentina. Vital Statistics. Basic Information.1986- 1995 2 INDEC: Statistical Report of the Republic of Argentina, 1996
3 Ministry of Health and Social Action, Argentina and Pan American Health Orga-nization, “Perspectiva Epidemiológica Argentina” 1996. The 15 groups of causes are: cardiovascular diseases, cancer, infeccious diseases, accidents, other abdomi-nal diseases, respiratory diseases, metabolic causes, urinary diseases, perinatal causes, violence, birth defects, other perinatal causes, maternal causes, ill-defined and other causes.
Figure 1
Regions
Patagonia
Noreste
Noroeste
Cuyo
Centro
Misiones Formosa
Jujuy
Río Negro Neuquén
Mendoza
Salta Catamarca
Santa Cruz Chubut
La Pampa San Juan
Corrientes La Rioja
Tierra del Fuego
Entre Ríos Córdoba
Buenos Aires
Capital Federal San Luis
Santiago del Estero Tucuman
Chaco
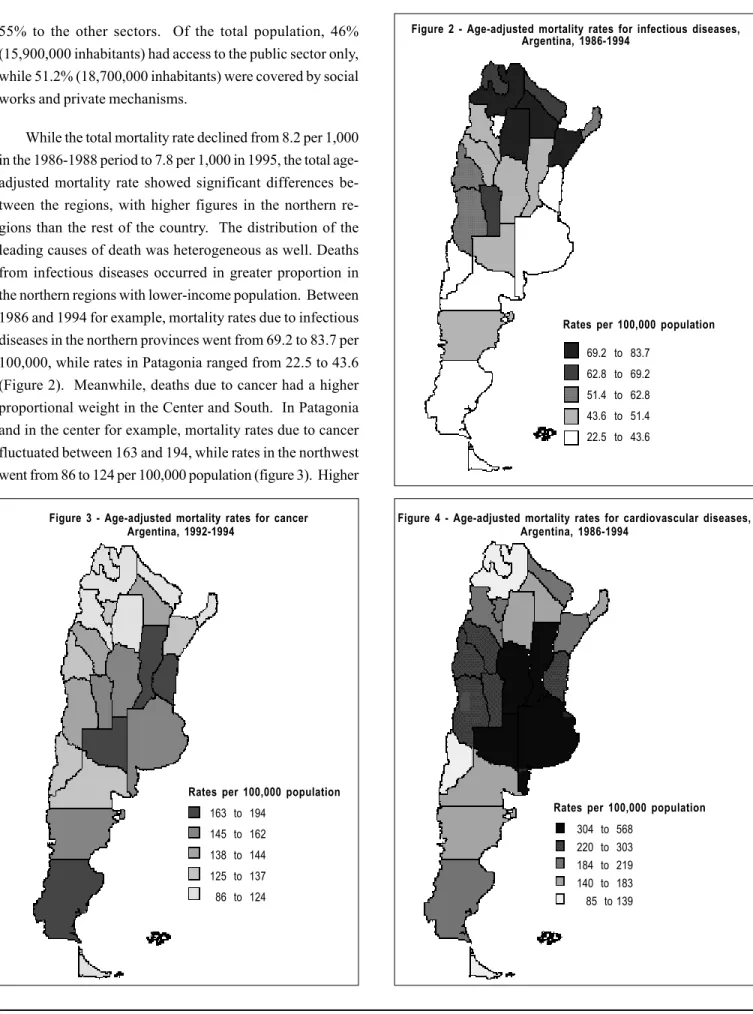
55% to the other sectors. Of the total population, 46% (15,900,000 inhabitants) had access to the public sector only, while 51.2% (18,700,000 inhabitants) were covered by social works and private mechanisms.
While the total mortality rate declined from 8.2 per 1,000 in the 1986-1988 period to 7.8 per 1,000 in 1995, the total age-adjusted mortality rate showed significant differences be-tween the regions, with higher figures in the northern re-gions than the rest of the country. The distribution of the leading causes of death was heterogeneous as well. Deaths from infectious diseases occurred in greater proportion in the northern regions with lower-income population. Between 1986 and 1994 for example, mortality rates due to infectious diseases in the northern provinces went from 69.2 to 83.7 per 100,000, while rates in Patagonia ranged from 22.5 to 43.6 (Figure 2). Meanwhile, deaths due to cancer had a higher proportional weight in the Center and South. In Patagonia and in the center for example, mortality rates due to cancer fluctuated between 163 and 194, while rates in the northwest went from 86 to 124 per 100,000 population (figure 3). Higher
Figure 2 - Age-adjusted mortality rates for infectious diseases, Argentina, 1986-1994
69.2 to 83.7
62.8 to 69.2
51.4 to 62.8
43.6 to 51.4
22.5 to 43.6
Rates per 100,000 population
Figure 4 - Age-adjusted mortality rates for cardiovascular diseases, Argentina, 1986-1994
304 to 568 220 to 303 184 to 219 140 to 183 85 to 139
Rates per 100,000 population Figure 3 - Age-adjusted mortality rates for cancer
Argentina, 1992-1994
163 to 194
145 to 162
138 to 144
125 to 137
86 to 124
mortality rates due to cardiovascular diseases were regis-tered in the Center and Cuyo, showing a correlation with the most developed areas (figure 4). Within the regions except in the northeastern, the differences in mortality from those cardiovascular diseases were greater among women.
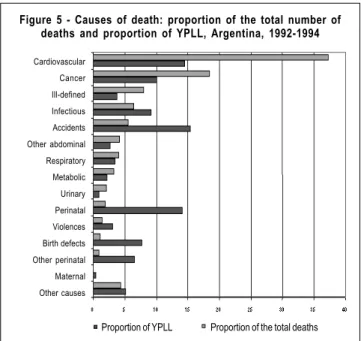
Even though cardiovascular diseases constituted the leading cause of death, accidents were responsible for the greatest number of years of potential life lost (YPLL), with 16% compared to about 14% for perinatal causes and car-diovascular diseases (figure 5). Similarly, perinatal diseas-es, birth defects, infectious diseases and violences took greater weight when the YPLL were considered.
Infant mortality declined from 26.9 per 1,000 live births in 1986 to 18.8 in 1997 but this reduction differed in the different regions. Patagonia showed the more significant decrease, with 38.7%, compared to a reduction of only 28.4% in the Northeastern region (Figure 6). This difference is even more remarkable when considering that Patagonia had one of the lowest, and the northeast one of the highest infant mortality rates (IMR) at the beginning of the period. Consequently, inequity is currently greater than at the be-ginning of the period. Significant infant mortality gaps were also found within each region.
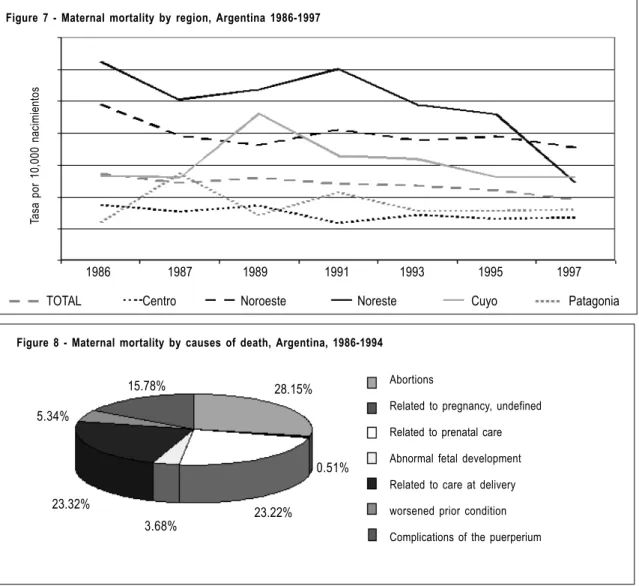
Maternal Mortality showed a pattern similar to infant and total mortality. The regions of the Northeast and of the Northwest presented rates twice and three times higher than the regions of the Center and Patagonia (figure 7). The leading causes of these deaths were related to abortions (28.1%), prenatal care (23.2%) and delivery care (23.3%) (fig-ure 8).
Different mortality patterns were discovered between regions and provinces. Although climatic and lifestyle fac-tors could partly explain these differences, socioeconomic and demographic factors are more closely related to the ine-quities and gaps that were found. The northern regions, where the proportion of people living in poverty is higher, show worse health indicators. Some of these differences were larger at the end of the period of analysis.
Figure 5 - Causes of death: proportion of the total number of deaths and proportion of YPLL, Argentina, 1992-1994
Proportion of YPLL Proportion of the total deaths
Cardiovascular Cancer Ill-defined Infectious Accidents Other abdominal Respiratory Metabolic Urinary Perinatal Violences Birth defects Other perinatal Maternal Other causes
Rates per 1,000 live births
38.7%
34.6%
28.4%
33.7%
28.3%
30.1% 24.8%
15.2%
8.3%
18.5%
34.9%
25.0%
30.9%
20.5%
24.4%
17.5%
26.9%
18.8%
Patagonia
Cuyo
Noreste
Noroeste
Centro
TOTAL
1986
1997 Figure 6 - Changes in infant mortality by region,
1986 1987 1989 1991 1993 1995 1997
Figure 7 - Maternal mortality by region, Argentina 1986-1997
TOTAL Centro Noroeste Noreste Cuyo Patagonia
Tasa por 10,000 nacimientos
This book is addressed primarily to medical and public health students, clinicians, health professionals and all those seeking to under-stand the principles and methods used in cancer epidemiology. Its aim is not to con-vert the readers into epidemiological experts but to make them competent in the use of basic epidemiological tools and capable of exercising critical judgement when asses-sing results reported by others.
The book is designed to provide an easy understanding of the basic concepts and methods through the use of illustrative
ex-Cancer Epidemiology: Principles and Methods
International Agency for Research on Cancer (IARC)
amples, often using real research data. Knowledge of statistics is indis-pensable to the proper conduct, analysis and interpretation of epidemiolo-gical studies. Thus, statistical concepts (and formulae) are also presented but the emphasis is on the interpretation of the data rather than on the actual calculations.
To obtain a copy of the English version of Cancer Epidemiology please contact WHO Fax: (41-22) 791-4857; E-mail [email protected]. For the Spanish version within Latin America, please contact PAHO, Fax: (301) 206-9789; E-mail: [email protected]; Internet: http:// publications.paho.org
1999, 442 pp., ISBN 92 832 0405 0 US$40.00
Figure 8 - Maternal mortality by causes of death, Argentina, 1986-1994
15.78% 28.15%
0.51%
23.22% 3.68%
23.32% 5.34%
Abortions
Related to pregnancy, undefined
Related to prenatal care
Abnormal fetal development
Related to care at delivery
worsened prior condition
Complications of the puerperium
Source: Verdejo G, Bortman M. Study presented during the XV Inter-national Scientific Meeting of the IEA, Italy,1999.
Case definitions
Neonatal Tetanus
Rationale for surveillance
Neonatal tetanus was targeted for elimination (9GPW) by WHO. In the American Region, the 3 primary strategies to-wards this goal are: 1) identification of high risk areas; 2) vaccination of all women of child-bearing age who live in at-risk municipalities; and 3) clean delivery and post-deli-very practices.
Epidemiological surveillance is particularly useful in order to identify high-risk areas and monitor the impact of interven-tions
Recommended case definition
Suspected case: Any infant with a history of tetanus-com-patible illness during the first month of life that fed and cried normally for the first 2 days of life;
Or: Any neonatal death (death within the first 28 days after birth) in a child who could suck and cry normally during the first 48 hours of life.
Confirmed case: A confirmed case of neonatal tetanus de-fined as a child with a history of all three of the following: 1) normal feeding and crying for the first 2 days of life; 2) onset of illness between 3 and 28 days of life; and 3) inability to suck (trismus), followed by stiffness (generalized muscle ri-gidity) and/or convulsions (muscle spasms).
Discarded Case: A discarded case is one that has been investigated and does not fit the case definition. The diag-nosis should be specified. A summary of diagnoses for dis-carded cases should be made routinely.
Recommended types of surveillance
The number of confirmed neonatal tetanus cases must be included in routine monthly surveillance reports of all coun-tries and reported as a separate item from other (non-neona-tal) tetanus. Even if there are no cases, the mention of “zero case” in the report is required, as well as active surveillance in major health facilities on a regular basis (at least once a year). In “low risk” geographical areas (incidence<1/1000 live births with effective surveillance), all suspect cases should be investigated to confirm the case and identify the
cause. Community surveillance is recommended in “silent” areas (i.e. where routine reporting is not functional but where, based on socioeconomic indicators, neonatal tetanus could be a problem).
Recommended minimum date elements
Aggregated data for reporting
•
Number of cases.•
Number of TT1, TT2 or TT3 doses administered to wo-men of bearing age and number of wowo-men of child-bearing age who live in the municipality.•
Completeness / timeliness of monthly reports.Case-based data, individual patient records for investigation: (i) Unique identifier, (ii) Geographical information, (iii) Date of birth, (iv) Age (in days) of infant at onset, (v) Sex of infant, (vi) Parity of mother (total number of deliveries including current delivery or pregnancy), (vii) Date of case investiga-tion, (viii) Type of birth: 1=institution; 2=home with trained attendant; 3=home with untrained attendant; 4=home with-out attendant; 5=other; 9=unknowm, (ix) Tetanus immu-nization status of mother when she gave birth: 1=up-to-date; 2=not up-to-date; 3=unimmunized; 9=unknown, (x) Final clas-sification: 1=confirmed; 2=suspected; 3=discarded, (xi) Mother given protective TT dose within 3 months of report: 1=yes; 2=no; 9=unknown, (xii) Supplemental immunization conduct-ed within same locality as case: 1=yes; 2=no; 9=unknown.
Principal use of data for decision-making
•
Monitor progress towards achieving and sustaining high routine TT2+ coverage in high-risk areas.•
Monitor progress towards eliminating neonatal tetanus in every geographical area.•
Investigate suspected neonatal tetanus cases in areas not considered at risk for neonatal tetanus to confirm and determine cause.Tuberculosis
Rationale for surveillance
The overall objective of tuberculosis (TB) control is to reduce mortality, morbility and transmission of the disease until it no longer poses a threat to public health. To achieve this objective, the 1991 World Health Assembly endorsed the following targets for global tuberculosis control: suc-cessful treatment for 85% of the detected new smear-posi-tive cases and detection for 70% of smear-posismear-posi-tive cases by the year 2000.
About one third of the world’s population is infected by
Mycobacterium tuberculosis. Between 7 and 8.8 million new cases occur each year, 95% in developing countries; some 3.3 million cases of tuberculosis are notified each year. Pro-jections into the next century suggest that the impact of tu-berculosis will increase if no adequate control is established immediately in all countries. Surveillance of tuberculosis helps obtain an accurate picture of the course of the epidemic in a community over time so as to allow timely intervention.
Recommended case definition:
Pulmonary tuberculosis, sputum smear positive (PTB+):
•
Tuberculosis in a patient with at least two initial sputum smear examinations (direct smear microscopy) positive for Acid-Fast Bacilli (AFB), or•
Tuberculosis in a patient with one sputum examination positive for acid-fast bacilli and radiographic abnorma-lities consistent with active pulmonary tuberculosis as determined by the treating medical officer, or•
Tuberculosis in a patient with one sputum specimen positive for acid-fast bacilli and at least one sputum that is culture positive for acid-fast bacilli.Pulmonary tuberculosis, sputum smear negative (PTB-): Either: a patient who fulfills all the following criteria:
•
two sets (taken at leat 2 weeks apart) of at least twosputum specimens negative for acid-fast bacili on mi-croscopy;
•
radiographic abnormalities consistent with pulmonary TB and a lack of clinical response despite one week of a broad-spectrum antibiotic;•
a decision by a physician to treat with a full curative course of anti-TB chemotherapy;Or: a patient who fulfills all the following criteria:
•
severely ill;•
at least two sputum specimens negative for acid-fast bacilli by microscopy;•
radiographic abnormalities consistent with extensive pul-monary TB (interstitial or miliary);•
a decision by a physician to treat with a full curative course of anti-TB chemotherapy;Or: a patient whose initial sputum smears were negative, who had sputum sent for culture initially, and whose subsequent sputum culture result is positive.
Extra-pulmonary tuberculosis:
•
Tuberculosis of organs other than lungs: pleura, lymph nodes, abdomen, genito-urinary tract, skin, joints and bones, tuberculous meningitis, etc.•
Diagnosis should be based on one culture positive spec-imen from an extra-pulmonary site, or histological or strong clinical evidence consistent with active extra-pul-monary tuberculosis, followed by a decision by a medi-cal officer to treat with a full course of anti-tuberculous therapy.Note: Any patient diagnosed with both pulmonary and extra-pulmonary tuberculosis should be classified as a case of pul-monary tuberculosis.
New case:A patient who has never had treatment for tuber-culosis or took anti-tuberculous drugs for less than 4 weeks.
Relapse case:A patient previously treated for tuberculosis and declared cured by a medical officer after one full course of chemotherapy, but who reports back to the health service bacteriologically positive (smear or culture).
Recommended surveillance measures
Quarterly reports on case notifications and cohort analysis of treatment outcomes (at peripheral, intermediate, and cen-tral level).
Recommended minimum data elements
•
Number of new pulmonary sputum smear positive cases•
Number of pulmonary relapse cases•
Number of new pulmonary sputum smear negative cases•
Number of new pulmonary sputum smear positive cases by age and gender (suggested age groups: 0-14, 15-24, 25-34, 35-44, 45-54, 55-64, 65+ years)Treatment results for new sputum smear positive cases: (usually as a percentage of all new sputum smear positive cases registered during the same period of time):
•
Number of cases who converted to negative after initial phase of treatment.•
Number of cases cured (i.e., completed treatment and at least 2 negative sputum smear results during the contin-uation phase of treatment, one of which occurred at the end of treatment).•
Number of cases who, after smear conversion at the end of initial phase of treatment, completed treatment, but without smear results at the end of treatment.•
Number of cases who died (regardless of cause).•
Number of cases who failed treatment (i.e., becamepos-itive again or remained smear pospos-itive, 5 months or more after starting treatment).
•
Number of cases who interrupted treatment / defaulted (i.e., did not collect drugs for 2 months or more after registration).•
Number of cases who were transferred out (i.e., trans-ferred to another reporting unit and results not known).Principal uses of data for decision-making
•
At local level: ensure that appropriate treatment servic-es are offered, contact tracing is carried out, local out-breaks are recognized, and local epidemiology is moni-tored.•
At national level: facilitate monitoring of the epidemiol-ogy of the disease and of the performance of treatment programmes (ability of a National Tuberculosis Pro-gramme to detect tuberculosis cases, diagnose sputum positive cases, treat tuberculosis cases successfully); and facilitate planning for programme activities (e.g., securing drug supply, lab supply, etc.).•
At international level: examine trends over time and make inter-country comparisons with the aim of coordinating control efforts.The Pan American Health Organization, the World Health Organization and the Ministry of Health of Mexico are jointly organizing the Fifth Global Conference on Health Promotion from 5 to 9 June, 2000 in Mexico City, Mexico.
The goal of the Conference is to take forward the five priorities for health
promotion for the 21st century that were introduced at the 4th International Conference on Health Promotion in Jakarta in 1997 and confirmed in the World Health Assembly’s Health Promotion Resolution of May 1998. The priorities include:
· Promoting social responsibility for health.
· Increasing community capacity and empowering the individual.
· Expanding and consolidating partnerships for health. · Increasing investments for health development. · Securing an infrastructure for health promotion.
Specific Conference objectives are to illustrate the impact of health promo-tion strategies on health and quality of life; contribute to efforts that place health high on the development agenda within international, national and local agencies; and shape a Global Alliance for Health Promotion which would create new partnerships for the promotion of health and human development between diverse sectors at all levels of society.
Further information is available on the Internet at http://www.who.int/ hpr/conference/index.html
Index: 1997-1999 (Vol. 18 to 20)
A
AIDS
surveillance in the Americas 1996, 18:1
1997, 18:2
(See also Meetings, congresses and seminars, calendar of) Americas
AIDS surveillance, 1996, 18:1
blood banks, situation, 1994-1995, 18:1 blood safety, 20:2
cholera, 18:1
dengue, re-emergence of, 18:2 health, 1998, 19:3
for all by the year 2000, Third Evaluation, 18:4 situation, selection of basic indicators, 18:1 situation and trends, assessment of (1980-1998), by subregion, 20:1
Integrated Management of Childhood Illness (IMCI), 19:1 lymphatic Filariasis, 18:4
malaria, 1996, 18:3
measles eradication by the year 2000, partnership for, 20:2 tuberculosis control, 19:2
violence, cultural norms and attitudes, selected cities, 18:4 (See also Publications)
(See also Meetings, congresses and seminars, reports on) Amoebiasis
(see Meetings, congresses and seminars, reports on) Antimicrobial resistance in the Americas
(see Meetings, congresses and seminars, reports on)
Aromatic hydrocarbons, potential effects of workers’ health, Colombia, 1996, 18:3
B
Blood
bank situation
in the Region of the Americas (1994-1995), 18:1 serological markers for communicable diseases, in Latin America (1996), 19:3
safety in the Americas, 20:2
Brazil
integrated information network for health, development, 18:4
C
Caribbean Epidemiology Centre (CAREC) (See Meetings, congresses and seminars, report on) Case definitions
cholera, plague and yellow fever, 20:1 diphtheria and pertussis, 20:4 malaria and poliomyelitis, 20:2 measles and rubella, 20:3
Central America
hurricane Mitch, impact of, 19:4
insecticide susceptibility tests, results (1994-1997), 18:3
Chagas Disease
interruption of transmission in Uruguay, 19:1
Childhood Illness
Integrated Management (IMCI) in the Americas, 19:1 “Healthy Children: goal 2002”, 20:4
Cholera
case definition, 20:1 in the Americas, 1996, 18:1
Colombia, aromatic hydrocarbons, potential effects on workers’ health (1996), 18:3
Conferences
(see Meetings, congresses and seminars, calendar of, reports on) Congresses
(see Meetings, congresses and seminars, calendar of, reports on) Costa del Sol declaration, 19:4
(See also Meetings, congresses and seminars, calendar of) Courses
epidemiology, 18:4, 19:1, 19:4, 20:4 applied, 20:2
CRAES
(See Meetings, congresses and seminars, reports on)
Cuba
dengue, 18:2
(See also Meetings, congresses and seminars, calendar of)
D
Demographic (See indicators) Dengue
Cuba, 18:2
re-emergence, in the Americas, 18:2 serological proficiency test, 18:2 serological study, Inhibition ELISA, 18:2 (See also Publications)
Diphtheria, case definition, 20:4
E
El Niño, impacts on health, 19:2
Emerging infectious diseases
(See Meetings, congresses and seminars, calendar of) Environmental Engineering
(See Meetings, congresses and seminars, calendar of) EPIDAT
version 2.0 (1997), 18:2 version 2.1 (1998), 19:2
Epidemiological
analysis of Tabulated Data (EPIDAT), 18:2, 19:2 calendar 1999, 20:1
Epidemiology (See Courses)
F
Floods, Venezuela, 20:4
Foot-and-Mouth disease, Eradication in South America, 19:2
G
Geographic Information Systems
(See Meetings, congresses and seminars, calendar of)
Growth retardation, indicators in children under 5 years old, 19:1
H
Hantavirus (See Publications) Health
El Niño, impacts, 19:2 in the Americas, 1998, 19:3 inequity, measuring, 20:1
Integrated information network, development, Brazil, 18:4 older persons of Latin America and the Caribbean, 18:2 situation, basic indicators, in the Americas, 18:1 situation analyses, 20:3
situation and trends in the Americas, by subregion 1998), 20:1
worker’s health, effects of exposure to aromatic hydrocarbons, Colombia (1996), 18:3
(See also Publications) Health for All by the year 2000
third evaluation of the Implementation, Region of the Americas, 18:4
Health statistics (See Publications)
Hurricane Mitch, impact in Central America, 19:4
I
IMCI
(See Childhood illness) Indicators
basic (1996), 18:1
basic (1998), by subregions, 19:3 basic (1999), Selected, by country
population, health resources, access and coverage, 20:3 mortality, 20:3
mortality differences by gender, 20:4 demographic and morbidity, 20:4 growth retardation, in children, 19:1 (See also Publications)
Inequity
in health, measuring, 20:1 income, Risks of dying, 20:4
Insecticide
susceptibility tests, results, four Central American countries (1994-1997), 18:3
International Classification of Diseases
tenth Revision (ICD-10), Implementation, 18:1
WHO collaborating centers, 19:3
ICD-10 Mortality data, New PAHO list 6/67 for tabulation of, 20:3
International health regulations, revision, 19:3
Internet
(See Meetings, congresses, and seminars, calendar of)
L
Latin America and the Caribbean lead in gasoline, elimination, 18:3 older persons, health conditions, 18:2
Lead in gasoline
elimination, Latin America and the Caribbean, 18:3
Leprosy
(See Meetings, congresses and seminars, calendar of) Lymphatic Filiariasis, in the Americas, 18:4
M
Malaria
case definition, 20:2 in the Americas, 1996, 18:3
Maternal and Child Health (see Publications) Measles
case definition, 20:3
eradication in the Americas by the year 2000, Partnership, 20:2
Meetings, congresses and seminars, calendar of
AIDS, V Pan American Conference on, Peru, 1997, 18:1 emerging infectious diseases, international conference on, USA, 1998, 18:3
environmental Engineering and Health Sciences, international symposium on, Mexico, 1998, 19:2
epidemiology
III Chilean congress of, Chile, 1997, 18:2 IV Chilean congress of, Chile, 1998, 19:4
I Venezuelan congress of, Venezuela, 1997, 18:1, 18:2 VIII Colombian congress of, Colombia, 1997, 18:2
geographic Information Systems and Health, Meeting on, USA, 1998, 19:2
health Crisis and the Internet, Colombia, 1997, 18:2 leprosy, IX Congress of the Brazilian Association of, Brazil, 1997, 18:1
nutrition, Congress of the Latin American Nutrition Society, Guatemala, 1997, 18:1
sexually transmitted diseases, XI Latin American Congress on, Peru, 1997, 18:1
tobacco or health, I Iberoamerican Conference on, Spain, 1999, 19:2
Meetings, congresses and seminars, reports on
Amoebiasis, consultation meeting with experts, Mexico, 1997, report on, 18:1
Antimicrobial resistance in the Americas, Pan American conference on, 20:2
Onchocerciasis, Inter American Conference, Oaxaca, Mexico,1996, report of, 18:4
El Boletín Epidemiológico de la OPS se publica en forma trimestral en inglés y español.
Forma parte de la colección de la Biblioteca Nacional de Medicina de los Estados Unidos.
Impreso en papel sin ácido.
ORGANIZACION PANAMERICANA DE LA SALUD
Oficina Sanitaria Panamericana, Oficina Regional de la
ORGANIZACION MUNDIAL DE LA SALUD
525 Twenty-Third Street, N.W. Washington, DC 20037 Internet: http://www.paho.org/spanish/sha/bsindex.htm
PAHO/WHO Regional Advisory Committee on Health Statistics (CRAES), preparatory meeting, 20:2
Mexico
United States border, leading causes of mortality, 20:2 (See also Publications)
Mitch
(See Hurricane Mitch) Morbidity
(See Indicators) Mortality
data, new PAHO list 6/67 for tabulation of, 20:3 United States-Mexico border, 20:2
(See also Publications) (See also Indicators)
N
Nutrition
(See Meetings, congresses and seminars, calendar of)
O
Older persons, health conditions, Latin America and the Caribbean, 18:2
Onchocerciasis
(See Meetings, congresses and seminars, report on)
P
PAHO, Creation of the Special Program for Health Analysis (SHA), 20:1
(See also Meetings, congresses and seminars, calendar of) Pertussis, case definition, 20:4
Plague, case definition, 20:1
Poliomyelitis, case definition, 20:2
Publications
Control of Communicable Diseases, 16th Edition, 18:4
Hantavirus in the Americas: Guidelines for Diagnosis, Treatment, Prevention, and Control, 20:2
Health and environment analysis and indicators for making, World Health Statistics Quaterly, 18:3
Health Conditions in the Caribbean, 1997, 18:4
Health in the Americas: 1998 Edition, 19:3
Health Situation in the Americas: Basic Indicators 1998, 19:3
Health Situation in the Americas: Basic Indicators 1999, 20:3
Health Statistics from the Americas, 1998 Edition, 20:3
Manual on Risk Approach in Maternal and Child HealthCare, 20:2
Mortality Profiles of the Sister Communities on the US- Mexico Border, 1992-1994, 20:2
Pan American Journal of Public Health, 18:4
R
Regional Advisory Committee on Health Statistics (CRAES) (See Meetings, Congresses and Seminars, reports on) Rubella, case definition, 20:3
S
Sexually transmitted diseases
(See Meetings, congresses and seminars, calendar of) South America, Foot-and-Mouth disease, eradication of, 19:2
Surveillance, AIDS, in the Americas, 18:1
T
Tobacco
(See Meetings, congresses and seminars, calendar of) Tuberculosis control, in the Americas, 19:2
U
United States, -Mexico border, leading causes of mortality, 20:2 (See also publications)
Uruguay, Chagas disease, interruption of transmission in, 19:1
V
Venezuela, Floods, 20:4
Violence, Cultural norms and attitudes, selected cities in the Region of the Americas, 18:4
W
WHO
International Classification of diseases, collaborating centers, 19:3
Whooping cough (See Pertussis)
Worker’s health, exposure to aromatic hydrocarbons and their potential effects, Colombia (1996), 18:3