Psychometric Properties of the Personal Wellbeing Index
in Brazilian and Chilean Adolescents Including Spirituality
and Religion
Propriedades Psicométricas do Personal Wellbeing Index em Adolescentes
Brasileiros e Chilenos Incluindo Espiritualidade e Religião
Jorge Castellá Sarriera
,a, Ferran Casas
b, Jaime Alfaro
c, Lívia Bedin
a,
Miriam Raquel Wachholz Strelhow
a, Daniel Abs
a, Boris Valdenegro
d,
Catalina García
c& Denise Oyarzún
eaUniversidade Federal do Rio Grande do Sul, Porto Alegre, RS, Brasil, bUniversitat de Girona, Girona, España,
cUniversidad del Desarrollo, Santiago, Chile, dUniversidad de Chile, Santiago, Chile
& ePontifi cia Universidad Católica de Valparaíso, Valparaíso, Chile
Abstract
This study compared the 7-item Personal Wellbeing Index (PWI) with two other versions which include the domains “Spirituality” and “Religion”, separately, in a sample of Brazilian (n = 1.047) and Chilean (n = 1.053) adolescents. A comparison of psychometric properties between the PWI versions was carried out through multigroup confi rmatory factor analysis showing adequate adjust-ments (CFI > .95, RMSEA < .08), whereas the item spirituality presented better performance. For the analysis of the differential contribution of each domain to the notion of global satisfaction, a regression on the item Overall Life Satisfaction (OLS) was applied using structural equations. It is recommended the inclusion of the item spirituality in the original scale, considering the importance of such domain in both cultures.
Keywords: Personal wellbeing, spirituality, religion, adolescence.
Resumo
Este estudo comparou o Índice de Bem-estar Pessoal (PWI) de sete itens, com duas versões que incluem os domínios “espiritualidade” e “religião” separadamente em uma amostra de adolescentes brasileiros (n = 1,047) e chilenos (n = 1,053). A comparação das propriedades psicométricas entre as versões do PWI foi realizada através de análise fatorial confi rmatória multigrupo mostrando ajustes adequados (CFI > 0,95, RMSEA <0,08), sendo que o item espiritualidade apresentou me-lhor desempenho. Para a análise da contribuição de cada domínio para a satisfação global, foram realizadas regressões com o PWI e o item de Satisfação Global com a Vida por meio de equações estruturais. Recomenda-se a inclusão do item espiritualidade na escala, considerando a importância deste domínio em ambas as culturas.
Palavras-chave: Bem-estar pessoal, espiritualidade, religião, adolescência.
Mailing address: Rua Ramiro Barcelos, 2600, sala 122, Porto Alegre, RS, Brasil 90035-003. E-mail: [email protected]
There is a consensus among researchers that studies on subjective wellbeing of children and adolescents are far from achieving the amount of research results offered by studies conducted with adults (Gademann, Schonert-Reichl, & Zumbo, 2010; Tomyn & Cummins, 2011). This is particularly relevant if we consider that the available data about childhood and adolescence shows that during earlier stages of life wellbeing has its own evolutionary idiosyncrasy, in such a way that we can’t assume that re-sults from samples with adults can be applied to younger
populations even if they belong to the same sociocultural context (Casas, 2010).
Particularly, one must consider that the empirical data available on childhood and adolescence comes mainly from studies on English speaking population, with a few exceptions (Casas et al., 2012b). In addition, research on the subjective wellbeing domain in children and adoles-cents (and also adults), has not advanced signifi cantly in developing countries as observed by Lau, Cummins, and McPherson (2005). In Latin America, specifi cally, children and adolescent’s subjective wellbeing has not been stud-ied after considering the different contexts in the region (Aguado Quintero, 2009).
Personal Wellbeing Index (PWI)
Among the existing studies with adolescents one of the main instruments used is the Personal Wellbeing Index (PWI; Cummins, Eckersley, Pallant, Van Vugt, & Misajon, 2003). The PWI has seven items about different dimen-sions of satisfaction: standard of living, health, life achieve-ments, personal relationships, personal safety, groups and future security. The International Wellbeing Group (2006) has incorporated an eighth item related to spirituality or religion. Even though the PWI has been designed for the adult population, its formulation is broad enough to be used in all types of populations (Lau et al., 2008).
One of the unsolved problems of research with PWI in the adolescent population is that the share of explained variance is generally smaller than in a sample of adults in the same sociocultural context, which suggests that other dimensions should be included in the adolescent population scale in order to increase its explanatory power (Casas et al., 2012b). On this regard, recent literature has discussed the inclusion of satisfaction with religion or spirituality in the corresponding measure (Wills, 2009). This topic has proven to be problematic when different sociocultural contexts are compared and, in particular, when used with samples of adolescents, since the different meaning given to these dimensions infl uence the results (Casas, Gonzalez, Figuer, & Malo, 2009).
As observed by the International Wellbeing Group (2006), in the Australian population the domain “spiritual-ity or religion” does not make a differential contribution, although it has proven to do so in other countries. For example, Wills (2009) reports empirical evidence of this contribution in the Colombian population and supports the inclusion of this new domain in the PWI. Moreover, Yiengprugsawan et al. (2010) conclude that “religion and spirituality” are important domains for wellbeing in Thailand.
Discussion on the importance of including religion and spirituality as one of the PWI domains leans towards the studies that show that they contribute to life satisfaction and happiness (Cohen, 2002). In this sense, some studies show spirituality and religion as important protective fac-tors for adolescent (Moreira & Sarriera, 2006).
In many studies the domains religion and spirituality are treated similarly, as if they were synonyms.
Like-wise, by proposing its inclusion in the PWI, the specifi c question used both words –“How satisfi ed are you with your spirituality or religion?” (International Wellbeing Group, 2006). Wills (2009) also used only one ques-tion to carry out his study in Colombia, but he pointed out that this is a topic that must be assessed with more detail. Considering that it is a double-barreled item, it may lead to a misunderstanding of the concepts and a measurement problem.
Scholars have attempted to define both concepts, Religion and Spirituality, but as Zinnbauer, Pargament, and Scott (1999) show, there are many different possible defi nitions in the literature. Generally, the defi nition of religion is related with the institutional, ritual and ideo-logical, whereas spirituality is related with the personal, affective, experiential, and refl ective (Ubani & Tirri, 2006). In this sense, Van Dierendonck and Mohan (2006) observe that spirituality is centered in an inner attitude, unrelated with any specifi c religion. Likewise, empirical research has shown that the complexity in understanding this difference is also found in the general population. In a research with 102 adolescents between ages 12 and 13, Ubani and Tirri (2006) concluded that the participants indicated expressions of religion as related majority with institutional dimension and spirituality as the humanistic dimension. Moreover, studies with the young population in Cataluña, Spain (Casas et al., 2009) also show a dif-ferent understanding of the two concepts. The majority believes that traditional religion contributes very little to their vital satisfaction, whereas the importance given to spirituality is greater.
Thus there is a need to continue exploring the PWI with adolescents in connection to satisfaction with religion and spirituality as combined or separate domains, and their linkage with age and different cultures, aiming for a better understanding of wellbeing in these specifi c populations. Therefore, this study analyzes the properties of the PWI-7, in comparison to its other versions that include an eighth item referring to the Religion domain (PWI + Religion) or alternatively referring to Spirituality (PWI + Spirituality). Also, for the analysis of the differential contribution of each domain to the notion of Global Satisfaction, a regres-sion on the single item scale on Overall Life Satisfaction (OLS) was applied.
Method
Sample
Data Collection Procedure
In order to determine the sample, high schools from Brazil and Chile were randomly selected. In each school the procedure was carried out according to the ethical cri-teria for administration of questionnaires to adolescents in each country. In Brazil, parents’ consent was required for each adolescent. Questionnaires were answered through self-administration during the school period 2009-2010, within regular school hours. The time required for the application of the questionnaire was between 45 and 60 minutes.
Instruments
Personal WellBeing Index (PWI; Cummins, et al., 2003 and International Wellbeing Group, 2006). This scale measures subjective wellbeing within different domains of satisfaction: standard of living, health, life achievements, personal relationships, personal safety, groups and future security. According to the authors, these satisfaction domains are related with global wellbeing, each one as a specifi c item. In November 2006 the authors included the religion/spirituality domain, adding one item (International Wellbeing Group, 2006), and in April 2013, they decided to make the Spiritual/Religious domain optional, because it showed unique contribution in some countries, but not in others. In the revision of the instrument, the authors also recommend that researchers wishing to include this domain use two separate questions, one referring to spirituality and the other referring to religious beliefs (International Wellbeing Group, 2013). Thus, considering the previous
fi ndings about the eighth item, this research took into ac-count two different versions of the wellbeing index, one including spirituality, and the other, religion.
Single item Scale on Overall Life Satisfaction (OLS; International Wellbeing Group, 2006). This item is not part of the PWI, but it is used by many to analyze the validity of the scale construct, as well as to determine the specifi c contribution of each item to the total variance. It consists of a question in the following terms: “Considering your cur-rent life, how satisfi ed are you with your life as a whole?”.
Analysis Procedure
Initially, we performed internal consistency analyzes using Cronbach’s alpha coefi cient and item-total correla-tions, a measure for examining the relationship between individual items and the total scale, where smaller values indicate that the item is not well correlated with the other. After that, the correlations between the items are presented.
Confi rmatory factor analyses (CFA) and structural equations were conducted using Maximum Likelihood estimation method (ML) on each of the index versions to verify the factor structure of the instrument, and to deter-mine the contribution of each item to the explained vari-ance, it was considered the OLS in the regression model. The PWI represents the fi rst level deconstruction of the Campbell, Converse and Rodgers (1976) item of OLS.
Thus, the seven items that comprise this scale are the most parsimonious set of life domains for this purpose (Davern, Cummins, & Stoke, 2007). However, in addition to the seven items that make up the core of the PWI, the authors of the scale affi rm that the domain of spirituality/religion also meets the criteria for inclusion in samples where the spiritual beliefs and/or religious beliefs are more common. Therefore, they point out this domain as optional, indicat-ing its use in two separate items (International Wellbeindicat-ing Group, 2013).
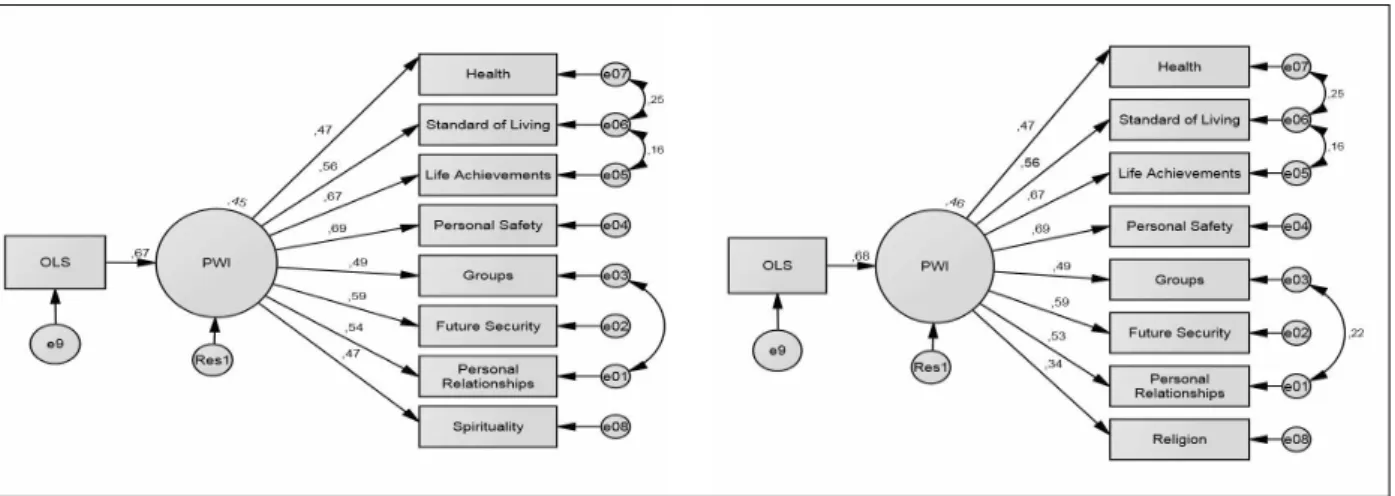
Several fi t indices are suggested in scientifi c literature, the most relevant in this model is the Chi-square, the CFI (Comparative Fit Index), TLI (Tucker and Lewis Index), NFI (Normed Fit Index), the RMSEA (Root Mean Squared Error of Approximation) and SRMR (Standardized Root Mean Squared Residual). The models were tested with the software AMOS 18. It’s desirable that the NFI, TLI and CFI are above .950 and the RMSEA and SRMR bellow .05 as supported by literature (Batista-Foguet & Coenders, 2000; Byrne, 2010).
Finally, we have tested the Multigroup Confi rmatory analyses (MGCFA) considering each country group to verify the scale invariance. In these models, we have tested for the structure (unconstrained model) and factor (con-strained factor loadings) invariance, and we have presented all the fi t index as well as factor loadings for each observed variable, including the confi dence interval calculated using bootstrap, considering that wellbeing measures usually violate normality assumptions because they are positive measures. To consider the difference between the models, we have used the CFI difference (ΔCFI). The difference between the CFI should not be higher than .01, and thus, the overall results indicate the viability of constraining the factor loadings to be the same in the different groups (Milfont & Fisher, 2010).
Results
Internal Reliability of the Scale
Table 1
Reliability Statistics and Item-total Correlation
PWI Domains
Chile Brazil
Item-total Correlation
PWI-7
Item-total Correlation PWI-8 – Spi
Item-total Correlation PWI-8 - Rel
Item-total Correlation
PWI-7
Item-total Correlation PWI-8 – Spi
Item-total Correlation PWI-8 - Rel
1. Health .451 .444 .427 .453 .461 .461
2. Standard of Living .555 .551 .538 .533 .528 .521
3. Life Achievements .610 .612 .589 .560 .556 .548
4. Personal Safety .598 .600 .573 .533 .524 .492
5. Groups .472 .472 .468 .459 .473 .473
6. Future Security .458 .468 .460 .531 .529 .511
7. Personal Relationships .530 .542 .536 .444 .459 .443
8. Spirituality .412 .400
9. Religion .268 .290
Cronbach’sAlpha .796 .803 .785 .779 .788 .774
Note. PWI-8-SPI is the Personal Wellbeing Index with the “spirituality” item and PWI-8-REL is the Personal Wellbeing Index with the “religion” item.
Likewise, comparatively lower values are observed in the item-total correlations of the domains “Religion” and “Spirituality” with the original domains (PWI-7). In addi-tion, relative similarity can be observed in the correlations of the remaining domains between the different versions of the PWI. The range of the total-item correlation of the dif-ferent domains (except for “Religion” and “Spirituality”) are between .427 and .612 for Chile and .443 and .560 for Brazil, all of them signifi cant with p ≤ .01.
Correlation between Wellbeing Domains
According to the results in Table 2, the range of the correlation between the PWI domains for Chile goes from .116 to .496. The domains with higher correlation levels are “Life Achievements” with “Personal Safety” (.496), followed by “Life Achievements” with “Standard of Liv-ing” (.488), while “Health” and “Religion” (.116) have the lowest correlations. Regarding the single item scale on OLS, its highest correlation is with the domain “Personal Safety” (.557), and the lowest with “Health” (.308) and “Religion” (.317).
Table 2
Correlations Between Domains (Chile and Brazil)
1 2 3 4 5 6 7 8 9 10
1. Health 1 .393* .284* .304* .239* .342* .275* .260* .220* .290*
2. Standard of Living .473* 1 .460* .335* .267* .385* .291* .251* .196* .370*
3. Life Achievements .330* .488* 1 .438* .350* .356* .324* .268* .210* .404*
4. Personal Safety .301* .379* .496* 1 .306* .439* .281* .242* .123* .371*
5. Groups .267* .301* .324* .379* 1 316* .375* .281* .238* .264*
6. Future Security .224* .285* .424* .423* .236* 1 .265* .262* .177* .407*
7. Personal Relationships .293* .328* .379* .428* .451* .298* 1 .277* .188* .285*
8. Spirituality .208* .267* .316* .313* .242* .273* .314* 1 .510* .279*
9. Religion .116* .175* .188* .177* .182* .193* .230* .486* 1 .293*
10. OLS .308* .434* .463* .557* .324* .402* .377* .365* .317* 1
The range of the correlations between the PWI domains for Brazil goes from .123 to .510 and all correlations are signifi cant (Table 2). The domains that show higher cor-relation levels are “Spirituality” with “Religion” (.510), followed by “Life Achievements” with “Standard of Living” (.460), while “Personal Safety” with “Religion” (.123) have the lowest correlations. Regarding the single item scale on OLS, its highest correlation is with “Future Security” (.407), and its lowest are with “Groups” (.264) and “Spirituality” (.279).
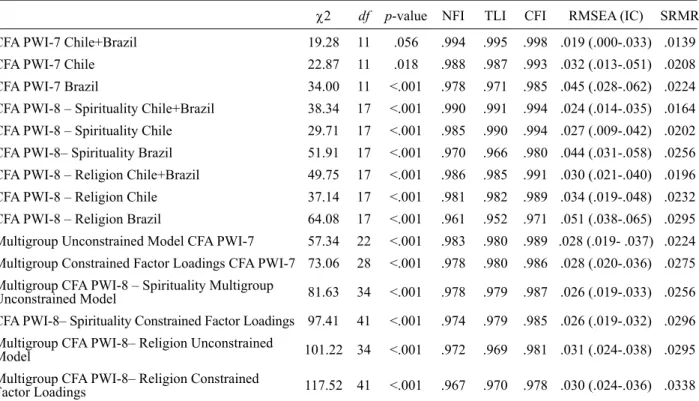
Factor Validity: Confi rmatory Factor Analysis (CFA) The CFA was applied separately with data from the two countries, and then considering the multigroup data with the PWI-7 with spirituality, followed by a similar analysis with religion. In Figure 1, the standardized factor weights can be observed, including three error covariance’s, as shown in previous research (Casas et al., 2012a): (a) sat-isfaction with interpersonal relationships and satsat-isfaction with the groups to which they belong, (b) satisfaction with the quality of life and satisfaction with one’s own achievements, and (c) the level of satisfaction with life and satisfaction with health.
Table 3
CFA Fit Indices
2 df p-value NFI TLI CFI RMSEA (IC) SRMR
CFA PWI-7 Chile+Brazil 19.28 11 .056 .994 .995 .998 .019 (.000-.033) .0139
CFA PWI-7 Chile 22.87 11 .018 .988 .987 .993 .032 (.013-.051) .0208
CFA PWI-7 Brazil 34.00 11 <.001 .978 .971 .985 .045 (.028-.062) .0224
CFA PWI-8 – Spirituality Chile+Brazil 38.34 17 <.001 .990 .991 .994 .024 (.014-.035) .0164
CFA PWI-8 – Spirituality Chile 29.71 17 <.001 .985 .990 .994 .027 (.009-.042) .0202
CFA PWI-8– Spirituality Brazil 51.91 17 <.001 .970 .966 .980 .044 (.031-.058) .0256
CFA PWI-8 – Religion Chile+Brazil 49.75 17 <.001 .986 .985 .991 .030 (.021-.040) .0196
CFA PWI-8 – Religion Chile 37.14 17 <.001 .981 .982 .989 .034 (.019-.048) .0232
CFA PWI-8 – Religion Brazil 64.08 17 <.001 .961 .952 .971 .051 (.038-.065) .0295
Multigroup Unconstrained Model CFA PWI-7 57.34 22 <.001 .983 .980 .989 .028 (.019- .037) .0224
Multigroup Constrained Factor Loadings CFA PWI-7 73.06 28 <.001 .978 .980 .986 .028 (.020-.036) .0275
Multigroup CFA PWI-8 – Spirituality Multigroup
Unconstrained Model 81.63 34 <.001 .978 .979 .987 .026 (.019-.033) .0256
CFA PWI-8– Spirituality Constrained Factor Loadings 97.41 41 <.001 .974 .979 .985 .026 (.019-.032) .0296
Multigroup CFA PWI-8– Religion Unconstrained
Model 101.22 34 <.001 .972 .969 .981 .031 (.024-.038) .0295
Multigroup CFA PWI-8– Religion Constrained
The model showed a good fi t with the data from both countries separately and also with the combined data, tested as a multigroup model (Table 3). The multigroup models had a good fi t index, without restrictions, as well as with restricted factor loadings with the data from both countries separately and with the combined data.
Specifi c Contributions of the Domains to the “Global Life Satisfaction (OLS)
After the CFA, a regression model was estimated with the PWI-7 with spirituality and religion separately with the
single item scale on OLS in order to test the differential contributions of these PWI domains in its different ver-sions. These specifi cations can be verifi ed in Figure 2.
Table 4 presents the overall fi t index for the structural models. Despite the fact that the fi t indices in the models from each country and from the multigroup model are lower that the PWI indices, when the items spirituality or religion are present the adjustments are appropriate, showing that spirituality and religion contribute to the PWI construct.
Table 4
Model Fit Indices
2 df p-value NFI TLI CFI RMSEA (IC) SRMR
OLS --> PWI-7 – Chile + Brazil 37.25 17 <.001 .991 .992 .995 .024 (.013-.034) .016
OLS --> PWI-7 – Chile 42.54 17 <.001 .982 .982 .989 .038 (.024-.052) .022
OLS --> PWI-7 – Brazil 42.48 17 <.001 .978 .978 .986 .038 (.024-.052) .021
OLS --> PWI-8 – Spirituality Chile + Brazil 62.41 24 <.001 .987 .988 .992 .028 (.019-.036) .018
OLS --> PWI-8 – Spirituality Chile 54.81 24 <.001 .979 .982 .988 .035 (.023-.047) .022
OLS --> PWI-8– Spirituality Brazil 61.74 24 <.001 .971 .973 .982 .039 (.027-.051) .025
OLS --> PWI-8 – Religion Chile + Brazil 109.02 24 <.001 .979 .972 .981 .041 (.033-.049) .023
OLS --> PWI-8 – Religion Chile 81.75 24 <.001 .968 .965 .977 .048 (.037-.059) .027
OLS --> PWI-8 – Religion Brazil 89.29 24 <.001 .956 .951 .968 .051 (.040-.063) .030
Multigroup OLS --> PW7
Unconstrained Model 85.03 34 <.001 .980 .980 .988 .027 (.020-.034) .021
Multigroup OLS --> PW7
Constrained Factor Loadings 102.81 40 <.001 .976 .979 .985 .027 (.021-.034) .027
Multigroup OLS --> PWI-8– Spirituality
Unconstrained Model 116.55 48 <.001 .975 .978 .985 .026 (.020-.032) .025
Multigroup OLS --> PWI-8– Spirituality
Constrained Factor Loadings 134.18 55 <.001 .972 .978 .983 .026 (.021-.032) .029
Multigroup OLS --> PWI-8– Religion
Unconstrained Model 171.05 48 <.001 .963 .959 .973 .035 (.029-.041) .030
Multigroup OLS --> PWI-8– Religion
All specifi cations of the multigroup model have good
fi t indices, both without restrictions and with restricted factor loadings. It can be observed that the model with the item “religion” has the lowest fi t indices. Also, when analyzing each country separately, data from Chile has better adjustment to the model with spirituality as well as with religion, compared to Brazil.
Table 5 presents the factor loadings and the standard-ized weights of the PWI-7 for the combined database of both countries and for each country separately. Tables 7 and 8 show the factor loadings of the PWI with the spiri-tuality and religion items and the standardized weights of the PWI with the OLS, the confi dence intervals were
calculated with bootstrap method for both countries. The SMC (Squared Multiple Correlation) are presented for each regression model, indicating the explained variance proportion of the PWI in its regression relation with the OLS.
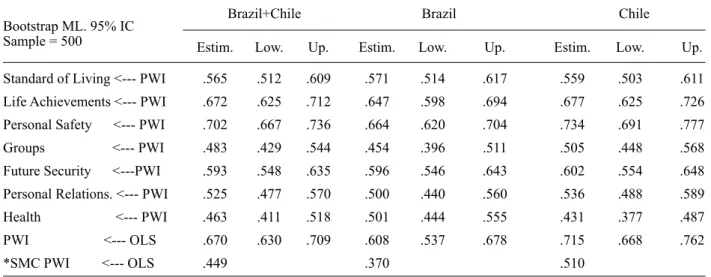
The data from Table 5 indicated that for the ages con-sidered in this study, the domain that is most related with the latent variable PWI is satisfaction with perceived Per-sonal Safety, followed by satisfaction with Life Achieve-ments. On the other hand the domains that contribute less to the PWI are different in both countries. It can also be observed that the SMC of the PWI-7 is different, it’s lower in Brazil (37%) and higher in Chile (51%), resulting in 44.9% in the combined sample.
Table 5
Standardized Estimations – PWI-7
Bootstrap ML. 95% IC Sample = 500
Brazil+Chile Brazil Chile
Estim. Low. Up. Estim. Low. Up. Estim. Low. Up.
Standard of Living <--- PWI .565 .512 .609 .571 .514 .617 .559 .503 .611
Life Achievements <--- PWI .672 .625 .712 .647 .598 .694 .677 .625 .726
Personal Safety <--- PWI .702 .667 .736 .664 .620 .704 .734 .691 .777
Groups <--- PWI .483 .429 .544 .454 .396 .511 .505 .448 .568
Future Security <---PWI .593 .548 .635 .596 .546 .643 .602 .554 .648
Personal Relations. <--- PWI .525 .477 .570 .500 .440 .560 .536 .488 .589
Health <--- PWI .463 .411 .518 .501 .444 .555 .431 .377 .487
PWI <--- OLS .670 .630 .709 .608 .537 .678 .715 .668 .762
*SMC PWI <--- OLS .449 .370 .510
Note. *SMC = Squared Multiple Correlation.
Table 6
Standardized Estimations – PWI 8 – Spirituality
Bootstrap ML. 95% IC Sample = 500
Brazil+Chile Brazil Chile
Estim. Low. Up. Estim. Low. Up. Estim. Low. Up.
Standard of Living <--- PWI .565 .514 .612 .571 .517 .617 .560 .502 .614
Life Achievements <--- PWI .668 .621 .709 .643 .593 .687 .675 .625 .724
Personal Safety <--- PWI .692 .656 .728 .653 .609 .692 .724 .683 .766
Groups <--- PWI .490 .435 .548 .461 .405 .517 .511 .454 .573
Future Security <--- PWI .592 .548 .633 .593 .543 .639 .601 .556 .645
Personal Relations <--- PWI .535 .489 .580 .510 .451 .569 .546 .497 .597
Health <--- PWI .468 .417 .522 .507 .453 .560 .435 .382 .491
Spirituality <--- PWI .470 .425 .518 .454 .405 .503 .473 .426 .528
PWI <--- OLS .673 .636 .713 .610 .539 .680 .720 .675 .765
*SMC PWI <--- OLS .453 .372 .518
Regarding Table 6, the standardized factor loadings in the Brazilian sample ranged from .454 (Spirituality) to .653 (Security). The standardized factor loadings in the Chilean sample are from .435 (Health) to .724 (Security). The SMC of the PWI-8 with the item spirituality is not very different
from the SMC with the PWI-7, with Chile showing higher variances than Brazil. The regression standardized weights in the OLS and the PWI-8 are also similar to the PWI-7 weights: .67 for the combined sample, .61 for Brazil and .72 for the Chilean sample (Table 6).
Table 7
Standardized Estimations – PWI 8 – Religion
Bootstrap ML. 95% IC Sample = 500
Brazil+Chile Brazil Chile
Estim. Low. Up. Estim. Low. Up. Estim. Low. Up.
Standard of Living <--- PWI .565 .513 .608 .573 .518 .620 .559 .503 .612
Life Achievements <--- PWI .667 .620 .708 .645 .594 .691 .672 .623 .722
Personal Safety <--- PWI .690 .654 .724 .652 .607 .692 .721 .675 .765
Groups <--- PWI .488 .430 .546 .460 .404 .517 .509 .453 .570
Future Security <--- PWI .592 .546 .633 .594 .542 .640 .600 .553 .644
Personal Relations <--- PWI .530 .481 .574 .505 .445 .563 .540 .492 .590
Health <--- PWI .465 .412 .520 .506 .450 .560 .432 .379 .487
Religion <--- PWI .341 .290 .386 .331 .275 .385 .345 .289 .397
PWI <--- OLS .682 .644 .722 .621 .548 .691 .727 .683 .773
*SMC PWI <--- OLS .465 .385 .528
Note. *SMC = Squared Multiple Correlation.
When adding the item “religion” to the PWI-7, the standardized factor loadings in the Brazilian sample ranges from .331 (Religion) to .652 (Security). In the Chilean sample the item “religion” also has the lowest factor load-ing (.345), while “Security” has the highest factor loadload-ing (.721). The SMC of the PWI-8 with the item religion is slightly higher that the SMC with the PWI-7, resulting in higher variance in the Chile specifi cation in terms of the Brazil specifi cation. The regression standardized weights of the OLS and the PWI-8 are also slightly higher than the weights of the PWI-7, with .68 for the combined sample, .62 for Brazil and .73 for Chile (Table 7).
Discussion
The reliability of the PWI with or without the inclu-sion of the “Religion” and “Spirituality” domains in Chile ranges between .803 and .785 and in Brazil between .788 and .774, thus there is a decrease in reliability originated from the inclusion of the item religion (it is .796 when re-moving this item for Chile and .779 for Brazil). The same occurs in the item-test correlation for the same item in both countries (.268 for Chile and .290 for Brazil), signifi cantly less than the other domains. Comparing both countries, the inclusion of the item spirituality slightly increases reliability. In this regard, the reliability coeffi cients for the PWI-7 and PWI-8 versions have values very close to those obtained by related studies in other countries (Nielsen,
Smyth, & Zhai, 2010; Rodriguez et al., 2011), obtaining an adequate reliability level.
The comparatively low item-total correlations and reli-ability coeffi cient obtained in the PWI + religion, and also its lowest fi t indices in all models proposed, and the lowest factor loadings indicated the diffi culty for including this domain specifi cally, despite remaining within acceptable ranges. When considering the correlations between the items religion and spirituality with the remaining items in the PWI, the ranges are similar to those found in Casas et al. (2009) with a sample of Spanish adolescents. Comple-mentarily, the results of the item-total correlations show values within similar ranges to those shown by studies in other countries with adult samples (since there are very few studies published with adolescent): from .33 to .69 for Hong Kong and from .21 to .66 for Australia (Lau et al., 2005), and from .44 to .79, in Spain (Rodriguez et al., 2011). Likewise, the nine domains analyzed had signifi cant correlations with the single item scale on OLS.
the highest correlations are the same for both countries (Personal Safety, Life Achievements, Standard of Living and Future Security).
It was possible to conclude that the model fi t indices for each country and for the multigroup model are lower than the PWI-7 indices when including the spirituality or religion items. However, the adjustments are appropri-ate, showing that spirituality and religion contribute to the “PWI” construct, also fi nding that the model with spirituality presents better adjustments than the model with religion.
In addition, the domain which is more related to the PWI latent variable is satisfaction with the feeling of Per-sonal Safety, followed by satisfaction with Life Achieve-ments. The explained variance of the PWI relative to the OLS is slightly higher when adding the “spirituality” or “religion” item to the PWI-7 for both countries. That indicates that the PWI contributes more to the explana-tion of overall life satisfacexplana-tion when adding the variable spirituality or religion to the instrument.
The explained variances are similar to those from other studies: 43% (Lau et al., 2005); 47% (Chen & Davey, 2009); 47% for young adults and 57% for older people (Lau et al., 2008); 52% (Cummins et al., 2003). In our study, the results were 38% for Brazil, 51% in Chile and 45% for the combined sample. However, these results indicate that, especially for Brazilian adolescents, there are possible unidentifi ed domains related with overall life satisfaction.
The lower weight given to “Health” when compared to other PWI domains (excluding Religion) indicates that although it is a domain that contributes to explaining wellbeing, health is not among the most relevant. Studies about health perception indicate that adolescents have a very positive perception of this domain (Garbin, Garbin, Moimaz, & Gonçalves, 2009) which may suggest that this is not a topic of concern for them.
About the understanding of spirituality and religion, a qualitative research with a group of children from South Brazil indicated that they understand “spirituality” as be-liefs, religious practices and the use of religion and faith as a tool to deal with diffi cult situations (Strelhow, Paradiso, Sebold, Bedin, & Sarriera, 2011), showing the linkage between spirituality and religion. Research carried out with adolescents also found a link between concepts, but it was also possible to highlight differences (Van Dierendonck & Mohan, 2006).
Perhaps for the adolescents of this sample these are very closely related words. As observed by Casas et al. (2009) this might be a problem of understanding and meaning given to this dimension due to its high level of abstraction.
Regarding the inclusion of the domains religion or spirituality as two separate items, it was possible to observe that the reliability analyses indicate that the inclusion of religion decreases reliability and the item-test correlations of these two domains are lower than for the remaining domains. However, the rest of the analyses favors the
un-derstanding that the item “spirituality” contributes to the PWI as well as to OLS. Thus it seems relevant to continue studying these domains in terms of their contribution to life satisfaction of adolescents.
Conclusions
The different PWI versions showed good psychometric properties in the samples in both countries of this study, as well as for the combined sample, indicating its potential for the development of transcultural studies. The item spirituality seems to contribute to the PWI more than the item religion, since in the analyses performed it had a re-gression weight close to those found for the items “Health” and “Groups”, whereas the item religion showed the lowest weight between all other domains assessed.
This data analysis reinforces the hypothesis that, in both cultures, satisfaction with spirituality contributes to overall life satisfaction, and, thus, to subjective wellbeing. Therefore, it’s recommended that future studies continue to include the item spirituality in the PWI when administered on adolescents in the Latin American context.
As a limitation of the study, the fact that the meaning given by adolescents to the terms “spirituality” and “reli-gion” is not accurately understood should be highlighted. Furthermore, future research should also verify the PWI consistency including these two terms together or sepa-rately, considering age and gender differences, since these terms can be understood differently at different life stages.
References
Aguado Quintero, L. F. (2009). Un índice de no consumo de alimentos en la niñez para Colombia. Revista Latinoameri-cana de Ciencias Sociales, Niñez y Juventud, 7(2), 735-760. Batista-Foguet, J. M., & Coenders, G. (2000). Modelos de
ecu-aciones estructurales. Madrid, España: La Muralla. Byrne, B. M. (2010). Structural equation modeling with AMOS.
Basic concepts, applications and programming (2nd ed.). New
York: Routledge.
Campbell, A., Converse, P. E., & Rodgers, W. L. (1976). The quality of American life: Perceptions, evaluations, and sat-isfactions. New York: Russell Sage.
Casas, F. (2010). El bienestar personal: su investigación en la infancia y la adolescencia. Encuentros en Psicología Social, 5(1), 85-101.
Casas, F., Gonzalez, M., Figuer, C., & Malo, S. (2009). Satisfac-tion with spirituality, satisfacSatisfac-tion with religion and personal well-being among Spanish adolescents and young university students. Applied Research in Quality of Life, 4(1), 23-45. doi:10.1007/s11482-009-9066-x
Casas, F., Sarriera, J. C., Abs da Cruz, D., Coenders, G., Alfaro, J., Saforcada, E., & Tonon, G. (2012a). Subjective indicators of personal well-being among adolescents. Performance and results for different scales in Latin-language speaking coun-tries: A contribution to the international debate. Child Indica-tors Research, 5(1), 1-28. doi:10.1007/s12187-011-9119-1 Casas, F., Sarriera, J., Alfaro, J., González, M., Malo, S., Bertran,
with 2 new items. Social Indicators Research, 105(3), 461-482. doi:10.1007/s11205-011-9781-1
Chen, Z., & Davey, G. (2009). Subjectivequality of life in Zhuhai city, South China: A public survey using the International Wellbeing Index. Social Indicators Research, 91(2), 243-258. doi:10.1007/s11205-008-9280-1
Cohen, A. B. (2002). The importance of spirituality in well-being for Jews and Christians. Journal of Happiness Studies, 3(3), 287-310. doi:10.1023/A:1020656823365
Cummins, R., Eckersley, R., Pallant J., Van Vugt, J., & Misajon, R. (2003). Developing a national index of subjective wellbe-ing: The Australian unity Wellbeing Index. Social Indicators Research, 64(2), 159-190. doi:10.1023/A:1024704320683 Davern, M. T., Cummins, R. A., & Stokes, M. A. (2007).
Subjective wellbeing as an affective-cognitive construct. Journal of Happiness Studies, 8(4), 429-449. doi:10.1007/ s10902-007-9066-1
Gademann, A. M., Schonert-Reichl, K. A., & Zumbo, B. D. (2010). Investigating validity evidence of the satisfaction with Life Scale adapted for children. Social Indicators Research, 96(2), 229-247. doi:10.1007/s11205-009-9474-1
Garbin, C. A. S., Garbin, A. I. J., Moimaz, S. A. S., & Gonçalves, P. E. (2009). A saúde na percepção do adolescente. Physis Revista de Saúde Coletiva, 19(1), 227-238. doi:10.1590/ S0103-73312009000100012
Hubner, E. S., & Gilman, R. (2002). An introduction to the Mul-tidimensional Students´ Life Satisfaction Scale. Social Indica-tors Research, 60, 115-122. doi:10.1023/A:1021252812882 International Wellbeing Group. (2006). Personal Wellbeing
Index. Melbourne, Australia: Australian Centre on Quality of Life, Deakin University. Retrieved from http://www.deakin. edu.au/research/acqol/instruments/wellbeing_index.htm International Wellbeing Group. (2013). Personal Wellbeing
Index: 5th edition. Melbourne, Australia: Australian Centre on Quality of Life, Deakin University. Retrieved from http:// www.deakin.edu.au/research/acqol/instruments/wellbeing-index/index.php
Lau, A., Chi, I., Cummins, R., Lee, T. M. C., Chou, L. K., & Chung, L. W. N. (2008). The SARS (Severe Acute Respiratory Syndrome) pandemic in Hong Kong: Effects on the subjective wellbeing of elderly and younger people. Aging & Mental Health, 12(6), 746-760. doi:10.1080/13607860802380607 Lau, A., Cummins, R., & McPherson, W. (2005). An
investi-gation into the cross-cultural equivalence of the Personal Wellbeing Index. Social Indicator Research, 72(3), 403-430. doi:10.1007/s11205-004-0561-z
Milfont, T. L., & Fischer, R. (2010). Testing measurement invariance across groups: Applications in cross-cultural research. International Journal of Psychological Research, 3(1), 111-121.
Moreira, M. C., & Sarriera, J. C. (2006). Preditores de saúde e bem-estar psicológico em adolescentes gestantes. Psico-USF, 11(1), 7-15.
Nielsen, I., Smyth, R., & Zhai, Q. (2010). Subjective well-being of China’s off-farm migrants. Journal of Happiness Studies, 11(3), 315-333. doi:10.1007/s10902-009-9142-9
Rodriguez, C., Frades, B., Forjaz, M., Ayala, A., Martinez, P., Fernandez, G., & Rojo, F. (2011). Psychometric properties of the International Wellbeing Index in community-dwelling older adults. International Psychogeriatrics, 23(1), 161-169. doi:10.1017/S104161021000092X
Sarriera, J. C., Saforcada, E., Tonon, G., Vega, L. R. L., Mo-zobancyk, S., & Bedin, L. (2012). Bienestar subjetivo de los adolescentes: un estudio comparativo entre Argentina y Bra-sil. Psychosocial Intervention, 21(3), 273-280. doi:10.5093/ in2012a24
Seligson, J. L., Huebner, E. S., & Valois, R. F. (2003). Prelimi-nary validation of the Brief Multidimensional Student’s Life Satisfaction Scale (BMSLSS). Social Indicators Research, 61(2), 121-145. doi:10.1023/A:1021326822957
Strelhow, M. R. W., Paradiso, A. C., Sebold, R., Bedin, L. M., & Sarriera, J. C. (2011). Signifi cados atribuidos por los niños al concepto de espiritualidad. Trabalho apresentado no VI Congresso de Saúde Comunitária do Mercosul, Montevideo, Uruguai.
Tomyn, A. J., & Cummins, R. A. (2011). The subjective wellbe-ing of high-school students: Validatwellbe-ing the Personal Wellbewellbe-ing Index-School Children. Social Indicators Research, 101(3), 405-418. doi:10.1007/s11205-010-9668-6
Ubani, M., & Tirri, K. (2006). How do finnish pre-ado-lescents perceive religion and spirituality? Interna-tional Journal of Children’s Spirituality, 11(3), 357-370. doi:10.1080/13644360601014106
Van Dierendonck, D., & Mohan, K. (2006). Some thoughts on spirituality and eudaimonic well-being. Mental Health Religion & Culture, 9(3), 227-238. doi:10.1080/13694670600615383 Wills, E. (2009). Spirituality and subjective well-being: Evi-dences for a new domain in the Personal Well-Being Index. Journal of Happiness Studies, 10(1), 49-69. doi:10.1007/ s10902-007-9061-6
Yiengprugsawan, V., Seubsman, S., Khamman , S., Lim, L. L., Sleigh, A. C., & the Thai Cohort Study Team. (2010). Personal Wellbeing Index in a national cohort of 87,134 Thai adults. Social Indicators Research, 98(2), 201-215. doi:10.1007/ s11205-009-9542-6
Zinnbauer, B., Pargament, K. I., & Scott, A. B. (1999). The emerging meanings of religiousness and spirituality: Prob-lems and prospects. Journal of Personality, 67(6), 899-919. doi:10.1111/1467-6494.00077