WESLEY MENDES-DA-SILVA [email protected] Professor at Marriott School of Management,The Brigham Young University - Provo - Utah, United States
RICHARD SAITO [email protected]
Professor at Escola de Administração de Empresas de São Paulo, Fundação Getulio Vargas – São Paulo – SP, Brazil
ARTICLES
Submitted 04.16.2013. Approved 10.01.2013
Evaluated by double blind review process. Scientiic Editor: Wilson Toshiro Nakamura
STOCK EXCHANGE LISTING INDUCES
SOPHISTICATION OF CAPITAL BUDGETING
Listagem em bolsa induz sofisticação do orçamento de capital
La cotización bursátil lleva al perfeccionamiento de la presupuestación de capital
ABSTRACT
This article compares capital budgeting techniques employed in listed and unlisted companies in Brazil. We surveyed the Chief Financial Oicers (CFOs) of 398 listed companies and 300 large unlisted companies, and based on 91 respondents, the results suggest that the CFOs of listed companies tend to use less simplistic methods more often, for example: NPV and CAPM, and that CFOs of unlisted companies are less likely to estimate the cost of equity, despite being large companies. These in-dings indicate that stock exchange listing may require greater sophistication of the capital budgeting process.
KEYWORDS | Capital budgeting, inance survey, inancial decisions, corporate inance, inancial in-novation.
RESUMO
Este artigo compara técnicas de orçamento de capital empregadas nas empresas listadas e não-lista-das no Brasil. Emprega-se um survey dirigido aos Chief Financial Oicers (CFOs) de 398 empresas lis-tadas e 300 grandes empresas não-lislis-tadas e, com base em 91 respondentes, os resultados sugerem que os CFOs das empresas listadas tendem a usar mais intensamente métodos menos simplistas, e.g. VPL e CAPM, e que CFOs de empresas não-listadas menos provavelmente estimam o custo de capital próprio, mesmo se tratando de empresas de grande porte. Esses achados indicam que a listagem em bolsa pode requerer maior soisticação do processo de orçamento de capital.
PALAVRAS-CLAVE | Orçamento de Capital, survey em inanças, decisões inanceiras, inanças corpo-rativas, inovação inanceira.
RESUMEN
El presente artículo compara las técnicas de presupuestación empleadas por las empresas brasileñas cotizadas y no cotizadas. Encuestamos a los Gerentes de Finanzas Corporativos (Chief Financial Of-icers, CFO) de 398 empresas cotizadas y 300 grandes empresas no cotizadas, y, con base en 91 en-cuestados, los resultados sugieren que los CFO de las empresas cotizadas tienden a usar con más frecuencia métodos menos simplistas; por ejemplo: NPV y CAPM, y los CFO de las empresas no coti-zadas son menos propensos a estimar el costo de los fondos propios, a pesar de tratarse de grandes empresas. Estos resultados indican que la cotización de la bolsa de valores puede requerir un mayor perfeccionamiento del proceso de presupuestación de capital.
PALABRAS CLAVE | Presupuestación de capital, encuesta inanciera, decisiones inancieras, inanzas corporativas, innovación inanciera.
MOTIVATION
Studies that use surveys can contribute to the development of knowledge in Finance, taking into account the possibility of ob-taining data often unavailable elsewhere (Rea & Parker, 1997;
Baker & Mukherjee, 2007; Neuhauser, 2007). There are import-ant issues concerning inancial decisions that remain scarce-ly investigated, especialscarce-ly in the emerging markets (Lazaridis, 2004; Hermes, Smid, & Yao, 2007). Among the inancial deci-sions, capital budgeting is a signiicantly important topic, when dealing with the practices adopted by inancial managers, in determining which projects can best lead to the maximization of shareholder value. In recent years, authors such as Levine (1997) have indicated decreased demand for more simplistic inancial decisions, e.g. Payback and accounting ratios. This would be due to economic growth, which increases the sophis-tication of inancial markets (Scott & Petty II, 1984).
In the last 20 years, Brazil has experienced: i) relative economic and political stability; ii) capital market growth above the global average; iii) increased adoption of good corporate governance practices (Mendes-Da-Silva & Onusic, 2012). Nev-ertheless, surveys concerning the decision-making process em-ployed by companies reveal that the topic is very rarely studied - at the level of companies listed on the stock exchange, and especially when considering unlisted companies (Balbinotti, Benetti, & Terra, 2007; Frezatti, Bido, Cruz, Barroso, & Macha-do, 2012). This makes it interesting to investigate the impact of the sophistication of management quality and of national eco-nomic growth on inancial management practices, e.g., capital budgeting. This study assumes the argument found in the liter-ature, that companies listed on the stock exchange tend to have more sophisticated mechanisms for decision-making, or rath-er, less simplistic than unlisted companies, as a result of the need to report to the market (Booth, 1996; Drury & Tayles, 1996; Lazaridis, 2004).
Finance literature has provided evidence from around the world concerning the capital budgeting of companies, e.g., Gra-ham and Harvey (2001), Lazardis (2004), Du Toit and Pienaar (2005), Hermes et al., (2007). This article is similar to the latter, in that it uses an adaptation of its data collection instrument. In addition, in light of limited knowledge of the Brazilian context, the main contribution of this work is based on presenting Bra-zilian evidence, interesting both researchers and practitioners. Furthermore, according to Graham (2011), it constitutes a tool for teaching Corporate Finance.
By surveying 698 Brazilian companies (398 listed and 300 unlisted), the primary objective of this work is to compara-tively analyze the use of capital budgeting techniques by large
listed and unlisted companies. Based on 91 responding com-panies, the main indings suggest that the Chief Financial Oi-cers (CFOs) of listed companies tend to use less simplistic tech-niques, e.g., NPV and CAPM, compared to the CFOs of major unlisted companies. The latter tend not to estimate the cost of capital, suggesting some level of precariousness in the capital budgeting process, which supports recent arguments by Jacobs and Shivdasani (2012).
This article is organized into 6 Sections, including this introduction. Section 2 discusses previous studies regarding capital budgeting practices. Section 3 aims at reviewing the determinants of the capital budgeting practices. Section 4 de-tails the methodological procedures used in developing this study. Section 5 empirically analyzes the determinants for the use of capital budgeting practices. Lastly, the inal consider-ations are presented.
PREVIOUS STUDIES REGARDING
CAPITAL BUDGETING PRACTICES
From a modern standpoint, the cost of capital for companies is one of the most important aspects in capital budgeting de-cision-making (Jacobs & Shivdasani, 2012). Surveys about Bra-zilian practices are still scarce, among which: Balbinotti et al., (2007), focused on the methodological aspects of a sur-vey about inancial decisions (i.e. translation and validation of questionnaires), and Frezatti et al., (2012), who studied long-term inancial decisions, considering primarily unlisted com-panies. This article contributes to the literature by focusing on the determinants of capital budgeting practices, comparing list-ed and unlistlist-ed companies. Among the Finance studies featur-ing surveys, one of the categories found in the literature focus-es on capital budgeting practicfocus-es and techniqufocus-es adopted by the company (Gitman & Forrester, 1977;Schall, Sundem, & Gei-jsbeek, 1978; Bierman, 1993; Ryan & Ryan, 2002).
According to Hermes et al., (2007), this research primarily deals with four capital budgeting techniques: i) Net Present Value
in-dicate the limited number of studies on capital budgeting prac-tices in Brazil, even though this material is important for compa-nies’ performance and competitiveness, regardless of their level of maturity and size (Vos & Vos, 2000;Danielson & Scott, 2005).
The international literature on the use of diferent capital budgeting techniques by inancial managers has been character-ized by studies conducted in economies whose characteristics difer signiicantly from the Brazilian context (Bierman, 1993; Gra-ham & Harvey, 2002), although studies in emerging economies can be found (Du Toit & Pienaar, 2005). Namely, the research conducted by Gitman and Forrester (1997), in the United States;
Brounen et al., (2004), in Europe; Hermes et al., (2007), who compared the practices adopted in China and the Netherlands.
Hermes et al., (2007) support the viewpoint that, over time, the use of more sophisticated capital budgeting meth-ods has become more common. These authors argued that this phenomenon is mainly due to: i) the inancial markets have de-veloped over time, leading to the use of more relevant, conve-nient and necessary methods, e.g., Discounted Cash Flow (DCF); ii) CFOs’ training has increased over time; iii) advancement of the computational apparatus available to the CFOs; iv) reduced costs associated with acquiring technology.
DETERMINANTS OF THE CAPITAL
BUDGETING PRACTICES
Assuming that investing decisions are made by individuals, would it be a mistake to assume that the managers’ personal preferences and environmental conditions may inluence the capital budgeting decision (Hermes et al., 2007) and, by ex-tension, the company’s value? The literature has document-ed a wide range of motives that determine the choice of capi-tal budgeting practices. According to Klammer (1972), in the late 1950s, less than 20% of North American companies used DCF techniques as the primary method for selecting projects. In the early 1970s, this percentage was already 57%. In the following decade, Hendricks (1983) noted that 76% of companies used DCF methods as the primary decision tool.
The number of companies that used more simplistic meth-ods, for example PB, was reduced from 34% in 1959, to 11% of North American companies in 1981 (Hendricks, 1981). Along the same lines, Trahan and Gitman (1995), considering companies listed in the North American inancial media, showed that larger companies tend to make greater use of more sophisticated capital budgeting techniques, e.g., DCF techniques. In Asia, Kester et al., (1999) obtained results suggesting an increasing relevance of DCF techniques, but still predominantly non-DCF techniques, i.e., PB.
SURVEY DESIGN AND METHODOLOGY
To collect data for this study, we had access to the questionnaire used by Hermes et al., (2007, p. 636), composed of seven ques-tions. First, we proceeded with the adaptations, by observing the recommended practices with regard to the translation and validation of questionnaires used in inance surveys, detailed by Balbinotti et al., (2007, pp. 29-33). Speciically, we made the following changes: i) translation from English to Portuguese, done by a qualiied professional; ii) pre-test with 5 CFOs, mem-bers of the Brazilian Institute of Finance Executives; iii) inclu-sion of the Governance variable, missing from the original ques-tionnaire.
The questionnaire was used to survey the 398 companies listed in the BM&FBovespa and the 300 major companies not listed on the stock exchange, but listed in a traditional business media publication in the Brazilian market: Exame 1000 Maiores e Melhores(Editora Abril, 2012). In September and November of 2012, the questionnaires were sent/received (by mail) to/from CFOs of these companies. Each mailed envelope contained: the questionnaire, with a letter detailing the intentions of the study, its voluntary nature and the preservation of respondent ano-nymity; and a stamped envelope for the CFOs’ responses.
Of the 698 letters, 17 were returned due to the compa-ny’s change of address (9 were from listed companies), 52 val-id responses were received from listed companies, and anoth-er 39 from unlisted companies. This response rate (~13.4%) is similar to those obtained in previous studies of the same top-ic, e.g., Traham and Gitman (1995), 12%; Kester et al., (1999), 15.5%; Graham and Harvey (2001), 9%; and Brounen et al., (2004), 5%. With the intention of verifying the representative-ness of the group of respondent companies, albeit less detailed (since the respondents could not be identiied, to encourage the CFOs’ participation), among the listed companies we veri-ied the proportion of respondent companies, in comparison to the companies present in the BM&FBovespa, through their gov-ernance level. We checked, through a non-parametric indepen-dence test, and did not ind signiicant eviindepen-dence of self-selec-tion biases among listed companies, which was impossible to test among unlisted companies.
(using a scale of 1-6, where 1 = Never and 6 = Always); ii) the most commonly used method for estimating cost of capital; iii) the use of methods for estimating cost of equity; iv) problems associated with the use of DCF methods; and v) the reasons for using non-DCF methods.
The dependent (dummy) variables related to the capi-tal budgeting methods (Table 6) and the methods of estimating
cost of capital (Table 7) will receive the value = 1 if the score giv-en by the respondgiv-ent was ≥5 (on a scale of 1 to 6, where 1 = Nev-er and 6 = Always), and zNev-ero if othNev-erwise. Based on the variables related to the proiles of the company and the CFO, we used bi-nary response regressions (1) to verify the existence of associ-ations between these variables and the company’s tendency to use certain capital budgeting techniques.
(Y | )X F Z( )
e e
1
1 1
1 1
( )
i i Z
i 0 i
r =r = = =
+ -F = + -b+b
The dependent variables related to the problems with us-ing DCF and reasons for usus-ing non-DCF techniques (Table 8) will receive the value = 1 when indicated by the respondent, and zero when they were not chosen by the CFO. The independent variables used were:
Listed Company = 1 if the company is listed on the stock ex-change (BM&FBovespa), and zero if otherwise.
Size of Company = 1 if the company’s annual sales equal or ex-ceed BRL$ 300,000,000, and zero if otherwise.
CFO’s Education = 1 if the company’s CFO has a Doctorate or Masters, and zero if the CFO has a lower level of education.
CFO’s Age = 1 if the company’s CFO is at least 49 years old, or zero if the CFO is younger.
Governance = 1 if the company is listed on BM&FBovespa’s Novo Mercado (New Market) of, and zero if otherwise;
Operational Sector = 1 if the company is a manufacturer, and zero if otherwise.
With respect to capital budgeting techniques, we chose to list four of them explicitly in the questionnaire, in order to address those most commonly used by practitioners (Brounen et al., 2004; Hermes et al., 2007). The respondent was provid-ed the opportunity to indicate other techniques usprovid-ed by him, as well as their frequency of use. In addition, as previously sus-pected, there was a low frequency of other techniques, e.g., Real Options or Sensitivity Analysis. Based on this, we chose to disregard these empirical analysis techniques used.
RESULTS
The results obtained are reported in ive subsections. The irst describes the proiles of the company and the CFOs, and the second examines the determinants of the use of capital budget-ing techniques. The third presents the frequency of cost of cap-ital estimation techniques. The fourth reports the results of the logit regressions for capital budgeting techniques. Finally,
log-it regressions related to obstacles for using DCF techniques, as well as reasons for using non-DCF techniques.
Characteristics of the companies and the CFOs
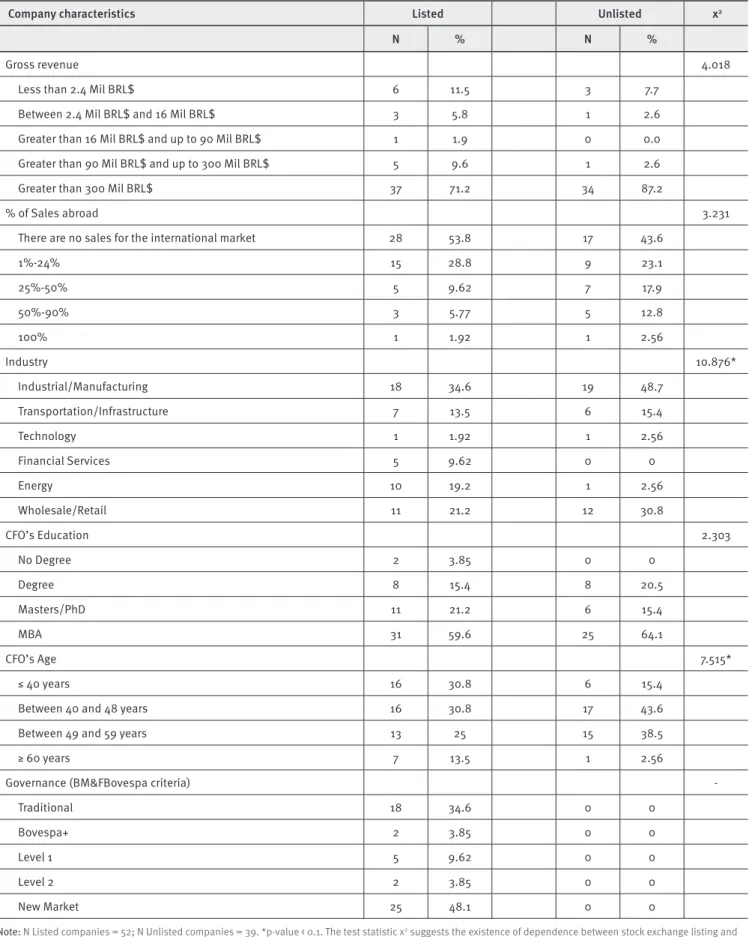
Table 1 displays the characteristics of the companies and CFOs participating in the study. More than half of the listed compa-nies indicated that their products are not intended for the for-eign market. Also, 40% of the unlisted companies reported having no export activities. It should also be noted that ap-proximately a third of the listed companies are composed of manufacturing companies, as well as almost half of the unlist-ed companies. Close to 80% of the CFOs claimunlist-ed to have a graduate degree.
In order to check for the existence of independence be-tween company characteristics and stock exchange listings, we used a nonparametric test, which indicated the existence of dependency in two classes of characteristics, i.e., Operation-al sector (X2 = 10.876; p-value <0.1) and CFO’s Age (X2 = 7.515; p-value <0.1). Concerning company size, the unlisted companies have higher sales. Or rather, while 80% of the listed companies have sales over BRL$90 million, nearly 90% of unlisted compa-nies are in this sales range. When considering sales abroad, we found that ~54% of the listed companies do not sell to the in-ternational market, while 43.6% of unlisted companies concen-trate 100% of their sales in the domestic market.
As for the CFOs’ characteristics, in general, there seems to be a greater frequency of professionals with a graduate level of education in the listed companies, i.e., 21.2% of the CFOs of these companies claim to have a Masters or Doctorate. This per-centage is similar to that found by Hermes et al., (2007), p. 637) for the Chinese market, and lower than that found in the Neth-erlands, 33%. Among the 39 unlisted companies, only 15.4% have this education level, in other words, it seems that among the companies not listed on the stock exchange, there is a pre-dominance of professionals with an educational level equiva-lent to MBAs, i.e., training programs with an executive focus.
TABLE 1.
Characteristics of the companies and the responding CFOs
Company characteristics Listed Unlisted χ2
N % N %
Gross revenue 4.018
Less than 2.4 Mil BRL$ 6 11.5 3 7.7
Between 2.4 Mil BRL$ and 16 Mil BRL$ 3 5.8 1 2.6
Greater than 16 Mil BRL$ and up to 90 Mil BRL$ 1 1.9 0 0.0
Greater than 90 Mil BRL$ and up to 300 Mil BRL$ 5 9.6 1 2.6
Greater than 300 Mil BRL$ 37 71.2 34 87.2
% of Sales abroad 3.231
There are no sales for the international market 28 53.8 17 43.6
1%-24% 15 28.8 9 23.1
25%-50% 5 9.62 7 17.9
50%-90% 3 5.77 5 12.8
100% 1 1.92 1 2.56
Industry 10.876*
Industrial/Manufacturing 18 34.6 19 48.7
Transportation/Infrastructure 7 13.5 6 15.4
Technology 1 1.92 1 2.56
Financial Services 5 9.62 0 0
Energy 10 19.2 1 2.56
Wholesale/Retail 11 21.2 12 30.8
CFO’s Education 2.303
No Degree 2 3.85 0 0
Degree 8 15.4 8 20.5
Masters/PhD 11 21.2 6 15.4
MBA 31 59.6 25 64.1
CFO’s Age 7.515*
≤ 40 years 16 30.8 6 15.4
Between 40 and 48 years 16 30.8 17 43.6
Between 49 and 59 years 13 25 15 38.5
≥ 60 years 7 13.5 1 2.56
Governance (BM&FBovespa criteria)
-Traditional 18 34.6 0 0
Bovespa+ 2 3.85 0 0
Level 1 5 9.62 0 0
Level 2 2 3.85 0 0
New Market 25 48.1 0 0
Note: N Listed companies = 52; N Unlisted companies = 39. *p-value < 0.1. The test statistic χ2 suggests the existence of dependence between stock exchange listing and
TABLE 2.
Intensity of use of diferent capital budgeting methods by CFOs
DCF Non-DCF
NPV IRR PB ARR Others
Panel A: Listed (N = 52)
% Scores 5 or 6 84.6% 75.0% 50.0% 13.4% 13.5%
Average score 5.30 4.90 4.00 2.50 2.0
Company Size
Annual revenue ≤ BRL$ 300,000,000 5.50 4.70 3.70 2.50 1.33
Annual revenue > BRL$ 300,000,000 5.20 5.00 4.20 2.50 1.84
CFO’s Education
Yes 5.36 4.91 4.00 2.27 1.82
No 5.32 4.90 4.02 2.56 1.66
CFO’s Age
<49 years 5.40 5.00 4.00 2.3 1.56
≥49 years 5.30 4.80 4.00 2.9 1.90
Operational Sector
Manufacturing 5.17 5.39 4.61* 2.72 1.28
Others 5.41 4.65 3.71 2.38 1.91
International sales
≤50% 5.27 4.81* 3.88* 2.50 1.69
>50% 6.0 6.0 5.75 2.50 1.75
Governance
Yes 5.6 5.5 4.5 2.5 1.8
No 5.0 4.3 3.6 2.5 1.6
Panel B: Unlisted (N = 39)
% Scores 5 or 6 61.5 61.5 56.4 20.50 15.3
Average score 4.60
(720)*** 4.50 (809)* 4.40 2.50 1.74
Company Size
Annual revenue ≤ BRL$ 300,000,000 5.40 5.40 5.20 1.40 1.00
Annual revenue > BRL$ 300,000,000 4.50 4.40 4.40 2.70 1.85
CFO’s Education
Yes 5.0 4.80 4.80 2.20 2.50
No 4.60 4.50 4.40 2.60 1.61
CFO’s Age
<49 years 4.52 4.13* 4.30 2.83 1.61
≥49 years 4.81 5.06 4.69 2.13 1.94
Operational Sector
Manufacturing 4.70 4.30 4.90 2.10 1.79
Others 4.60 4.70 4.00 3.00 1.70
International sales
≤50% 4.55 4.48 4.58 2.70 1.73
>50% 5.17 4.67 3.83 1.67 1.83
Thus, we noted that 64.1% of the executives of these companies have at most an MBA. On the other hand, this per-centage fell to 59.6% in listed companies. As for the CFOs’ age, we noted that ~80% of the executives of unlisted companies are between 40 and 59 years old. On the other hand, this percent-age was less than 56% for listed companies. Finally, concern-ing the adoption of corporate governance practices identiied as recommended, 25 companies (~48% of the listed companies) belong to the New Market.
Capital budgeting techniques adopted by the
companies
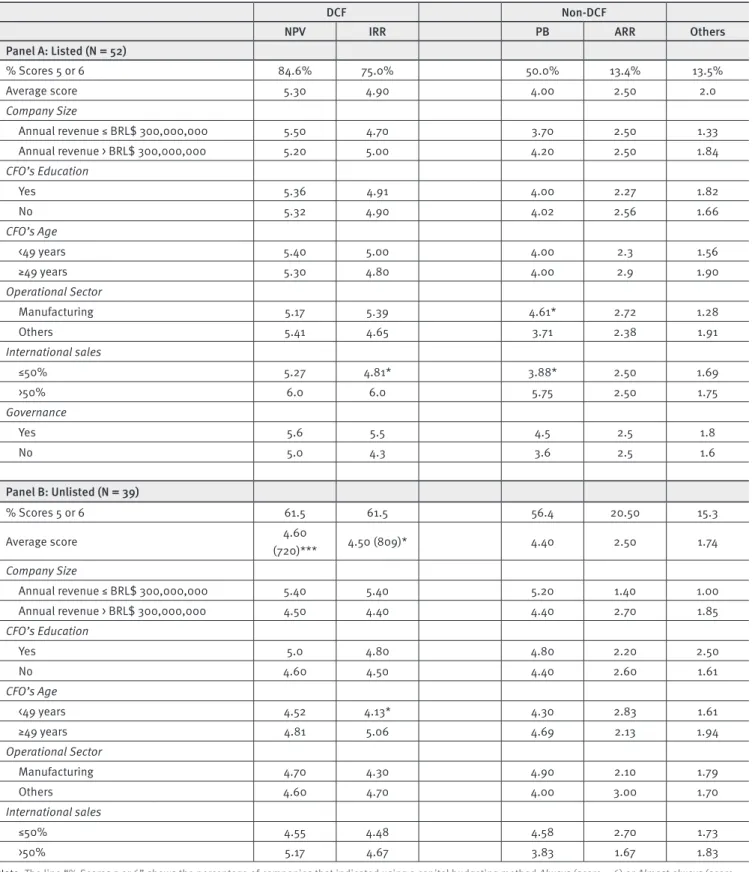
Table 2 shows the results related to the use of capital budgeting techniques among various company proiles. In a similar man-ner to that of Graham and Harvey (2001), Brounen et al., (2004) and Hermes et al., (2007), we asked how often various capital budgeting methods are used, using a 6-point scale (where 1 = Never and 6 = Always).
This provides information about the methods currently used by CFOs for capital budgeting decisions, as well as the rel-ative importance of these diferent methods. The following cap-ital budgeting techniques were used - DCF methods: NPV and IRR; and non-DCF methods: PB and ARR, and other techniques listed by the respondents, e.g., EBITDA.
From a technical standpoint, the NPV is the least sim-plistic technique, followed by the IRR (Hermes, et al., 2007). Moreover, the non-DCF techniques are regarded as less ac-curate and less sophisticated, in particular the PB. We found that 84.6% of the CFOs of listed companies claimed to use the NPV always or almost always (scores ≥5). This per-centage is close to that found by Hermes et al., (2007) for the Dutch market (89%), and higher than that found in Chi-na (49%). However, in Brazil, according to the responses provided by the CFOs of unlisted companies, this percent-age falls to 61.5%. Nevertheless, regardless or being listed or unlisted on the Stock Exchange, the companies seem to indicate NPV as the most used method, making it the most popular among respondents.
It is worth noting, however, that according to the re-sponses for unlisted companies, the scores given to the NPV are very close to those obtained by the IRR. That is, both the NPV and the IRR were indicated by ~61.5% of the CFOs. This response was not found with the listed companies, among which the IRR was found to be less commonly used than the NPV. We also found that non-DCF techniques seem to be more heavily used by the CFOs of unlisted companies. This observation is consistent with the lower educational level of
the CFOs. In other words, the findings suggest an associa-tion between the CFO’s educaassocia-tional level and their prefer-ence for capital budgeting techniques. As such, it seems that the non-DCF techniques, which are less accurate and more simplistic, may be preferred by the CFOs with a lower edu-cational level.
Methods for estimating cost of capital
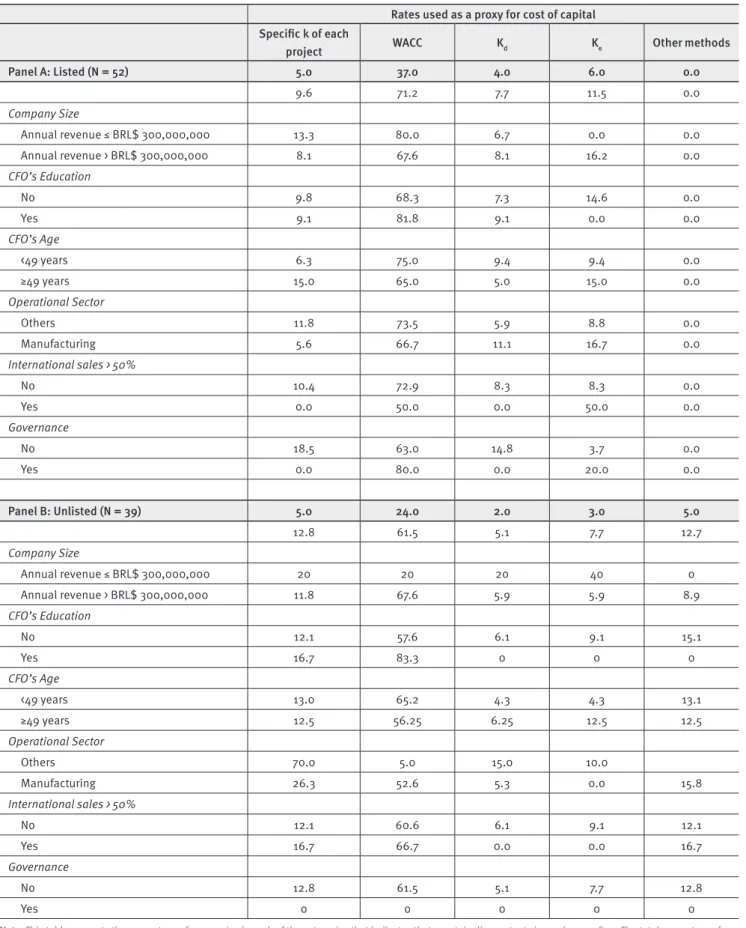
With regard to the methods for estimating the cost of capi-tal, which is an important and necessary aspect for DCF tech-niques, e.g., NPV and IRR, we asked that the CFOs indicate which methods they used most often to estimate the cost of capital (Table 3).
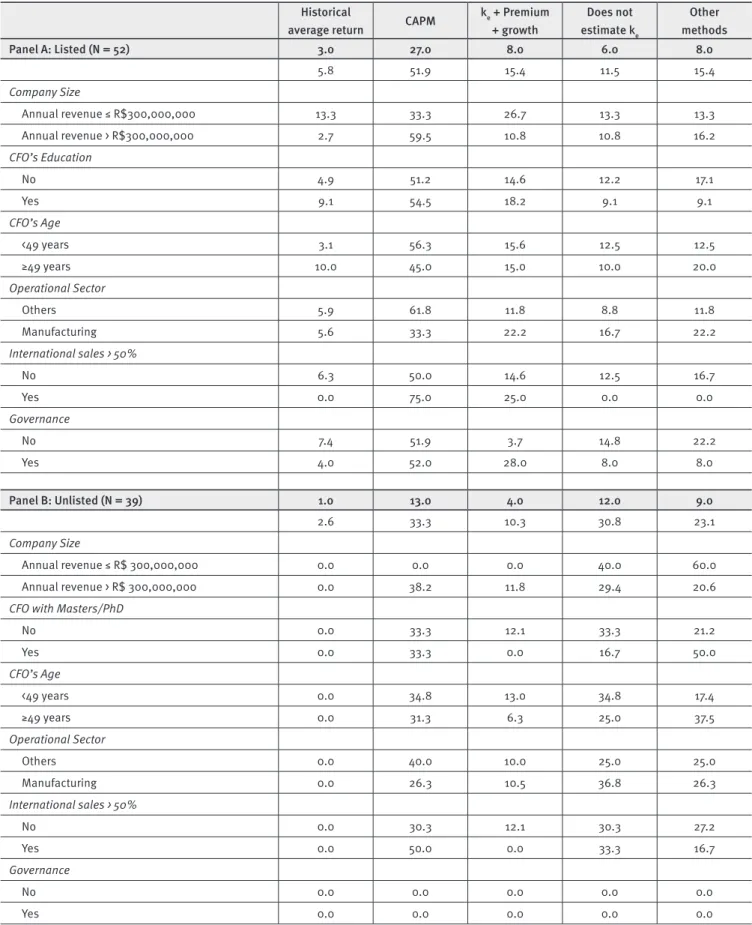
It is understood that, the cost of capital adjusted to the risk of each project, as well as the WACC constitute less sim-plistic techniques. The cost of debt (kd) is explicitly less so-phisticated than both of these, despite situations in which projects are fully financed with debt issuances. Table 3 shows that 37% of the listed companies claim to use the WACC as the discount rate for cash flows in evaluating their projects. Table 4, on the other hand, presents the responses obtained for different methods that companies use to calculate their cost of equity (ke). An aspect worth mentioning is that, ac-cording to the contents of Table 4, among the listed compa-nies, 11% claim not to calculate ke. Among the unlisted com-panies, this percentage is ~31%.
This suggests a certain precariousness of the deci-sion-making process for capital budgeting, to the extent that the unfamiliarity with ke may lead to signiicant mistakes in deci-sion making, whether by accepting or rejecting investment proj-ects. A similar phenomenon was recently observed by Jacobs and Shivdasani (2012) in the North American market. In these authors’ opinion, most companies have used erroneous prem-ises to calculate the cost of capital. Therefore, they tend to make inancial decisions that are not aligned with the goal of creating value for the company.
TABLE 3.
Most commonly used methods for measuring the cost of capital (% of total)
Rates used as a proxy for cost of capital
Speciic k of each
project WACC Kd Ke Other methods
Panel A: Listed (N = 52) 5.0 37.0 4.0 6.0 0.0
9.6 71.2 7.7 11.5 0.0
Company Size
Annual revenue ≤ BRL$ 300,000,000 13.3 80.0 6.7 0.0 0.0
Annual revenue > BRL$ 300,000,000 8.1 67.6 8.1 16.2 0.0
CFO’s Education
No 9.8 68.3 7.3 14.6 0.0
Yes 9.1 81.8 9.1 0.0 0.0
CFO’s Age
<49 years 6.3 75.0 9.4 9.4 0.0
≥49 years 15.0 65.0 5.0 15.0 0.0
Operational Sector
Others 11.8 73.5 5.9 8.8 0.0
Manufacturing 5.6 66.7 11.1 16.7 0.0
International sales > 50%
No 10.4 72.9 8.3 8.3 0.0
Yes 0.0 50.0 0.0 50.0 0.0
Governance
No 18.5 63.0 14.8 3.7 0.0
Yes 0.0 80.0 0.0 20.0 0.0
Panel B: Unlisted (N = 39) 5.0 24.0 2.0 3.0 5.0
12.8 61.5 5.1 7.7 12.7
Company Size
Annual revenue ≤ BRL$ 300,000,000 20 20 20 40 0
Annual revenue > BRL$ 300,000,000 11.8 67.6 5.9 5.9 8.9
CFO’s Education
No 12.1 57.6 6.1 9.1 15.1
Yes 16.7 83.3 0 0 0
CFO’s Age
<49 years 13.0 65.2 4.3 4.3 13.1
≥49 years 12.5 56.25 6.25 12.5 12.5
Operational Sector
Others 70.0 5.0 15.0 10.0
Manufacturing 26.3 52.6 5.3 0.0 15.8
International sales > 50%
No 12.1 60.6 6.1 9.1 12.1
Yes 16.7 66.7 0.0 0.0 16.7
Governance
No 12.8 61.5 5.1 7.7 12.8
Yes 0 0 0 0 0
TABLE 4.
Most frequently used methods for estimating the cost of equity in % of total
Historical
average return CAPM
ke + Premium + growth
Does not estimate ke
Other methods
Panel A: Listed (N = 52) 3.0 27.0 8.0 6.0 8.0
5.8 51.9 15.4 11.5 15.4
Company Size
Annual revenue ≤ R$300,000,000 13.3 33.3 26.7 13.3 13.3
Annual revenue > R$300,000,000 2.7 59.5 10.8 10.8 16.2
CFO’s Education
No 4.9 51.2 14.6 12.2 17.1
Yes 9.1 54.5 18.2 9.1 9.1
CFO’s Age
<49 years 3.1 56.3 15.6 12.5 12.5
≥49 years 10.0 45.0 15.0 10.0 20.0
Operational Sector
Others 5.9 61.8 11.8 8.8 11.8
Manufacturing 5.6 33.3 22.2 16.7 22.2
International sales > 50%
No 6.3 50.0 14.6 12.5 16.7
Yes 0.0 75.0 25.0 0.0 0.0
Governance
No 7.4 51.9 3.7 14.8 22.2
Yes 4.0 52.0 28.0 8.0 8.0
Panel B: Unlisted (N = 39) 1.0 13.0 4.0 12.0 9.0
2.6 33.3 10.3 30.8 23.1
Company Size
Annual revenue ≤ R$ 300,000,000 0.0 0.0 0.0 40.0 60.0
Annual revenue > R$ 300,000,000 0.0 38.2 11.8 29.4 20.6
CFO with Masters/PhD
No 0.0 33.3 12.1 33.3 21.2
Yes 0.0 33.3 0.0 16.7 50.0
CFO’s Age
<49 years 0.0 34.8 13.0 34.8 17.4
≥49 years 0.0 31.3 6.3 25.0 37.5
Operational Sector
Others 0.0 40.0 10.0 25.0 25.0
Manufacturing 0.0 26.3 10.5 36.8 26.3
International sales > 50%
No 0.0 30.3 12.1 30.3 27.2
Yes 0.0 50.0 0.0 33.3 16.7
Governance
No 0.0 0.0 0.0 0.0 0.0
Yes 0.0 0.0 0.0 0.0 0.0
Capital budgeting techniques, cost of capital and estimating the cost of equity: bivariate and
multivariate analysis
This subsection addresses the results obtained from the logit models (Tables 6, 7 and 8), according to , which expresses the
prob-ability πi of the i-th company using certain capital budgeting techniques. In order to verify robustness, OLS regressions were per-formed, as an alternative to the logit model, with no diferences found between the two test methods.
l 1 n
P
P Listed Company Company Size
CFO’s Education CFO’s Age
Operational Sector Governance u
3 i
i i
1 2 i i
4 i 5 i
6 i 7 i i
r { { {
{ {
{ {
=
- = + +
+ +
+ + +
c m
Where: Listed Company is the dummy variable that indicates if the i-th company is listed in the stock exchange (value = 1) or not (val-ue = 0), and other independent variables: Company Size, CFO’s Education, CFO’s Age, Governance and Operational Sector with as the stochastic disturbance term. Table 5 presents the correlation coeicients between the independent variables, noting that only
Company Size showed signiicant correlation with Listed companies. No multicollinearity problems were found in the regressions.
TABLE 5.
Correlation matrix for independent variables used in the estimates
Listed Company Company Size CFO’s Education CFO’s Age Operational Sector
Company Size -0.192 *
CFO’s Education 0.073 -0.018
CFO’s Age -0.026 -0.059 0.016
Operational Sector -0.142 -0.155 -0.110 0.108
Governance 0.533 *** 0.029 0.084 -0.095 -0.108
Note: *p-value < 0,01; **p-value < 0.05; ***p-value < 0.1.
In Table 6, the dependent variables were created as fol-lows: NPV = 1 if the score given by the company for the NPV meth-od was ≥5, and NPV = 0 if otherwise; IRR = 1 if the score given by the company for the IRR method was ≥5, and IRR = 0 if other-wise; PB = 1 if the score given by the company for the PB method was ≥5, and PB = 0 if otherwise. Model I suggests that the stock exchange listing increases the company’s likelihood to use NPV more commonly as a capital budgeting technique ({2 ≈ – 1.235; p – value < 0.05). This could corroborate the arguments of Levine (1997), who claimed that listed companies tend to maintain struc-tures and practices aimed at greater sophistication of the capital budgeting decision-making process. In other words, with the de-velopment of capital markets, the investors’ demand for the qual-ity of inancial decisions is expected to grow.
However, when considering the other independent variables (Model II), one can note that the Company’s Size
({2 ≈ – 1.396; p – value < 0.1) seems to have a more expres-sive and significant effect on the tendency to use NPV, high-lighting that smaller companies tend to use NPV less often. It
is worth noting that unlisted companies are the largest (Tables 1 and 5). Model VI shows that there seems to be an association be-tween the CFO’s Age and their preference for greater use of more simplistic techniques, e.g., PB ({5 ≈ – 0.829; p – value < 0.1).
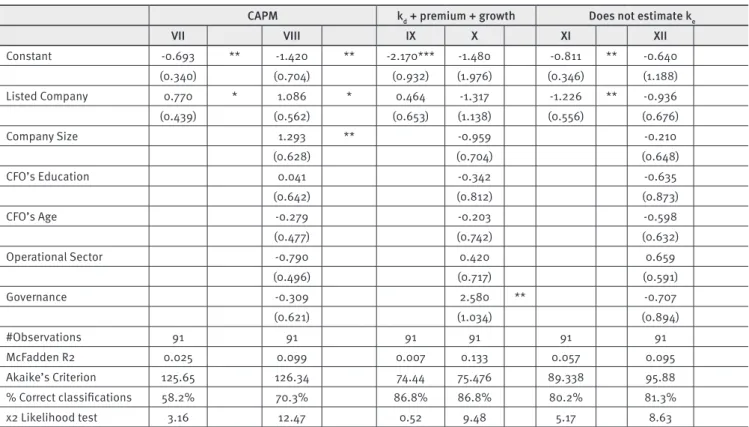
Table 7 presents the estimated coeicients for models whose dependent variables are the use of diferent methods for obtaining the cost of equity, as well as not calculating the Ke . The results obtained in Models VII and VIII suggest that the listed companies on the Stock Exchange are more likely to indicate the CAPM as a method for calculating the cost of equity. Thus, con-sidering the coeicients obtained in Model VII, we observed that the efect of stock exchange listing ({2 ≈ 0.770; p – value < 0.1) on the probability of using CAPM as a method for calculating the cost of equity is ~18.59 percentage points. This impact is even more signiicant ({2 ≈ 1.086; p – value < 0.1) when considering the efect of Company Size, i.e., Model VIII suggests an increase of ~25.46 percentage points. A detailed discussion regarding in-terpretation of the estimated coeicients in the logit model can be found in Wooldridge (2011, pp. 535-548).
TABLE 6.
Determinants of the capital budgeting methods (logit)
NPV IRR PB
I II III IV V VI
Constant 0.470 1.689 * 0.470 0.550 0.258 -0.776
(0.329) (0.883) (0.329) (0.713) (0.323) (0.720)
Listed Company 1.235 ** 0.506 0.629 -0.035 -0.258 -0.845
(0.506) (0.614) (0.459) (0.534) (0.426) (0.566)
Company Size -1.396 * -0.390 -0.053
(0.787) (0.581) (0.560)
CFO’s Education 1.076 0.387 0.853
(0.819) (0.660) (0.556)
CFO’s Age 0.111 0.325 0.829 *
(0.540) (0.501) (0.487)
Operational Sector -0.349 0.158 1.366 ***
(0.526) (0.484) (0.500)
Governance 1.392 1.576 ** 1.424 **
(0.895) (0.735) (0.639)
#Observations 91 91 91 91 91 91
McFadden R2 0.060 0.135 0.016 0.070 0.002 0.139
Akaike’s Criterion 100.61 103.02 114.45 118.45 129.51 122.30
% correct classiication 74.7% 74.7% 69.2% 69.2% 52.7% 68.1%
χ2 Likelihood test 6.27 13.86 1.88 7.87 0.37 17.57
Note: All of the models presented in this table were estimated using the logit method. In parentheses, under each coeicient, is the standard error of the estimate for each coeicient obtained. The estimates were obtained with a robust standard error using the procedure suggested by Davidson and Mackinnon (2004, p. 250). *p-value < 0.01; **p-value < 0.05; ***p-value < 0.1.
TABLE 7.
Determinants of the methods for estimating the cost of equity (logit)
CAPM kd + premium + growth Does not estimate ke
VII VIII IX X XI XII
Constant -0.693 ** -1.420 ** -2.170*** -1.480 -0.811 ** -0.640
(0.340) (0.704) (0.932) (1.976) (0.346) (1.188)
Listed Company 0.770 * 1.086 * 0.464 -1.317 -1.226 ** -0.936
(0.439) (0.562) (0.653) (1.138) (0.556) (0.676)
Company Size 1.293 ** -0.959 -0.210
(0.628) (0.704) (0.648)
CFO’s Education 0.041 -0.342 -0.635
(0.642) (0.812) (0.873)
CFO’s Age -0.279 -0.203 -0.598
(0.477) (0.742) (0.632)
Operational Sector -0.790 0.420 0.659
(0.496) (0.717) (0.591)
Governance -0.309 2.580 ** -0.707
(0.621) (1.034) (0.894)
#Observations 91 91 91 91 91 91
McFadden R2 0.025 0.099 0.007 0.133 0.057 0.095
Akaike’s Criterion 125.65 126.34 74.44 75.476 89.338 95.88
% Correct classiications 58.2% 70.3% 86.8% 86.8% 80.2% 81.3%
χ2 Likelihood test 3.16 12.47 0.52 9.48 5.17 8.63
In other words, the results show that the decision to use CAPM as the technique for calculating the cost of equity is also determined by the company’s size; together, these two variables signiicantly afect the likelihood of a company us-ing CAPM more often. This also means that smaller companies, not listed on the stock exchange, are less likely to use CAPM very often as a method for calculating the cost of equity. This inding supports the arguments and indings of Hermes et al., (2007). Also on Table 7, Model XI presents coeicients that sug-gest that stock exchange listing may lead to greater willingness to calculate the cost of equity ({2 ≈ – 1.226; p – value < 0.05). But, when considering the other independent variables
(Mod-el XII), this efect was no longer signiicant, despite maintain-ing the sign ({2 ≈ – 0.936; p – value > 0.1).
Obstacles for the use of DCF techniques and
reasons for using non-DCF techniques
Table 8 presents the results obtained for problems identiied in us-ing DCF techniques, and the advantages of usus-ing non-DCF tech-niques (models XVII and XVIII). According to the results obtained in model XIV, it seems that the older CFOs (over age 50) less common-ly perceive the diicultcommon-ly in estimating risk as a factor that could dis-courage the use of DCF techniques ({5 ≈ – 1.272; p – value < 0.05).
TABLE 8.
Determinants of problems and obstacles for using the DCF and determinants of the motivation for using
non-DCF methods (logit)
Diiculty estimating risk Diiculty including strategy in the project
Other advantages of using non-DCF techniques
XIII XIV XV XVI XVII XVIII
Constant -0.154 -1.074 0.154 0.731 -1.204*** -2.610 ***
(0.321) (0.712) (0.321) (0.741) (0.380) (0.869)
Listed Company 0.308 0.711 -0.308 -0.098 0 -0.719
(0.425) (0.618) (0.425) (0.559) (0.503) (0.796)
Company Size 0.747 -0.194 1.180 *
(0.563) (0.595) (0.714)
CFO’s Education -0.347 -0.177 0.801
(0.639) (0.528) (0.612)
CFO’s Age -1.272 ** 0.271 0.332
(0.508) (0.463) (0.545)
Operational Sector 1.678 *** -0.995 ** 0.115
(0.513) (0.483) (0.586)
Governance 0.043 -0.814 1.428 *
(0.635) (0.603) (0.776)
#Observations 91 91 91 91 91 91
McFadden R2 0.004 0.142 0.004 0.058 0.089
Akaike’s Criterion 129.61 122.15 129.61 132.79 102.31 103.56
% Correct classiications 53.8 65.9% 53.8% 61.5% 76.9% 76.9%
χ2 Likelihood test 0.52 17.99 0.53 7.35 - 8.75
However, the perception that the diiculty in estimat-ing risk may be a factor that constitutes an obstacle for usestimat-ing DCF techniques is also explained by the company’s operation-al sector. Rather, the manufacturing companies seem to have a greater propensity to understand the estimation of risk as an ob-stacle for using DCF techniques ({ ≈ 1.678; p-value < 0.01). Nev-ertheless, contrary to that obtained in Model XIV, the explana-tory model of the diiculty of contemplating strategic factors in project evaluation, the manufacturing companies demonstrat-ed a less restrictive view regarding the use of DCF techniques.
DISCUSSION AND FINAL
CONSIDERATIONS
This article aimed to compare the level of use of capital budget-ing techniques among companies listed in the stock exchange and large companies not listed in the stock exchange, in an emerging economy, Brazil. Based on the arguments presented in the literature, we expected that the company’s level of de-velopment, e.g., stock exchange listing, would impact the cap-ital budgeting practices adopted by the companies. The moti-vation for this study is based on three important factors. First, the inancial markets have shown explicit development over time, including the Brazilian market (Mendes-Da-Silva & Onu-sic, 2012). Therefore, one would expect the use of DCF meth-ods to be the most suitable, convenient and necessary (Hermes et al., 2007). Second, the training level of CFOs has increased over time, which may support the adoption of more sophisticat-ed capital budgeting techniques (Graham, 2011). Third, the in-creased availability of computer tools, coupled with the reduc-tion of technology costs, may facilitate and encourage the use of more advanced techniques.
This study was developed based on a survey of 698 Brazil-ian companies, of which 398 were listed and 300 unlisted. Thus, from a response rate of around 13%, the data set consisted of 91 companies, including both listed and unlisted. The data analy-sis was conducted based on nonparametric tests and logit mod-els, which focused on the potential efect that the need to report to the market (listed companies) could have on capital budgeting practices. In other words, in order to verify if the adoption of cap-ital budgeting practices difers signiicantly between listed com-panies and unlisted comcom-panies. Also, if these diferences can be explained by the characteristics of the company and the CFO. Tak-ing into account the growth of the Brazilian market, we found the development of this study to be interesting, since the internation-al literature had examined the adoption of capitinternation-al budgeting prac-tices, but mainly in developed economies, or in Asian markets.
The main indings suggest that the CFOs of listed com-panies tend to use more sophisticated techniques, e.g., NPV (when not considering the full set of independent variables) and CAPM (even considering all of the independent variables), when compared to CFOs of the largest unlisted companies. This ind-ing supports the arguments presented in previous works, such as the work developed by Hermes et al., (2007). Rather, taking into account the need to report to the participants of capital markets, the CFOs of listed companies seem to use the capital budgeting techniques more commonly regarded by literature as more sophisticated. This suggests the explicit need to intensify the training of CFOs who still employ less sophisticated meth-ods for capital budgeting decision-making (Kester et al.,, 1999; Coleman, 2007; Graham, 2011).
These indings highlight two issues to consider. The irst is related to the demand for CFO education, as a means to en-courage the adoption of less simplistic capital budgeting prac-tices, notably among listed companies, in view of the need to report to the market. The second issue worthy of mentioning, aside from the CFO’s educational level, is the prioritization of less simplistic capital budgeting practices being subject to the performance of governance structure, i.e., the Board, pressure from investors and shareholder activism. Given the growth of the Brazilian capital market, and the speciicities of this mar-ket, it is worth mentioning the importance of the performance of corporate governance structures, notably the company’s Board, and the shareholders on the CFO’s role, in relation to maximi-zation of company value. Moreover, recent studies have intro-duced the discussion of the inappropriate use of capital bud-geting techniques leading to value destruction. That is, both the adoption of projects with low attractiveness, as well as the re-jection of projects with the potential to create value are undesir-able for the company (Dixit & Pindyck, 1995; Cassimon, Backer, Engelen, Wouwe, & Yordanov, 2011).
It is important to highlight the possibility of self-selection biases in the set of respondent companies. This could result in possible distortions in research indings, i.e., companies that employ more simplistic and rudimentary methods of investment analysis may be less willing to respond to the survey, since they could attribute less importance to the topic. Thus, the indings achieved in this study may be, at least to some degree, overstat-ed in terms of the sophistication level of the capital budgeting process at large Brazilian companies.
of studies regarding capital budgeting practices, especially in emerging economies, one can see that future research may be relevant and contributory. For example: i) replicating this study in the future, checking the progress in adopting capital budget-ing practices; ii) developbudget-ing similar studies in other emergbudget-ing economies, exploring the efect of the level of market develop-ment on the practices adopted by the CFOs; iii) expanding this study, exploring potential efects of adopting capital budgeting techniques with diferent levels of sophistication on the com-pany’s value; iv) given the possibility of destroying the compa-ny’s value by making poor decisions, we suggest analyzing the efects of corporate governance structures and shareholder ac-tivism on capital budgeting practices employed by CFOs (Park & Park, 2004). These issues are beyond the scope of this study, but they undoubtedly constitute good motivation for future re-search in the area of Finance.
NOTE OF APPRECIATION
This paper was developed in collaboration with AES Eletropaulo, through the R&D project ##4690000854, focusing on inancial innovation. The authors are sin-cerely grateful to the anonymous reviewers from RAE, and their suggestions and criticisms that helped im-prove the original manuscript of this work. We also thank the CFOs who voluntarily responded to the sur-vey. We must also mention the two FGV-EAESP students who assisted in data collection: Henrique Consentino and Fernando Mange Niemeyer.
REFERENCES
Baker, H. K. & Mukherjee, T. K. (2007). Survey research in inance: views from journal editors. International Journal of Managerial Finance, 3(1), 11-25.
Balbinotti, M. A. A., Benetti, C. & Terra, P. R. S. (2007). Translation and validation of the Graham-Harvey survey for the Brazilian context. Inter-national Journal of Managerial Finance, 3(1), 26-48.
Bierman, H. (1993). Capital budgeting in 1992: a survey. Financial Man-agement, 22(3), 24.
Booth, L. (1996). Making capital budgeting decisions in multinational corporations. Managerial Finance, 22(1), 3-18.
Brounen, D., De Jong, A., & Koedjk, K. (2004). Corporate inance in Eu-rope: confronting theory with practice. Financial Management, 33(4), 71-101.
Cassimon, D., Backer, M. D., Engelen, P. J., Wouwe, M.V., & Yordanov, V. (2011). Incorporating technical risk in compound real option models to value a pharmaceutical R&D licensing opportunity. Research Policy, 40(9), 1200-1216.
Coleman, L. (2007). Risk and decision making by inance executives a survey study. International Journal of Managerial Finance, 3(1), 108-124.
Copeland, T. & Antikarov, V. (2003). Real Options: Practitioner’s guide. Cengage : New York.
Danielson, M. G. & Scott, J. A. (2005). The capital budgeting decisions of small businesses. Philadelphia, PA.
Davidson, R. & Mackinnon, J. G. (2004). Econometric theory and meth-ods. New York: Oxford University Press.
Dixit, A. K. & Pindyck, R. S. (1995). The options approach to capital in-vestment. Harvard Business Review, May-June, 105-115.
Drury, C. & Tayles, M. (1996). UK capital budgeting practices: some addi-tional survey evidence. European Journal of Finance, 2(4), 371-388. Du Toit, M. J. & Pienaar, A. (2005). A review of the capital budgeting behavior of large South African irms. Meditari Accountancy Research, 13(1), 19-27.
Editora Abril. (2012). 1000 Maiores e Melhores. São Paulo, SP.
Frezatti, F., Bido, D. S., Cruz, A. P. C., Barroso, M. F. G., & Machado, M. J. C.(2012). Decisões de investimento em ativos de longo prazo nas em-presas brasileiras: qual a aderência ao modelo teórico? Revista de Ad-ministração Contemporânea, 16(1), 1-22.
Gitman, L. J. & Forrester, J. R. (1977). A survey of capital budgeting tech-niques used by major U.S. irms. Financial Management, 6(3), 66-71. Graham, J. R. (2011). Using CFO surveys as a motivational tool to teach corporate inance. Financial Review, 46(2), 193-205.
Graham, J. & Harvey, C. (2001). The theory and practice of corporate inance: evidence from ield. Journal of Financial Economics, 60(2-3), 187-243.
Graham, J. & Harvey, C. (2002). How do CFOs make capital budgeting and capital structure decisions? Journal of Applied Corporate Finance, 15(1), 8-23.
Hendricks, J. A. (1983). Capital budgeting practices including inlation adjustments: a survey. Managerial Planning, 31(4), 22-28.
Hermes, N., Smid, P., & Yao, L. (2007). Capital budgeting practices: a comparative study of the Netherlands and China. International Business Review, 16(5), 630-654.
Istvan, D. F. (1961). The economic evaluation of capital expenditures. Journal of Business, 34(1), 45-51.
Jacobs, M. T. & Shivdasani, A. (2012). Do you know your cost of capital? Harvard business review. July-August, 1-8.
Kester, G., Chang, R. P., Echanis, E. S., Haikal, S., Isa, M. Md., & Skul-ly, M. T. (1999). Capital budgeting practices in the Asia-Paciic region: Australia, Hong Kong, Indonesia, Malaysia, Philippines, and Singapore. Financial Practice Education, 9(1), 25-33.
Klammer, T. P. (1972). Empirical evidence on the application of sophisti-cated capital budgeting techniques. Journal of Business, 45(3), 387-397. Lazaridis, I. T. (2004). Capital budgeting practices: a survey in the irms in Cyprus. Journal of Small Business Management, 42(4), 427-433.
Levine, R. (1997). Financial development and economic growth: views and Agenda. Journal of Economic Literature, 35(2), 688-726.
Miller, J. H. (1960). A glimpse at practice in calculating and using return on investment. N. A. A. Bulletin (now Management Accounting) June, 65-76.
Neuhauser, K. (2007). Survey research in inance. International Journal of Managerial Finance, 3(1), 5-10.
Park, Y. & Park, G. (2004). A new method for technology valuation in mon-etary value: procedure and application. Technovation, 24(5), 387-394.
Rea, L. M. & Parker, R.A. (1997). Designing and Conducting Surveys Re-search, 2nd ed., Josey-Bass Publishers, San Francisco, CA.
Ryan, P. A. & Ryan, G.P. (2002). Capital budgeting practices of the for-tune 1000: how have things changed? Journal of Business and Manage-ment, 8(4), 355.
Schall, L. D., Sundem, G. L., & Gejsbeek, W. R., Jr. (1978). Survey and anal-ysis of capital budgeting methods. Journal of Finance, 33(1), 281-287.
Scott, D. Jr. & Petty II, W. (1984). Capital budgeting practices in large American irms: a retrospective analysis and synthesis. Financial Re-view, 19(1), 111–123.
Trahan, E. A. & Gitman, J. L. (1995). Bridging the theory-practice gap in corporate inance: a survey of chief inancial oicers. Quarterly Review of Economics and Finance, 35(1), 73-87.
Vos, A. & Vos, E. (2000). Investment decision criteria in small New Zea-land businesses. Small Enterprise Research, 8(1), 44-55.