Universidade de Lisboa
Faculdade de Ciências
Departamento de Biologia Animal
Modulation of Acute Myeloide Leukaemia (AML)
metabolism by the Vascular Endothelial Growth
Factor (VEGF) - in vitro study.
Carolina Martins Resende Alves Nunes
Dissertação
Mestrado em Biologia Evolutiva e do Desenvolvimento
2014
Universidade de Lisboa
Faculdade de Ciências
Departamento de Biologia Animal
Modulation of Acute Myeloide Leukaemia (AML)
metabolism by the Vascular Endothelial Growth
Factor (VEGF) - in vitro study.
Carolina Martins Resende Alves Nunes
Dissertação
Mestrado em Biologia Evolutiva e do Desenvolvimento
Dissertação orientada por:
Professora Doutora Sólveig Thorsteinsdóttir (DBA/FCUL)
Professora Doutora Jacinta Serpa (FCM-UNL/CEDOC)
i
Agradecimentos
Começo por um agradecimento especial à Doutora Jacinta Serpa, minha orientadora externa, pela oportunidade, apoio e orientação ao longo de todo o trabalho laboratorial e escrita desta dissertação. Mas sobretudo pela paciência, dedicação, exigência, disponibilidade e por todos os conhecimentos que me transmitiu ao longo do trabalho.
À Professora Doutora Solveig Thorsteinsdóttir um muito obrigada por aceitar ser minha orientadora interna e pelo apoio, comentários, criticas e sugestões não só durante este ano, mas durante todo o mestrado.
Agradeço também ao Doutor Luís Gafeira pela simpatia e disponibilidade para me ensinar os princípios e técnicas do NMR.
Às meninas do grupo TMM que tão bem me acolheram e que estavam sempre disponíveis. À Fernanda por estar sempre disponível e animada, à Sofia e à Lídia pelos ensinamentos e companheirismo. E, finalmente, à Filipa que nesta fase final esteve lá para uma palavra de ânimo e para discutir dúvidas de última hora, mas também por ter tornado as idas ao ginásio, cafés e pausas bem mais agradáveis!
A todos os colegas do CIPM que, directa ou indirectamente, tornaram a conclusão deste trabalho possível.
Aos meus amigos não só agradeço como dou os parabéns por me aturarem, principalmente durante este ano e por demonstrarem que a distância é sempre relativa. À Andreia por tornar a definição de amizade pequena demais, à Ana por nunca se calar, ao Denys por ser o meu ucraniano mais português do mundo que não para de me copiar, à Vera por estar sempre lá, aos meus rapazes (Afonso, David e Mauro) por serem isso mesmo (homens…), ao Fábio e ao João que sempre puxaram pelo meu lado de pastorinha, à Sónia que manteve a minha sanidade e à Teresa pela alegria matinal.
Mas como os últimos são os primeiros, não posso de deixar de agradecer aos meus pais. Eles sabem que eu os amo e sabem sempre o que dizer no momento certo, fazem parte daquilo que sou e do que vou ser. São o pilar, o sorriso salvador do fim do dia, o abraço calmante a palavra precisa. Eles tornaram tudo possível e não há palavras que consigam exprimir o quão grata estou por os poder chamar de meus.
ii
Abstract
Several studies have highlighted cancer metabolism as a suitable target to develop new therapies. This thesis aimed at determining the role of lactate metabolism in AML, both VEGF dependent and independent, by developing an in vitro study (pro-myelocytic-HL60 and erithroblastic-HEL).
We observed that HL60 and HEL have different metabolic profiles when exposed to lactate and/or VEGF. NMR analysis showed that HL60 uses lactate to synthetize acetate, amino acids and malate and upon VEGF stimulation nucleotides are detected though not originated from lactate or glucose. Concordantly, VEGF exposure increases the expression of MCT1 in HL60 cells. HEL cells’ metabolic profile is not altered by VEGF stimulation and lactate is mainly converted into malate and proline. However, VEGF decreases MCT1 and MCT4 levels in HEL. In both cell lines, LDHA and LDHB expression levels are equivalent between conditions. Concerning VEGF receptors, in HL60 VEGF increases and lactate decreases the levels of KDR, expressing more FLT1. HEL cells barely express KDR and all the stimulations tested increase the expression of FLT1.
Cell cycle analysis showed that VEGF and lactate increase proliferation of respectively HL60 and HEL cells. The percentage of dead cells in the same conditions was higher, assenting the concomitant media consumption.
In order to validate our results, we verified that the majority of BM samples express higher levels of MCT1 than MCT4. By immunohistochemistry, MCT1 is expressed in aberrant and large cells whereas MCT4 is expressed in normal mature and progenitor cells. MCT1 positive cells are preferentially localised in paratrabecular regions, the VEGF rich niches.
Our study showed VEGF regulates lactate metabolism and proliferation in monocytic AML cells. In human samples, higher levels of MCT1 are expressed at diagnosis and relapse, being MCT1 expressed in cells morphologically aberrant. Taking together out results indicate MCT1 as a suitable therapeutic target in AML.
iii
Resumo
Cancro define um vasto grupo de neoplasias malignas que resultam de várias alterações dos mecanismos fisiológicos que regulam os vários processos celulares. O processo de carcinogénese conduz à aquisição de uma série de características onde se incluem o aumento da taxa de proliferação, sobrevivência e resistência à morte celular. A causa final da morte da maioria dos doentes com cancro é o desenvolvimento de metástases [1], que se formam a partir da capacidade que as células cancerígenas têm de se separar do tumor primário, migrar, invadir e colonizar outros órgãos.
O conhecimento da biologia do cancro tem vindo a crescer exponencialmente nas últimas duas décadas. A carcinogénese é um processo de várias etapas que reflecte alterações genéticas que levam à transformação progressiva de células normais em células malignas [2]. Hanahan e Weinberg [3], propõem que, durante o processo de carcinogénese, as células têm de adquirir seis características biológicas principais: sustentar a capacidade proliferativa; evadir-se aos sinais de supressores de crescimento; resistir à morte celular; adquirir uma capacidade replicativa infinita; induzir angiogénese, e desencadear o processo de invasão e metastização. Mais recentemente, os mesmos autores revelaram mais duas novas características: a capacidade de escapar ao controlo do sistema imunitário, e a capacidade de adaptação do metabolismo energético.
A leucemia mielóide aguda (LMA) é uma doença clonal geneticamente heterogénea caracterizada pela acumulação de alterações genéticas somáticas em células progenitoras hematopoiéticas que levam à alteração dos mecanismos normais de auto-renovação, proliferação e diferenciação destas células [4]. Estas alterações levam a uma perda da função hematopoiética normal que pode resultar em insuficiência da função dos glóbulos brancos e vermelhos, bem como as plaquetas e que, quando não tratada, geralmente leva à morte do doente em semanas ou meses após do seu diagnóstico [5, 6].
Hanahan e Weinberg [3] identificaram a reprogramação do metabolismo energético como uma das marcas biológicas emergentes das células cancerígenas. A proliferação de células cancerígenas apresenta exigências metabólicas diferentes em
iv
comparação com a maioria das células diferenciadas normais [7]. De forma a responder às necessidades de uma elevada taxa de proliferação, as células cancerígenas consomem mais nutrientes para suprir as vias de síntese de macromoléculas. As vias metabólicas devem assim ser reprogramadas de forma a equilibrar os processos biossintéticos com a produção de ATP necessária para suportar o crescimento e sobrevivência celular [8].
Em alguns tumores, a taxa de glicólise é normalmente mais elevada do que nos tecidos normais, principalmente para sustentar a replicação do DNA através da via das fosfatos de pentose (PPP), em detrimento da obtenção do máximo de ATP a partir da glucose [9]. A manutenção desta taxa de glicólise requer elevadas quantidades de dinucleótido de nicotinamida e adenina (NAD+), que é eficientemente produzido na conversão de piruvato em lactato, promovendo a auto-suficiência da glicólise que passa a depender apenas da capacidade celular de captação de glucose [10].
Os elevados níveis de lactato resultante da glicólise têm sido correlacionados com o aumento de metástases, reincidência do tumor e mau prognóstico. O metabolismo (anabolismo e catabolismo) do lactato assenta da acção de enzimas desidrogenases de lactato (LDHs) e dos transportadores de monocarboxilados (MCTs).
As LDHs compreendem um grupo de cinco isoenzimas tetraméricas que resultam da combinação de duas subunidades A e B. De acordo com a sua composição estas enzimas podem catalisar a conversão de piruvato em lactato ou o contrário com interconversão de NADH e NAD+ [11, 12]. Em muitos tumores, principalmente nos altamente glicolíticos, encontram-se níveis mais elevados de expressão de LDHA do que em tecidos normais, o que está relacionado com o mau prognóstico da doença [13, 14]. A LDHB esta ligada ao crescimento do tumor em cancro de mama de células basais e está presente em tumores com potencial metastático mais elevado [15, 16].
Os MCTs constituem uma família de 14 transportadores codificados pela família de genes de transportadores de monocarboxilados (SLC16) evolutivamente conservada, e têm como função transportar uma única molécula carboxilada através da membrana. Até hoje apenas quatro dos MCTs (MCT1-4) foram caracterizados como facilitadores de transporte de piruvato e lactato sendo cruciais para a homeostasia do lactato [17, 18]. No contexto do cancro, o MCT1 (importação de lactato) e o MCT4 (exportação de lactato) são os dois principais MCTs encontrados em células tumorais
v
sendo que elevados níveis destes transportadores estão relacionados com um mau prognóstico.
Um tumor apresenta um gradiente de O2 dependente da distância a que se
encontra dos vasos sanguíneos funcionais. As células tumorais mais próximas de um vaso sanguíneo têm mais oxigénio disponível enquanto as mais afastadas têm menos, estando portanto em hipoxia. Estas últimas células vão ter níveis mais elevados do factor indutível pela hipoxia (HIF-1) que vai leva ao aumento do consumo de glucose e, consequentemente, ao aumento da sua conversão em piruvato que é então convertido em lactato por LDHA. Este lactato produzido pelas células em hipoxia é exportado pelo MCT4. Sonveaux et al (2008) [19] descreveu que as células tumorais aeróbicas, mais próximas dos vasos, expressam mais MCT1 e importam o lactato que é usado como fonte de carbono e energia através da acção da LDHB. Estas células consomem então lactato em detrimento da glucose que fica então disponível para ser consumida pelas células tumorais em hipoxia [19, 20].
Para além do seu papel na angiogénese, o factor de crescimento VEGF também tem sido descrito como um factor de sobrevivência para as células cancerígenas, incluindo LMA [21]. A desregulação da produção de VEGF tem um impacto significativo sobre o desenvolvimento de leucemia e constitui um passo importante para a progressão em LMA [22]. Está descrito que, por via parácrina, as células de LMA aumentam a produção de VEGF o que leva a que as células endoteliais presentes na medula óssea a segregar vários factores de crescimento e citoquinas que estimulam o crescimento de células LMA [23, 24].
No presente trabalho pretende-se determinar o papel do metabolismo do lactato, dependente ou não de um estímulo de VEGF, em LMA. Para isso foram usadas duas linhagens de LMA diferentes, uma pro-mieloblástica (HL60) e outra eritroblástica (HEL) e amostras de doentes com LMA.
Os resultados obtidos por ressonância magnética nuclear (NMR) demonstram que em HL60 os carbonos do lactato são incorporados na síntese de acetato, aminoácidos e malato independentemente da presença de VEGF e que quando este está presente a glucose não é detectada nos extractos celulares. Nas HEL a estimulação com VEGF não produz qualquer modificação visível no seu perfil metabólico, sendo que o lactato é convertido maioritariamente em malato e prolina.
vi
Em condições normais, as HL60 importa mais 13C-lactato que as células HEL, quando estimulamos as células com VEGF os níveis de incorporação de lactato pelas células HL60 descem para níveis semelhantes às HEL controlo.
Brito (2011) [25] observou que as células HL60 quando estimuladas com VEGF expressam mais MCT1 enquanto a estimulação com lactato e/ou VEGF nas HEL diminui a expressão de MCT1. A expressão de MCT4 em ambas as linhas só parece ser afectada pela presença de lactato e VEGF. A expressão de LDHA e B em células HL60 e HEL não parece ser afectada pela estimulação com lactato e/ou VEGF. Relativamente à expressão dos receptores de VEGF (FLT1 e KDR) em células HL60 observa-se que a estimulação com lactato e VEGF leva a um aumento de expressão de FLT1 e que em células HEL todas as estimulações levam a um aumento da expressão de FLT1. Em ambas as linhas celulares temos uma aparente deslocalização do VEGF para o núcleo quando estimuladas com lactato e VEGF sendo que nas células HEL esta observação é feita também no controlo e na estimulação com VEGF. A expressão do KDR em células HL60 parece aumentar quando as células são tratadas com VEGF e diminuir quando expostas a lactato com e sem VEGF.
Através da análise do ciclo celular por FACS vemos que as células HL60 apresentam um menor tempo acumulado de duração do ciclo celular quando são estimuladas com VEGF, enquanto nas células HEL o mesmo acontece na presença de lactato. O ensaio de morte celular vem de encontro a estas observações uma vez que temos um aumento das células necróticas quando as células são expostas a VEGF.
Em simultâneo explorámos o papel de FOXM1 na regulação da expressão de MCT1, com base trabalho realizados pelo nosso grupo em outros modelos de cancro. Contudo, neste modelo in vitro de LMA, o FOXM1 não parece ser um activador da expressão de MCT1.
Em amostras de medula óssea de doentes com LMA foi possível verificar que a maioria dos doentes expressam níveis mais elevados de MCT1 do que MCT4 ao nível do RNA. Doentes com recidiva da doença, apresentam um aumento da expressão relativa de MCT1. A análise por imuno-histoquímica revela que MCT1 e MCT4 são expressos em células diferentes, o MCT1 é expresso em células grandes e com morfologia aberrante (blastos leucémicos) e o MCT4 é expresso em células maduras de várias linhagens e células progenitoras normais. As células MCT1 positivas têm
vii
tendência para uma disposição para-trabecular (junto às trabéculas ósseas) enquanto as MCT4 positivas encontram-se difusamente distribuídas. O que está de acordo com a descrição dos nichos de blastos leucémicos na medula óssea que se encontram nas zonas ricas em VEGF próximas do osso [26].
Em conjunto, estes resultados demonstram que VEGF influencia a proliferação e o metabolismo de células de LMA de linhagem monocítica influenciando a expressão de intervenientes no metabolismo do lactato. O MCT1 é um elemento crucial no metabolismo de lactato e está expresso em células leucémicas de doentes com LMA. Assim, o MCT1 poderá constituir um novo alvo terapêutico em doentes com LMA.
viii
Table of contentes
Agradecimentos ...i
Abstract ...i
Resumo ... iii
Table of contentes ... viii
Index of Figures ... x
Index of tables ... xi
List of nomenclatures, abbreviations and acronyms ... xii
Introduction ... 1
1. Cancer ... 1
2. Cancer biology and Cancer microenvironment ... 1
3. Acute myeloid leukaemia ... 3
4. Cancer Metabolism ... 6
4.1.Aerobic glycolysis ... 7
4.2.Lactate dehydrogenases (LDHs) ... 8
4.3.Monocarboxylate transporters ... 9
4.4.Metabolic Symbiosis ... 10
5. VEGF and AML ... 11
Aim ... 13
Materials and Methods ... 14
1. Cell culture ... 14
2. Western Blotting ... 14
3. Immunofluorescence ... 15
4. Cell cycle ... 16
5. Cell Cycle duration... 17
6. Nuclear magnetic resonance (NMR) ... 17
7. Apoptosis analysis by Flow Cytometry ... 18
8. Chromatin Immunoprecipitation (ChIP) ... 19
9. Immunohistochemistry ... 20
10.Quantitative Real-Time PCR of BM samples from AML patients ... 21
ix
Results... 23
1.NMR- Metabolic profile of HL60, but not HEL, is modulated by lactate and VEGF ... 23
2. Immunofluorescence - Expression of MCTs, but not LDHs, is modulated by lactate and VEGF, in both HL60 and HEL. ... 26
3. Immunofluorescence - VEGF receptors 1 (FLT1) is the predominant VEGF receptor expressed in HL60 and HEL, and its expression and localisation are modulated by lactate and VEGF. ... 28
4. Cell cycle and proliferation rate in HL60 and HEL cells exposed to lactate and VEGF ... 30
4.1 Cell cycle analysis by FACS – VEGF induces a shorter duration of cell cycle in HL60 cell line, but not in HEL. ... 30
4.2 Cell death analysis by FACS- high proliferative rate of HL60 stimulated with VEGF culminates in higher apoptosis levels ... 30
5. ChIP analysis - FOXM1 binding to MCT1 promoter region, is not induced neither by lactate nor VEGF, in HL60 and HEL cells. ... 33
6. MCT1 and MCT4 expression in bone marrow (BM) samples from AML patients . 34 6.1 RQ-PCR- BM samples from AML patients express higher levels of MCT1 than MCT4 at diagnosis and disease relapse is accompanied by an increase in MCT1 expression ... 34
6.2 Immunohistochemistry - MCT1 and MCT4 are expressed in different settings of cells in BM samples from AML patients ... 36
Discussion ... 38
Conclusions ... 42
Future perspectives ... 43
Bibliography ... 44
x
Index of Figures
Figure 1 - WHO’s leukaemia classification, in particular myeloid acute leukaemia. ... 5
Figure 2 - Lactate-based metabolic symbiosis in tumours ... 11
Figure 3 - HL60 metabolic profile by NMR spectroscopy.. ... 23
Figure 4 - HL60 metabolic profile by NMR spectroscopy.. ... 24
Figure 5 - Hel metabolic profile by NMR spectroscopy.. ... 25
Figure 6 - Comparison between the lactate present in the HL60 and HEL cells.. ... 26
Figure 7 - Detection of MCT1 and MCT4 by immunofluorescence.. ... 27
Figure 8 - LDHA and LDHB expression in HL60 and HEL cells, assessed by western-blotting.. ... 28
Figure 9 - Detection of FLT1 and KDR in HL60 and HEL cells by immunofluorescence.. ... 29
Figure 10 - Cell cycle analysis by FACS in HL60 and HEL.. ... 31
Figure 11 - FACS analysis showing the accumulated time spent in the different cell cycle phases by HL60 and HEL. . ... 32
Figure 12 - Cell death (apoptosis- annexin V and necrosis- PI) analyses by FACS, in HL60 and HEL cells.. ... 33
Figure 13 - Relative occupancy of FOXM1 binding site in MCT1 promoter region in HL60 and HEL cells.. ... 34
Figure 14 - Relative quantification of MCT1 and MCT4 expression in BM samples of AML patients, by real time PCR. ... 35
Figure 15 - MCT1 and MCT4 immunohistochemistry in BM samples from an AML patient. ... 36
Figure 16 - Localization of MCT1 and MCT4 positive cells in BM samples from an AML patients ... 37
Figure 17 - Model of paratrabecular microenvironment as an ideal leukaemia niche for the establishment of a pool of blasts to sustain disease progression .. ... 41
xi
Index of tables
Table 1 - IP’d DNA quantitative Real-Time PCR program ... 20
Table 2 - Primers used in IP’d DNA quantitative Real-Time PCR ... 20
Table 3 - Program used for RT-PCR. ... 21
Table 4 - Primers used in qRT-PCR. ... 22
xii
List of nomenclatures, abbreviations and acronyms
AA – Antibiotic–antimycotic
ABL – Abelson murine leukaemia viral oncogene homolog 1 AML – Acute myeloid leukaemia
ATP – Adenosine triphosphate
BCR – Breakpoint cluster region at chromosome 22 BM – Bone marrow
BSA – Bovine serum albumin CBF – Core-binding factor CBP – CREB-binding protein CDKs – Cyclin-dependent kinases cDNA – Complementary DNA
CEBPA – CCAAT/enhancer binding protein ChIP – Chromatin immunoprecipitation CKIs – CDKs inhibitors
DAPI – 4’-6-diamidino-2-phenylindole DNA – Deoxyribonucleic acid
dNTPs – Deoxynucleotides DTT – Dithiothreitol ECM – Extracellular matrix
ETO – Runt-related transcription factor 1 translocated to 1 (cyclin D-related) FACS – Fluorescence-activated cell sorting
FBS – Fetal bovine serum
FDG-PET – [18]fluorodeoxyglucose positron emission tomography FGFs – Fibroblast growth factors
FLT1 – VEGF receptors 1
FLT3 – FMS-like tyrosine kinase 3 FOXM1– Forkhead box protein h – Hours
HIF-1 – Hypoxia-inducible factor 1 HIF1-α – Hypoxia inducible factor 1 α HRP – Horseradish peroxidase
KDR – VEGF receptor 2
LDHA – Lactate dehydrogenase A chain LDHB – Lactate dehydrogenase B chain MCT1 – Monocarboxylate transporter 1 MCT2 – Monocarboxylate transporter 2 MCT3 – Monocarboxylate transporter 3 MCT4 – Monocarboxylate transporter 4 min – Minutes
MLL – Lysine (K)-specific methyltransferase 2A mRNA – Messenger RNA
mTOR – Mechanistic target of rapamycin
MYC – Avian myelocytomatosis viral oncogene homolog NAD – Nicotinamide adenine
xiii
OXPHOS – Mitochondrial oxidative phosphorylation p300 – Binding protein p300
PBS – Phosphate buffered saline PCR – Polymerase chain reaction
PDGFR – Platelet-derived growth factor receptor fusion
PDH – Pyruvate dehydrogenase PDK – Pyruvate dehydrogenase kinase PI – Propidium iodite
PI3K – Phosphatidylinositol-4,5-bisphosphate 3-kinase PML- Promyelocytic leukaemia gene
PPP – Phosphate pentose pathway PS – Phosphatidyl serine
PTPN11 – Tyrosine-protein phosphatase non-receptor type 11 qRT-PCR – Quantitative Real Time PCR
RAR– Retinoic acid receptor
Ras – GTPase
RIPA – Radio-Immunoprecipitation assay RNA – Ribonucleic acid
RT – Room temperature
RT-PCR – Reverse transcription polymerase chain reaction
SDS-PAGE – Sodium dodecyl sulphate-polyacrylamide gel electrophoresis TBE – Tris-borate-EDTA
TBS – Tris Buffered Saline TCA – Tricarboxylic acid
TEL – ETS family transcription factor
TIF1 – Transcriptional intermediary factor 1 TMs – Transmembrane helices
VEGF – Tascular endothelial growth factor WHO – World Health
1
Introduction
1. Cancer
Cancer comprises a group of malignant neoplasias, arising from multiple alterations in the physiological mechanism of normal cells. These alterations lead cells to a state characterized, in part, by a higher proliferation rate, survival and resistance to apoptosis. The cause of death of most cancer patients is the development of metastases [1] which emerge from the ability of cancer cells to detach from the primary tumour, disseminate, invade and colonize other organs.
In economically developed countries, cancer is the leading cause of death [27]. Adoption of cancer-associated lifestyle choices such as smoking, physical inactivity, synthetic and high fat diets and population aging is increasing the burden of cancer in developing countries, cancer being the second leading cause of death. In Europe, in 2012 there were 3.45 million new cases of cancer (excluding non-melanoma skin cancers), 53% occurring in men and 47% in women, accounting for approximately 707,000 men and 555,000 women dying from cancer [28].
2. Cancer biology and Cancer microenvironment
Carcinogenesis is a stepwise process, whose stages are underlied by genetic alterations, driving the transformation from normal into malignant cells [2, 29]. The huge variety cancer types is defined by several features, also named “hallmarks”, that collectively define cancer: self-sufficiency in growth signals, insensitivity to antigrowth signals, evasion of cell death, increased replicative potential, sustained angiogenesis, and tissue invasion and metastasis [2, 3].
Evading immune system and reprogrammed metabolism were also considered emerging hallmarks of cancer [3]. In fact, regarding the evasion from immune system, solid tumours seem to avoid the recognition and elimination the majority of cancer cells by the immune system [3]. Other evidence revealed that cancer cells are able to reprogram their carbon and energy metabolism, being the most explored the increase rate of glycolysis even in aerobiosis [3, 30]. Although this metabolic switch represents
2
a disadvantage in energetic terms, increased glycolysis allows the diversion of glycolytic intermediates into various biosynthetic pathways, including those generating nucleosides and amino acids, facilitating the synthesis of biomass to sustain cell proliferation [3, 7].
All these characteristics of cancer result from a dynamic interaction between tumour cells and their microenvironment. The development of a tumour occurs in a complex network, characterized by the presence of extracellular matrix (ECM), epithelial and mesenchymal cells, vascular and lymphatic vessels, inflammatory and immune cells. Cancer cells interact with surrounding environment taking advantage of inorganic and organic compounds and signalling effectors. In carcinogenesis the behaviour of a cell is mostly determined by its interaction with the microenvironment [31]. Thus in the clinical setting, targeting tumour microenvironment in order to affect cancer cells has become mandatory [32].
In fact, for a long time only neoplastic cells were the focus of interest in cancer research, being stroma considered just a reactive component [33]. Research on the underlying mechanisms of cancer has finally pointed out the relevance of tumoral stroma [33–36]. This is now considered an integral part of a neoplasm, perceiving as a complex tissue composed of several distinct cell types that participate in heterotypic interactions, creating the concept of tumour microenvironment (reviewed in [3]).
Besides the paracrine mode of action of growth factors that dominates physiological processes, many tumour cells pathophysiologically acquire the ability to produce growth factors to auto-regulated their proliferation – autocrine stimulation [37, 38]. Alongside such autocrine loops, other mechanisms may also lead to constitutive pathways activation in tumours, whereas specific mutations can elicit ligand-independent signalling, enabling cancer cells to become hyper-responsive to growth factors [2, 39, 40]. The switch in ECM components in cancer stroma also favours the transmition of pro-growth signals, contributing to tumour self-sufficiency in terms of growth signals [41].
Loss of sensitivity to anti-growth signals constitutes the first hallmark of cancer by also leading to unsupervised growth [2]. Cell cycle involves multiple checkpoints that assess extracellular growth signals, cell size and DNA integrity, in which cyclin-dependent kinases (CDKs) and cyclins act by inducing cell cycle progression, and CDKs
3
inhibitors (CKIs) act as negative regulators [42]. Deregulation of the cell cycle is one of the most frequent alterations during tumour development [43].
Cancer cells must also evade anti-proliferative signals by turning off elements, as integrins and other adhesion molecules that send antigrowth signals, favouring instead pro-growth signals and by avoiding cell differentiation [2].
The ability of tumour cell populations to expand in number is also determined by the resistance to cell death. The most common strategy to avoid apoptosis is a mutation involving the p53 tumour suppressor, resulting in the removal of a key component of the DNA damage sensor that can induce the apoptotic effector cascade [2, 44, 45].
The loss of capacity for senescence leads tumour cells almost to immortality, an essential feature for malignant growth state, achieved in most cases, from the increased expression of telomerase, an enzyme that maintains the telomeres at a length above a critical threshold, permitting cell division [2, 46, 47].
Tumour cells initially lack angiogenic ability [2, 48]. In order to expand in size, neoplasms must develop angiogenic ability, which is acquired during tumour development via an “angiogenic switch” [49]. That activation appears to occur by changing the balance of angiogenesis inducers and inhibitors [49]. This common shift usually involves altered gene transcription. Many tumours show increased expression of vascular endothelial growth factor (VEGF) and/or fibroblast growth factors (FGFs), compared to normal tissues. The downregulation of endogenous inhibitors, such as thrombospondin-1 or β-interferon is also frequent [3, 50].
After the ability of tumour to grow beyond the limitations of passive nutrient diffusion, conferred by ability to form blood vessels, primary tumours may release cells that are able to invade adjacent tissues and travel through bloodstream to distant organs, where they may form secondary tumours, so called metastases [51].
3. Acute myeloid leukaemia
Myeloid leukaemia, the most common group of haematological malignancies, is thought to derive from pluripotential or multipotential stem cells that give rise to a diverse range of neoplasias, some of them being characterised by specific genetic
4
abnormalities. Leukaemias are divided into two main categories based on the affected cell lineage, myeloid or lymphoid, and then sub-divided according to the cells’ maturation state, morphology, immunopositivity, genetic characteristics and clinical behaviour [52]. The most common subtypes of leukaemia are acute lymphocytic leukaemia, acute myeloid leukaemia, chronic lymphocytic leukaemia and chronic myeloid leukaemia where acute stands for a fast progression and chronic for a slow progression of the disease.
In Europe, according to Fey and Dreyling (2009) [53], the incidence of acute myeloid leukaemia (AML) in adults is 5–8 cases/100000/year and the mortality is about 4–6 cases/100000/year. AML is a genetically heterogeneous clonal disorder characterized by the accumulation of somatically acquired genetic alterations in hematopoietic progenitor cells that alter their normal mechanisms of self-renewal, proliferation and differentiation [4]. This malignant alteration leads to a loss of normal hematopoietic function that results in life threatening insufficiency of normal white and red blood cells as well as platelets, which, if left untreated, typically leads to death within weeks to months of its clinical presentation [5, 6]. According to World Health Organization (WHO), the term “myeloid” includes all cells belonging to the granulocytic (neutrophil, eosinophil, basophil), monocytic/macrophage, erythroid, megakaryocytic and mast cell lineages. AML can be divided in acute monoblastic/monocytic leukaemia, acute erythroid leukaemia, acute megakaryoblastic leukaemia, acute basophilic leukaemia and acute panmyelosis with myelofibrosis (Figure 1) [54].
5
Figure 1 - WHO’s leukaemia classification, in particular myeloid acute leukaemia. Based on Vardiman et al, 2009 [54]
Remission rates and overall survival depend on a number of features, including age of the patient, cytogenetic alterations and other molecular changes exhibited by malignant leukemic clones, previous bone marrow (BM) disorders and comorbid illnesses [5].
During leukaemogenesis the key oncogenic events that will lead to AML are often divided into class I and class II mutations. Mutations that confer a proliferation or survival advantage to blast cells but do not affect their differentiation, including mutations of FMS-like tyrosine kinase 3 (FLT3), GTPase (Ras) and Tyrosine-protein phosphatase non-receptor type 11 (PTPN11), and the breakpoint cluster region at chromosome 22/Abelson murine leukaemia viral oncogene homolog 1 (BCR/ABL) and ETS family transcription factor/platelet-derived growth factor receptor (TEL/PDGFR) gene fusions are defined as Class I. Class II mutations correspond to gene mutations and translocation-associated fusions that impair differentiation and apoptosis and include the runt-related transcription factor 1/runt-related transcription factor 1 translocated to 1 (cyclin D-related) (AML/ETO) and the promyelocytic leukaemia gene/ retinoic acid receptor (PML/RAR) fusions, the lysine (K)-specific methyltransferase 2A (MLL) rearrangements, and mutations in the CCAAT/enhancer binding protein (CEBPA), the core-binding factor (CBF), the HOX family members, the CREB-binding protein/binding protein p300 (CBP/p300), and co-activators of the transcriptional intermediary factor 1 (TIF1) [55, 56]. Together these class I and class II mutations have a prognostic relevance that has led to the widespread adoption of risk stratification,
6
with patients divided into cytogenetically defined risk groups with significant differences in overall survival [57].
4. Cancer Metabolism
Tumour cell metabolism was actively explored in the pre-genomics era, the discovery of tumour suppressor genes and oncogenes dampened interest in metabolism as a potential way to identified cancer cell potential particularities and related therapeutic targets [11]. In 2011 Hanahan and Weinberg [3] identified reprogramming energy metabolism as an emerging hallmark of cancer showing that scientists are rediscovering cancer metabolism as a way to target cancer.
Proliferating cancer cells exhibit considerably different metabolic requirements to most normal differentiated cells [7]. In order to support their high rates of proliferation, cancer cells consume additional nutrients and divert those nutrients into macromolecular synthesis pathways. Metabolic pathways must therefore be rewired in such a way that balances biosynthetic processes with sufficient ATP production to support cell growth and survival [8].
Over the past decade, a more complex picture of cancer cell metabolism has emerged. Many cancers show increased glucose uptake and enhanced glycolytic rates, suggesting that metabolic alteration provides a growth advantage for tumour cells by also supporting the production of intermediates for the synthesis of lipids, proteins and nucleic acids [58, 59]. Although is not clear whether these metabolic alterations are specific to cancer or just reflect the increased proliferation of tumour cells, different oncogenic signalling pathways target distinct components of the metabolic network. In order to support uncontrolled proliferation, evasion of growth-inhibitory signals, cell migration and the dissemination of metastatic cells into distant tissues, cancer cells need to modify their metabolism [59].
Otto Warburg, pioneer in the study of respiration, found that even under normal oxygen concentrations, cancer cells metabolize glucose preferentially by glycolysis, although it is a less efficient pathway for producing ATP than oxidative phosphorylation [11, 60, 61]. It has been demonstrated that the key components of the Warburg effect, increased glucose consumption, decreased oxidative
7
phosphorylation, and accompanying lactate production, are also distinguishing features of oncogene activation [62]. The increased glucose uptake, that often accompanied the metabolism of glucose by aerobic glycolysis, has proved useful for tumour detection and monitoring by [18]fluorodeoxyglucose positron emission tomography (FDG–PET) imaging [8, 60].
The metabolic phenotype of tumour cells is controlled by intrinsic genetic mutations and internal responses to the tumour microenvironment. Oncogenic signalling pathways controlling growth and survival are often activated by the loss of tumour suppressors (such as p53), activation of oncoproteins (such as PI3K or mTOR) or transcription factors (for example HIF-1 or MYC) [60, 63].
4.1. Aerobic glycolysis
It was thought that proliferating tumour cells tend to rely on aerobic glycolysis to generate ATP and divert carbon from glucose into precursors for the synthesis of nucleotides, proteins, and lipids needed to duplicate cell biomass and genome at each cell division. This switch to aerobic glycolysis is induced by oncogenic lesions that induce the expression and activation of several glycolytic enzymes [18]. However, if glucose is completely converted to lactate the preferential metabolic pathway supplied by intermediates of glycolysis will be Phosphate Pentose Pathway (PPP), having as main goal the synthesis of nucleotides. Considering that glucose is preferentially catabolized to lactate, rather than fully metabolized to carbon dioxide (CO2) via
mitochondrial oxidative phosphorylation (OXPHOS), not exploiting the full capacity of oxidative metabolism of glucose to produce avidly needed ATP [10, 18]. Malignant cells must have another carbon source to supply the tricarboxylic acid cycle (TCA cycle), whose intermediates will supply lipids and aminoacid metabolic pathways, as well as CO2 for OXPHOS. The rate of glycolysis in tumours is usually higher than in normal
tissues, mainly to support DNA replication through PPP, rather than to maintain normal ATP levels as it is presented by some studies [9]. Maintenance of a high glycolytic flux requires nicotinamide adenine (NAD+) which may be efficiently generated from the conversion of pyruvate into lactate. This metabolic conversion makes glycolysis self-sufficient as long as elevated glucose uptake is possible [10].
8
Since tumours have a high rate of glycolysis, lactate, the end product, is produced in large quantities in tumours and has been correlated with increased metastasis, tumour recurrence, and poor outcome. Some cancer cells generally export lactate, which acidifies the tumour environment, leading to a local inflammatory response that attracts immune cells such as macrophages, which secrete cytokines and growth factors that drive tumour cell growth and metastasis [64, 65]. In the tumour cell milieu, lactate impairs the adaptive immune response, disabling immune surveillance [18].
Hypoxia has been considered the main stimulus for this metabolic switch into glycolysis [19, 20]. Besides lactate being considered a waste product, it was described as an important in an metabolic symbiosis in tumours. In this scenario, oxygenated oxidative tumour cells can use lactate instead of (or in addition to) glucose, thereby sparing the available glucose which can then diffuse deeper into the tumour to fuel hypoxic cells located farther away from tumour blood vessels. Central and less oxygenated glycolytic cells produce lactate as the end product of glycolysis that will be consumed by the peripheral oxygenated glycolytic cells [19, 66].
Lactate metabolism is dependent on the action of lactate dehydrogenase enzymes (LDHs) as well as on the monocarboxylates membrane transporters (MCTs).
4.2. Lactate dehydrogenases (LDHs)
Lactate dehydrogenases (LDHs) comprise a group of five tetrameric isozymes from the combination of two subunits A and B. Depending on their composition these enzymes can catalyse the forward and backward conversion of pyruvate to lactate with concomitant interconversion of NADH and NAD+ [11, 12]. LDHA is the gene that codifies the predominant subunit and is specific of highly glycolytic tissues including skeletal muscle. It has a higher affinity for pyruvate favouring the conversion of pyruvate into lactate. The LDHB gene codifies a subunit that is ubiquitously expressed and is the predominant isoform in heart muscle, converts lactate into pyruvate which allows cells to use lactate as a nutrient source for oxidative metabolism (heart tissue and neurons), and/or for gluconeogenesis (in the liver and kidney) [18].
9
Many tumours, mainly the highly glycolytic ones, have higher LDHA levels than normal tissues, which correlate with a poor prognosis [13, 14]. LDHA and pyruvate dehydrogenase kinase (PDK) are upregulated in solid tumours in response to hypoxia by the expression of hypoxia inducible factor 1 α (HIF1-α). PDK inactivates pyruvate dehydrogenase (PDH) and prevents the import of pyruvate into the mitochondrial matrix, whereas LDHA reduces the pyruvate into lactate and thereby regenerates the NAD+ stock necessary to maintain the glycolytic flux self-sufficient [11]. LDHA was identified as a direct target gene of the c-Myc oncogenic transcription factor which, when inhibited, induces oxidative stress and inhibits tumour progression [12].
It has been reported that, unlike LDHA, LDHB is silenced by promoter methylation in several tumours [67, 68], suggesting that tumours preferentially express LDH isoenzymes with a high LDHA gene product content. LDHB was linked to tumour growth in basal-like breast cancers being present in tumours with higher metastatic potential [15, 16]. As expected on the basis of its enzymatic function, high LDHB was associated with oxidative, basal-like phenotype [16]. LDHB-high tumours coexpressed MCT1 suggesting that these tumours use pyruvate or lactate as an energy source providing an alternative means of energy generation and the ability to adapt to the tumour microenvironment [15].
4.3. Monocarboxylate transporters
MCTs constitute a family of 14 transporters, encoded by the evolutionary conserved monocarboxylate transporter (SLC16) gene family, that transport single-carboxylate molecules across biological membranes. MCTs are predicted to have 12 transmembrane helices (TMs) with intracellular C- and N-termini and a large cytosolic loop between TMs 6 and 7. The TM regions are well conserved, the C and N-terminus regions and intermediary loop sequences being responsible for the variability between the 14 members. Only four members of the family (MCTs1–4) have actually been demonstrated to facilitate proton-linked monocarboxylate transport of pyruvate, lactate and ketone bodies [69]. These four transporters have a crucial role on the lactate homeostasis in both normal cells and cancer cells allowing the influx and the efflux of lactate [18].
10
The major differences between the isoforms are their relative substrate and inhibitor affinities, the regulation of their expression, their tissue distribution and intracellular localization. MCT1 is expressed in almost all tissues, sometimes in conjunction with other MCT isoforms, and plays an active role in the uptake of lactate in the heart, skeletal muscle, red blood cells and liver [17]. MCT2 expression is confined to tissues that take up lactic acid in significant quantities for use as a respiratory fuel (neurons) or for gluconeogenesis (liver parenchymal cells and proximal kidney convoluted tubules) [69]. MCT3 is only expressed in retinal pigment epithelium and choroid plexus epithelia, mediating the efflux of metabolic lactate in the retina [66]. MCT4 is widely expressed and especially so in glycolytic tissues such as fast skeletal muscle fibbers, astrocytes, white blood cells, chondrocytes, and some mammalian cell lines [69].
Most solid tumours are known to rely on glycolysis, producing large amounts of lactate that has to be exported into the extracellular milieu, contributing to the acidic microenvironment and preventing the acidification of the intracellular milieu [18, 66]. MCTs play a dual role in the maintenance of the hyper-glycolytic phenotype of some cancers, allowing the maintenance of the high glycolytic rates by performing lactate efflux, and pH regulation by the co-transport of protons [66]. MCTs also allow the import of lactate into cells that have the ability to use it as a carbon and energy source. In the cancer context, MCT1 and MCT4 are the two major MCTs expressed in tumour cells where high levels of these transporters predict poor outcome. Elevated levels of MCT1 have been detected in breast, colorectal, gastric, and cervical cancer as well as in neuroblastoma and glioma [18]. MCT4 expression is highly elevated in renal cell carcinoma as well as in cervical and prostate cancer [20]. The expression of MCT4 is upregulated by Hypoxia-inducible factor 1 α (HIF-1α), which is the main glycolytic transcription factor induced by oxidative stress and hypoxia [20].
4.4. Metabolic Symbiosis
The gradient levels of O2 in tumours are dependent of the distance from a
functional blood vessel. Tumour cells closer to blood vessel would be more oxygenated and the most distant cells would be less rich in oxygen. These last ones will have high
11
levels of HIF-1 expression that would increase the uptake of glucose and its conversion to pyruvate which is then converted to lactate by LDHA. This lactate produced by the hypoxic cells will be secreted from the cell via MCT4. As Sonveaux et al (2008) [19] described, aerobic tumour cells, closer to an oxygen source, express MCT1 in order to import lactate and use it as an energy source with the help of LDHB in the presence of O2. Lactate is a preferred substrate relative to glucose and glucose can then diffuse to
fuel glycolysis of distant hypoxic tumour cells as described in figure 2 [19, 20].
Figure 2 - Lactate-based metabolic symbiosis in tumours (based on Sonveaux et al, 2008 [19]) – high
levels of HIF-1 in tumour cells in hypoxic increases the uptake of glucose via glucose transporters (GLUT) and its conversion to pyruvate that is converted to lactate by LDHA that would be exported by MCT4. Aerobic tumour cells, closer to O2 source, import lactate via MCT1 and convert it back to pyruvate via
LDHB. Aerobic tumour cells preference for lactate as an energy souse facilitates the delivery of glucose to the hypoxic regions of the tumour.
5. VEGF and AML
VEGF is the main effector in angiogenesis, the process of new blood vessel formation, which is a crucial step in tumourigenesis. Besides its role in angiogenesis, VEGF has also been described as a survival factor for cancer cells, including AML [21].
Dysregulation of VEGF production was suggested to have a major impact on leukemic growth and constitutes an important step in the progression of AML [22]. Via paracrine pathways, AML cells increase the production of VEGF, which activates endothelial cells in the BM to secrete several growth factors or cytokines (such as
12
macrophage colony-stimulating factor, granulocyte colony-stimulating factor and interleukin-6) which stimulate AML cell growth [23, 24]. AML cells increase the production of VEGF via autocrine pathways, which binds to the VEGF receptor-2 on leukemic cells, increasing AML cell survival [21, 70].
Filipa Brito (2012) [25], reported that the presence of lactate and VEGF modulate the expression of MCT1, MCT4, LDHA and LDHB in HL60 cells, a human myeloblastic leukaemia cell line. These results suggest the existence of a functional loop of lactate influx/efflux mediated by MCT1 and MCT4 which is also maintained due to the catalytic action of LDHA and LDHB. The use of lactate as a carbon and the regulation of nucleotide synthesis by VEGF, was also demonstrated [25].
13
Aim
Cancer cells exhibit a metabolic profile which maximizes their fitness within their microenvironment and gives them an advantage in term of proliferation and survival. Here we will seek to determine the role of lactate metabolism in AML, both dependent on, and independent of, VEGF stimuli.
In this thesis, we will use in vitro models of two different AML lineages, monoblastic and erythroblastic, as well as BM samples from AML patients.
The specific aims will be to evaluate:
- the metabolic profile of AML cells exposed to lactate and/or VEGF;
- the effect of lactate and VEGF in the expression of MCT1, MCT4, LDHA and LDHB;
- the influence of lactate and VEGF on several cell features, namely cell cycle duration, proliferation rate and cell death, and
- the expression profile of MCT1 and MCT4 in BM samples from AML patients. With this study we aim to increase our knowledge about how VEGF modulate the metabolism of different AML types.
14
Materials and Methods
1. Cell culture
Cell lines were obtained from American Type Culture Collection (ATCC): HL60 (ATCC®:CCL-240TM); a human promyelocytic (monoblastic) cell line, and HEL (ATCC®:TIB-180TM), a human erythroblastic leukaemia cell line.
Cells were maintained at 37°C in a humidified 5% CO2 environment in RPMI
1640 medium (31870, Gibco - Life Technologis Inc) supplemented with 10% fetal bovine serum (FBS) (S 0615, Biochrom), 1% Antibiotic-Antimycotic (AA) (15240062, Anti-Anti, Invitrogen - Life Technologies Inc) and 1% Glutamine (25030-081, Invitrogen - Life Technologies Inc). Cell number was determined with the help of a Bürker counting chamber.
Lactate (1065222500, Merck) was used at a concentration of 10mM and vascular endothelial growth factor (VEGF) (V7259, Sigma-Aldrich®) was used at a concentration of 25ng/mL plus 5U/mL heparin (H3149, Sigma-Aldrich®).
2. Western Blotting
Cell extracts were performed using Radio-Immunoprecipitation Assay (RIPA) buffer (Appendix I), mixed by vortex and stored at -20°C. Cell extracts were centrifuged at 14000 rpm for 4 min at 4°C, and proteins were denatured by adding loading buffer (Appendix I) with 10% β-mercaptoethanol (M3148, Sigma-Aldrich®) to each sample and boiling at 95-100°C for 15 min. After that, samples were centrifuged at 14000 rpm for 2 min at 4°C and then chilled on ice.
Proteins were separated in a 15% sodium dodecyl sulphate-polyacrylamide gel electrophoresis (SDS-PAGE) in a MINI-PROTEAN Tetra Electrophoresis System (Bio-Rad) at 130V for approximately 1h30, into Tris-Glycine-SDS buffer (TGS 10x, 161-0772, Bio-Rad). After electrophoresis, proteins were transferred onto a Immun-Blot® PVDF membrane, previously activated with methanol, with a Mini Trans-Blot® Electrophoretic Transfer Cell (Bio-Rad), at 60V and at 4°C, ON. Membranes were blocked, to avoid non-specific binding, using 5% (w/v) skimmed milk in phosphate
15
buffered saline (PBS) 0.1% (v/v) Tween 20 for 2h at room temperature (RT), with shaking. For protein detection, membranes were incubated with the primary antibodies anti-LDHA (SAB1100050, Sigma-Aldrich®), anti-LDHB (WH00003945M1, Sigma-Aldrich®), at 1:250, respectively in 5% (w/v) skimmed milk in PBS 0.1% (v/v) Tween 20, at 4°C, ON, with shaking.
The membrane was rinsed 3 x 5 min, with PBS 0.1% (v/v) Tween 20, to remove unbound primary antibody. Membranes were then incubated for 2h at RT with a secondary antibody, the anti-rabbit IgG-conjugated horseradish peroxidase (HRP) (31460, Thermo Scientific) at 1:5000 in 5% (w/v) skimmed milk in PBS 0.1% (v/v) Tween 20. After rinsing the membrane 3 x 5 min with PBS 0.1% (v/v) Tween 20, immunoreactive bands were detected by using SuperSignal® West Pico Chemiluminescent Substrate (34080, Thermo Scientific) in a ChemiDoc XRS System (Bio-Rad) with Image Lab software.
β-actin was used has endogenous control to normalize the protein levels between samples. For that, membranes were rinsed 3 x 5 min, with PBS 0.1% (v/v) Tween 20 and incubated with anti β-actin (A5441, Sigma-Aldrich®) at 1:1000 in 5% (w/v) skimmed milk in PBS 0.1% (v/v) Tween 20 (Appendix I), at 4°C, ON, and then revealed as describe above. Bands were analyzed and quantified using Image J software (rsb.info.nih.gov/ij/).
3. Immunofluorescence
HL60 and HEL cells (1 x 10⁶ cell/mL), control and exposed to lactate (10 mM) and/or VEGF (25 ng/mL) plus 5U/mL heparin for 24h were collected and centrifuged at 1200 rpm for 2 min and resuspended in 500 µl of PBS. Cell suspensions (100 µl) were transferred onto a glass slide and centrifuged in a Cytospin at 1200rpm for 5 min.
Cells were fixed with methanol, for 30 min. Each group of cells was delimitated with a circle made with a hydrophobic pen (S2002, Dako) and then PBS 0.1% (w/v) BSA was added for 30 min at RT, to block unspecific binding. Each circle (except the negative controls, for secondary antibody specificity) was incubated with 50 μL of primary antibodies anti-FLT1 (sc-9129, Santa Cruz Biotechnology Inc), anti-KDR (sc-505, Santa Cruz Biotechnology Inc), anti-MCT1 (AB3538P, Millipore) and anti-MCT4
(SC-16
50329, Santa Cruz) diluted 1:100 in PBS 0.1% (w/v) BSA, overnight at 4°C, in a humid chamber. In the negative controls 50μL PBS 0.1% (w/v) BSA was added.
Slides were rinsed 3 times for 5 min, with PBS and then all circles with cells were incubated with secondary antibody anti-rabbit conjugated with Alexa Fluor© 488 (A-11034, Invitrogen - Life Technologies Inc) diluted 1:1000 in PBS 0.1% (w/v) BSA for 2 hours at RT, protected from light.
After incubation, slides were rinsed 3 times for 5 min with PBS and then mounted with Vectashield mounting medium with DAPI (4’-6-diamidino-2-phenylindole) (H-1200, Vector Labs) and the coverlids were sealed with nail polish.
Slides were observed under an Axio Imager.Z1 microscope (Zeiss). Images were acquired with Cytovision® software and processed with ImageJ software (imagej.nih.gov/ij/).
4. Cell cycle
Cell cycle was analysed by Fluorescence-activated cell sorting (FACS). Cells (HL60 and HEL; 1 x 10⁵ cell/mL) were plated, synchronized as described above. Afterwards, medium was supplemented with 1% FBS and 10mM lactate and/or 25 ng/mL VEGF plus 5U/mL heparin and maintained at 37°C and 5% CO2. Cell samples
(500µL) were collected by centrifugation (1200rpm, 3 min) at 2, 4, 8, 26, 32h of incubation, fixed in 70% ethanol and maintained at 4°C for, at least 24 hours.
The determination of the amount of DNA per cell was performed with propidium iodide (PI), in order to determine the percentage of cells in each phase of the cell cycle. PI is a fluorescent DNA intercalating compound, allowing the relative quantification of cellular DNA content. For PI labelling, cells were centrifuged at 1500 rpm for 5 min and cell pellet was resuspended in 100 μL of 50 μg/mL PI solution (Appendix I) and incubated at 37°C for 40 min. After incubation, 300 μL of PBS was added and cells were centrifuged at 1500 rpm, 10 min at 4°C. The supernatant was discarded and cells were resuspended in 200 μL PBS 0.1% (w/v) BSA and analysed by FACS (FACScalibur - Becton Dickinson). The percentage of cells in each cell cycle phase was assessed using FlowJo Software, excluding dead cells and cell aggregates. Average and standard deviation were calculated and statistical analysis was performed.
17
5. Cell Cycle duration
Based on Eidukevicius et al [71], 2005 from PI labelling was used to determine the duration of each cell cycle phase and the total cell cycle duration.
The proposed method is based on two assumptions. The first assumption, i.e., the labelled cell mortality or exit from the cell cycle during the period of measurement is negligible, can be regarded as reasonably simple and generally acceptable and the second assumption is that the number of labelled cells traversing the cell cycle per unit time is constant [71].
With the data obtained from FACS analysis described above, it is possible to obtain the number of divided G1 cells (G1ld), divided S cells (Sld), undivided S cells (Slu) and undivided G2 cells (G2lu) what would give rise to the time of S phase (Ts), G2 phase (TG2) and G1 phase (TG1). Ts, TG2 and TG1 together correspond to the total duration of cell cycle.
2 ( ) ( )
6. Nuclear magnetic resonance (NMR)
Cells (5 x 10⁷ cell/mL) were submitted to starvation as described above. In order to understand the metabolism of lactate, cells were exposed to 10nM 13C-[U]-lactate (660817, Sigma-Aldrich®), and/or 25 ng/mL VEGF plus 5U/mL heparin in 40mL of RPMI medium supplemented with 1% FBS and 1% AA and maintained at 37°C and 5% CO2.
After 24 hours cells were centrifuged at 1200 rpm for 2 min, the supernatants were collected and stored at -20°C and the pellets were washed in PBS.
To separate the organic and aqueous phases, methanol and chloroform extraction was performed in cell pellets. To calculate the volume of methanol added for each sample, cell pellets were weighed (4ml methanol/1g weight pellet). Then sequentially, 2 volumes of water were added, mixed and incubated on ice for 5 min; 1
18
volume of chloroform was added and mixed, and 1 volume of water was added and incubated on ice for 10 min. Finally, samples were centrifuged at 4000 rpm for 15 min at 4°C, in order to define organic (lower) and aqueous (upper) phases that were collected separately and stored at -20°C until they were lyophilized, in Speed Vac Plus Savant SC110A.
Samples were dissolved in deuterated water (D2O) and 4% (v/v) azide (N3) /
4,4-dimethyl-4-silapentane-1-sulfonic acid (DSS) solution (1:10). 50μl of D2O and 4% (v/v) N3 / DSS solution was also added to supernatants. NOESY 1DPR 1D (1H), HSQC 2D (1H, 13C) and TOCSY 2D (1H, 1H) spectrums were obtained in a magnetic field of 800 MHz at 25°C in UltrashiedTM 800 Plus (Bruker) with TXI probe and COSY 2D (13C, 13C) spectrum was obtained in a magnetic field of 500 MHz at 25°C in UltrashiedTM 500 Plus (Bruker) with 13C Dual probe. Software used in acquisition was Topspin 2.1 on avance 800 (Bruker) and 21 spectrums analysis were done according the chemical shifts supported with the Human Metabolome database (HMDB) (http://www.hmdb.ca/) and Chemomx NMR suite 7.6.
Following the results obtained for the lactate metabolism, cells were also exposed to 4mM of 13C-[U]-D-glucose (CC860P20, Cortecnet) and 16mM of D-glucose (G8270, Sigma-Aldrich®) and 25 ng/mL VEGF plus 5U/mL heparin with or without 10mM lactate in 40mL of RPMI medium supplmented with 1% FBS and 1% AA, maintained at 37°C and 5% CO2. Cells were then treated as described above.
7. Apoptosis analysis by Flow Cytometry
HL60 and HEL cells (1 x 10⁴ cell/mL) were synchronized as described above. Cells were then plated in 48 plate tissue dishes at a 1 x 10⁴ cells/mL concentration and exposed to 13C-[U]-lactate and/or VEGF plus 5U/mL heparin in 40mL of RPMI medium supplemented with 1% FBS and 1% AA.
Cells exposed to the different experimental conditions were collected at 2, 4, 8, 26 and 32h and centrifuged at 1200 rpm for 3 min and washed with PBS 0.2% (w/v) BSA. The distinction between apoptosis and necrosis was performed using labelled Annexin V and PI. In live cells PS is in the cytoplasmic surface of the cell membrane and, with the apoptosis process, is translocated to the outer surface of the cell
19
membrane. Annexin V binds to phosphatidyl serine (PS) that is present in the external surface of apoptotic cells membrane. PI stains necrotic cells and not live and apoptotic cells. Necrotic cells have pores in their membrane that allows PI to enter and bind to the nucleic acids in the cell. Staining was performed using 1 μl FITC Annexin V (640906, Bio Legend) and 1 μl PI solution (50μg/mL) in 100 μl of annexin V binding buffer per sample and incubated at RT and in dark for 15 min. After incubation, samples were resuspended in 200 μl of annexin V binding buffer (Appendix I) and analyzed by flow FACS.
8. Chromatin Immunoprecipitation (ChIP)
HL60 and HEL cells we synchronized, control and exposed to 10mM lactate and/or 25 ng/mL VEGF plus 5U/mL heparin).
HL60 and HEL cells (5 x 10⁷ cell/mL) were synchronized as described above. Cells were then exposed to lactate (10mM) and/or VEGF (25 ng/mL) plus 5U/mL heparin in 40mL of RPMI medium supplemented with 1% FBS and 1% AA.
After stimulation (24h), 37% formaldehyde (Merck) was added to cells to a final concentration of 1% (v/v) and incubated for 10 min at RT (to cross-link DNA and proteins) and then formaldehyde was quenched by addition of 125mM glycine and incubated for 5 min at RT. Then cells were harvested and centrifuged at 1200 rpm for 2 min and 500 μL of ChIP lysis buffer (kch-onedIP-060, Diagenode) were added to cell pellets and stored at -70°C.
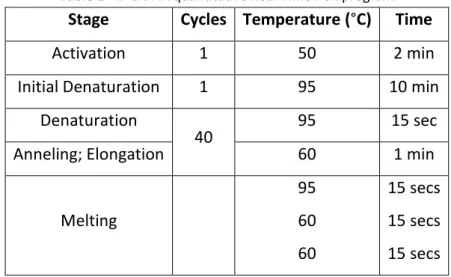
Cell pellets were thawed on ice and sonication was performed (19 intermittent cycles of 30 seconds each one). Chromatin fragmentation was evaluated by gel electrophoresis, 5 μL of chromatin were separated by a 1.2% (w/v) agarose gel electrophoresis in TBE buffer (10X TBE, EC-860, National diagnostics) stained with 0.05% (v/v) ethidium bromide. Fragmented chromatin was stored at -70°C. ChIP was performed using OneDay ChIP kit (kch-onedIP-060, Diagenode) accordingly to manufacturer’s protocol. FOXM1 antibody (sc 26688, Santa Cruz Biotech) (target) and a rabbit non-immune IgG (kch-onedIP-060, Diagenode) were used. Amplification and analysis of Immunoprecipitated (IP’d) DNA was done through qRT-PCR, accordingly to manufacturer’s protocol, in an ABI PRISM 7900HT Sequence Detection System (Applied
20
Biosystems) (Table 1) using specific primer flanking c-Myc binding site in MCT1 promoter (pMCT1; Table 2). Data were analyzed in SDS 2.4.1 software (Applied Biosystems) and relative occupancy of the immunoprecipitated factor at specific loci was calculated using the following equation:
2(CtNegCtl - CtTarget)
CtNegCtl and CtTarget are the average threshold cycles of PCR done in triplicates on DNA samples from negative control ChIP and targeted ChIP.
Table 1 - IP’d DNA quantitative Real-Time PCR program
Stage Cycles Temperature (°C) Time
Activation 1 50 2 min Initial Denaturation 1 95 10 min
Denaturation
40 95 15 sec
Anneling; Elongation 60 1 min
Melting 95 60 60 15 secs 15 secs 15 secs
Table 2 - Primers used in IP’d DNA quantitative Real-Time PCR
Reference Primer (5’-3’)
pMCT1 For: GTATTACTCACTAGTAGTACTTGGC Rev: GAGATTGAAGAAGAGTAGAGATTGG
9. Immunohistochemistry
BM paraffin blocks from LMA patients belong to the archive of the Pathology Department of the Instituto Português de Oncologia de Lisboa de Francisco Gentil, were retrieved as well as and clinical data of the patients.
Paraffin sections (2µm) were treated in xylol for 10 min to remove paraffin and tissue hydratation was performed in a stepwise sequence of decreasing concentrations of ethanol for 5 min and finally in running water for 10 min.
21
The sections were then incubated with anti-MCT1 (1:400; AB3538P, Millipore) and MCT4 (1: 150; SC-50329, Santa Cruz Biotech) at RT for 1 hour and then incubated with EnVision/HRP rabbit/mouse (Dako, K5007) detection staining system for 30 s at RT. After washing in TBS, the visualization signal was developed with 3,3’-diaminobenzidine (DAB) solution, and all the slides were counterstained with Mayer’s hematoxylin.
10. Quantitative Real-Time PCR of BM samples from AML patients
Ribonucleic acid (RNA) from BM samples from LMA patients was obtained from Hemato-oncology laboratory from IPO Lisboa.
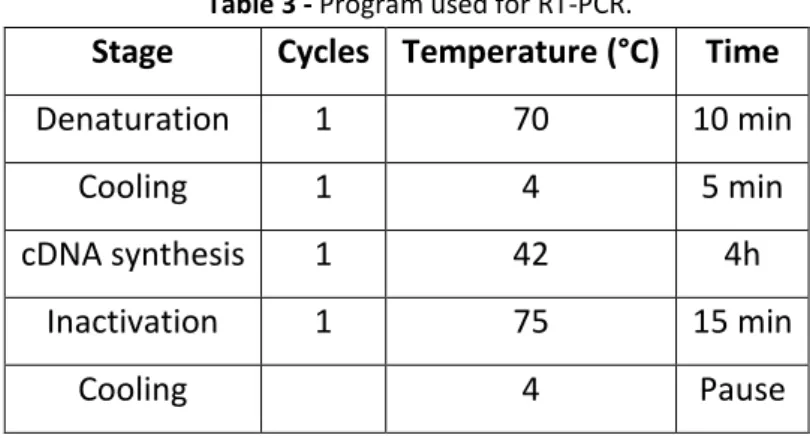
cDNA was synthesized from 1μg RNA with SuperScript II Reverse Transcriptase (18080-44, Invitrogen - Life Technologies Inc), according to the manufacturer’s protocol. As initiators random hexamers (11034731001, Roche) were used. cDNA synthesis was performed in a T3000 thermocycler (Biometra), using the following conditions (Table 3).
Table 3 - Program used for RT-PCR.
Stage Cycles Temperature (°C) Time
Denaturation 1 70 10 min
Cooling 1 4 5 min
cDNA synthesis 1 42 4h Inactivation 1 75 15 min
Cooling 4 Pause
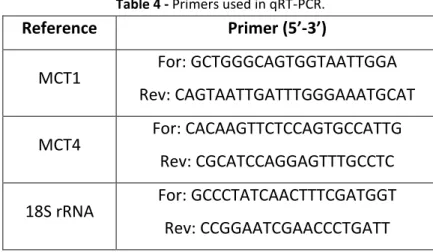
Quantitative Real-Time PCR (qRT-PCR) was performed for each sample. Each reaction mixture was performed on 25 μL, containing 1 μl cDNA, 12.5 μL Power SYBR Green PCR Master Mix (4367659, AB), 0.15 μl of forward and reverse primers (10μM) (Table 4), and sterile bidestilled water up to 8.3 μl. The housekeeping gene used to normalize the samples was 18S rRNA.
Each PCR experiment included one non-template control well. Real-time PCR was carried out in an ABI Prism® 7900HT Sequence Detection System (Applied Biosystems), according to the program described in the Table 5.
22
Table 4 - Primers used in qRT-PCR.
Reference Primer (5’-3’)
MCT1 For: GCTGGGCAGTGGTAATTGGA Rev: CAGTAATTGATTTGGGAAATGCAT
MCT4 For: CACAAGTTCTCCAGTGCCATTG Rev: CGCATCCAGGAGTTTGCCTC
18S rRNA For: GCCCTATCAACTTTCGATGGT Rev: CCGGAATCGAACCCTGATT
Table 5 - Program used for real-time qRT-PCR.
Stage Cycles Temperature (°C) Time
Initial denaturation 1 95 2 min Denaturation 45 95 15 secs Annealing 60 1 min Melting 95 to 60 15 min Cooling 40 10 secs 11. Statistical analysis
The statistical significance of results was evaluated by 2-way ANOVA using GraphPad Prism 5 software. Data’s were considered significant when p<0.05.
23
Results
1. NMR - Metabolic profile of HL60, but not HEL, is modulated by lactate and VEGF
It has been shown that cancer cells metabolic fitness is an advantage for cells to survive in tumour/organ microenvironment. By NMR, we assessed the metabolic profiles of HL60 and HEL cells exposed to lactate, VEGF and both.
As published by Brito (2011), in HL60 cell line NMR analysis showed that carbons from lactate are incorporated in acetate, amino acids (alanine and glutamate) and malate, an intermediate of the TCA cycle (Figure 3). The incorporation of lactate happens in the presence and absence of VEGF. However, in HL60 cells exposed to VEGF, nucleotides were detected (Figure 3). Glucose (not 13C-labeled) was detected in control cells and in cells cultured with 13C-lactate. Nevertheless, in cells cultured in the presence of VEGF, glucose is not detected.
Figure 3 - HL60 metabolic profile by NMR spectroscopy. 13C-1H HSQC spectra of the aqueous extracts of
HL60 cells cultured in DMEM medium (blue); DMEM + 13C-lactate (red); DMEM + VEGF (green); and DMEM + VEGF + 13C-lactate (black). When the cells were grown in the presence of VGEF, the glucose (Gluc) is absent and there is the appearance of resonances due to nucleotides (NT). In the case of growth in presence of VEGF and 13C-lactate appear resonances due to malate (Mal). There are some resonances that appear with lactate that should be further analysed.
![Figure 2 - Lactate-based metabolic symbiosis in tumours (based on Sonveaux et al, 2008 [19]) – high levels of HIF-1 in tumour cells in hypoxic increases the uptake of glucose via glucose transporters (GLUT) and its conversion to pyruvate that is converte](https://thumb-eu.123doks.com/thumbv2/123dok_br/15134344.1011190/26.892.300.600.346.699/lactate-metabolic-symbiosis-sonveaux-increases-transporters-conversion-pyruvate.webp)