© 2011 . Maria Manuela Santos Natário, João Pedro Almeida Couto, Maria Teresa Borges Tiago, Ascensão Maria Martins Braga. This is a research/review paper, distributed under the terms of the Creative Commons Attribution-Noncommercial 3.0 Unported License http://creativecommons.org/licenses/by-nc/3.0/), permitting all non-commercial use, distribution, and reproduction in any medium, provided the original work is properly cited.
Global Journal of Management and Business Research
Volume 11 Issue 11 Version 1.0 November 2011
Type: Double Blind Peer Reviewed International Research Journal Publisher: Global Journals Inc. (USA)
Online ISSN: 2249-4588 & Print ISSN: 0975-5853
Evaluating The Determinants Of National Innovative Capacity
Among European Countries
By Maria Manuela Santos Natário, João Pedro Almeida Couto, Maria Teresa
Borges Tiago, Ascensão Maria Martins Braga
University of the Azores,Portugal.
Abstract -
This paper reflects upon the factors that influence the national innovative capacity that
is based on the European Innovation Scoreboard database. The aim is to reflect on, and
evaluate, the factors influencing national innovative capacity. A cluster analysis was conducted to
verify how different countries are positioned in terms of innovation outputs and determine which
factors distinguish their level of innovative capacity. The results point to the existence of four
groups of countries. On the other hand, the factors identified are related to the dimensions of
institutional efficiency, namely the efficiency of institutions, types of regulation, effective rule of
law and level of corruption, societies’ cultural values associated with the level of hierarchy or
"power distance" and "uncertainty avoidance." Aspects are related to the innovation framework,
such as doctorates in science and engineering, business Research & Development expenses,
and the level of collaboration for innovation.
Keywords :
Innovative Capacity, Innovation, National Culture, Institutional Efficiency, Innovation
Infrastructure.
Evaluating The Determinants Of National Innovative Capacity Among European Countries)
Strictly as per the compliance and
regulations of:
Evaluating The Determinants Of National
Innovative Capacity Among European Countries
Maria Manuela Santos Natárioα, João Pedro Almeida CoutoΩ, Maria Teresa Borges Tiagoβ, Ascensão
Maria Martins Bragaѱ
I.
I
NTRODUCTIONhe capacity for innovation plays a dominant and decisive role in determining who thrives in the global arena. For firms, innovation has the power of establishing a competitive advantage in the context of increasing globalization. For countries, the innovation capacity is a source of prosperity and growth (Belitz et al., 2008). Thus, national objectives may be achieved by increasing productivity and attracting investment to sustain continuous improvement in standards and quality of life.
The concept of innovative capacity was introduced by Suarez-Villa (1990), to measure the level of invention and the
potential for innovation in a
Author α: Professor at Guarda Polytechnics Institute. Av. Dr. F. Sá
Carneiro, 50, 6300- 559 Guarda - Portugal. (Telephone: +351 271220 120, E-mail: [email protected])
Author Ω: Professor at University of the Azores, Rua da Mãe de Deus
9500- 310 Ponta Delgada, Portugal. (Telephone: +351 296650083 E-mail: [email protected])
Author β: Professor at University of the Azores, Rua da Mãe de Deus
9500-310 Ponta Delgada, Portugal. (Telephone: +351 296650083 E-mail: [email protected])
Author ѱ: Professor at Guarda Polytechnics Institute. Av. Dr. F. Sá
Carneiro, 50, 6300- 559 Guarda - Portugal. (Telephone: +351 271220 120; E-mail: [email protected])
information about the dynamics of the invention in economic activity. This knowledge can be used by policy-makers and scholars to better understand the changes in invention patterns, technology and competitiveness. The national innovative capacity can provide comparative information regarding the evolutionary process of inventive activity, as well as information on its relationship with the primary factors of the invention. Thus, the innovation capacity of an area is linked to the territorial dynamics of the innovation, legal and/or individual, and is conditioned by the specific characteristics of each area based on the five groups of factors/dimensions of this crucial process.
Considering these observations, the aim of this paper is to evaluate the factors that influence national innovative capacity. In this sense, and taking into consideration the European Innovation Scoreboard, we analyzed innovative capacity in terms of Small and Medium-sized Enterprises innovative behaviour. In the present paper, five hypotheses are proposed: the first is related to the influence of the institutional efficiency on innovative capacity; the second pertains to the role of national culture; the third refers to the influence of the innovation’s collective infrastructures (human resources and the dynamics of learning and training) in the promotion of innovative capacity; the fourth focuses on the sustainability and support system of innovation; and the fifth is associated with the linkages and cooperation networks used to stimulate innovation capacity. The rest of the paper is structured as follows. On the and decisive role in determining who thrives in second point, a brief literature review is performed regarding the innovative capacity. The third point describes the conceptual Model and the hypotheses. The two last points illustrate the methodology and primary findings of the data, as well as discusses these results and their implications, stressing the limitations of the work and suggesting avenues for future research.
II.
L
ITERATURER
EVIEWNational innovative capacity can be broadly defined as the institutional potential of a country to
T
Abstract - This paper reflects upon the factors that influence the national innovative capacity that is based on the European Innovation Scoreboard database. The aim is to reflect on, and evaluate, the factors influencing national verify how different countries are positioned in terms of innovation outputs and determine which factors distinguish their level of innovative capacity. The results point to the existence of four groups of countries. On the other hand, the factors identified are related to the dimensions of institutional efficiency, namely the efficiency of institutions, types of regulation, effective rule of law and level of corruption, societies’ cultural values associated with the level of hierarchy or "power distance" and "uncertainty avoidance." Aspects are related to the innovation framework, such as doctorates in science and engineering, business Research & Development expenses, and the level of collaboration for innovation.
Keywords - Innovative Capacity, Innovation, National Culture, Institutional Efficiency, Innovation Infrastructure.
innovative capacity. A cluster analysis was conducted to
nation. According to Suarez-Villa, the measurement of
the innovation capacity can provide important
Global Journal of Management and Business Research Volume XI Issue XI Version I November 2011
1 67
sustain innovation (Hu and Mathews, 2008; Huang and Shih, 2009). The concept of innovative capacity was introduced by Suarez-Villa (1990) to measure the level of invention and innovative potential of a nation. According to Suarez-Villa, measuring the innovative capacity may provide important information about the dynamics of the invention in the economic activity. Such knowledge may be used by policy-makers, or academics, to assist in the understanding of the changes in the invention, technology and competitiveness. They can then take action accordingly.
The concept of innovation capacity emerged as a meta-concept to denote the real and potential capabilities of a system to convert knowledge into innovation, which is able to drive long term economic growth and wealth creation (Lundvall and Johnson, 1994, Freeman 1995, Furman at al. 2002, Schiuma and Lerro 2008). For Matheus and Hu (2007), the innovative capacity of a country is the basic driving force behind its economic performance; it provides a measure of the institutional structures and support systems that sustain innovative activity.
The concept of national innovative capacity was explained in the works of Porter and Stern, (1999); Stern et al. (2001) and Furman et al. (2002). Their primary purpose was to measure the origin of the differences between countries regarding the innovative production, reflecting upon the analysis of the clusters of innovation. For these authors, the national innovative capacity is the country’s capacity (as a political and economic entity) to produce and trade a new flow of technologies, reflecting the fundamental determinations of the innovation process at all levels, not only the output level (Stern et al., 2001).
In the last few years, several works have been enriching this analysis and clarifying the concept. It has been introduced and adopted by different scholars interested in researching and understanding the factors and root determinants of innovation dynamics and the capabilities of development (Furman et al., 2002; Howells, 2005, Schiuma and Lerro, 2008).
Using a managerial approach, Suarez-Villa (2003) analyzed the relationship between the inter-organizational networks and innovative capacity, from which emerges a new type of organization: the "experimental firm". Belderbos et al. (2004) analyzed the impact of Research and Development (R&D) in cooperation with the innovative performance of the firm at the level of employment creation and innovation productivity, by considering the countries from the Community Innovation Survey II.
Camelo-Ordaz et al. (2005) studied how certain top management teams characteristics influence innovative capacity in companies, conceptualized in terms of levels of product innovation. Ganzaroli et al.
(2006) examined the relationship between business succession and innovative capacity, to explore business transfers as a potential source of innovation in Small and Medium - sized Enterprises (SMEs). Henttonen (2006) pointed out the role of internal and external innovation networks in driving forward a firm’s innovative capacity.
At the territorial level, several authors sought to identify factors, or determinants, affecting innovative capacity in the country and/or regions. Ridel and Schwer (2003) used the model proposed by Romer (1990) and tested by Furman et al. (2002), to determine the endogenous relationship between employment growth and the innovative capacity, applying it to the United States of America (US). On the other hand, Archibugi and Coco (2005) compared different methodologies adopted by worldwide organizations (World Economic Forum - WEF, UN Development Program - UNPD, UN Industrial Development Organization - UNIDO and RAND Corporation), to measure the national technological capacity. In studies by Pontikakis et al. (2005) and Jaummotte (2006), they discuss the functioning of the national innovation systems, its performance and the role of incentives in maintaining and improving the national innovative capacity.
Hu and Mathews (2005) extended and modified the Furman et al. (2002) approach, applying it to five “latecomer" countries from East Asia, in particular, Taiwan. While the results are in broad agreement with the findings of Furman et al. and Hu and Mathews, some important differences for latecomer East Asian economies exist such as the number of national factors that matter is smaller and an important (though subtle) role seems to be assumed by the public R&D expenditure, acting as a steering mechanism for the private sector.
On the other hand, university-based R&D (a basic research resource) has not exhibited a significant effect over the past two decades. Hu and Mathews (2005) demonstrate that the public R&D funding in East Asia greatly strengthens the contribution of specialization in the high-tech industries, however, this effect was only registered when a latecomer country was pursuing a targeted strategy of catch up, as in the case of Taiwan.
More recently, Mathews and Hu (2007) examined the efforts of Taiwan’s academic innovation through institutional and organizational reforms. They also evaluated its impact in assisting Taiwan in moving beyond the phase of being a catch-up manufacturing fast follower to that of an innovation-based technology developer. In 2008, Hu and Mathews performed the first study on China’s national innovative capacity’, extending their earlier work conducted on the East Asian Tiger economies. They found an increase in patenting activity by Chinese firms
Global Journal of Management and Business Research Volume XI Issue XI Version I November 2011
1 68
and organizations since 2001, and analysed the drivers behind this, as well as the quality characteristics of patenting, in terms of intensity impact and links with the science base.
The innovation capacity in China was also studied by Fan (2008). The author analyzed the innovation capacity and economic development in China and India, focusing on the transformation of national innovation systems. Fan (2008) considers financial investment and human resources in R&D as two important input factors for building up the innovation capacity of a nation. He also stresses the role of both governments in transforming their national innovation systems to become more adaptable to economic development. One of the primary focuses of R&D reforms was to integrate the science and business sectors and provide incentives for innovation activities.
The study by Natário et al. (2007) reflected upon the factors that influence national innovative capacity, based on the European Innovation Scoreboard (EIS) database. These authors tested the importance of the innovation of variables that were not considered in the innovation scoreboard, namely national cultural aspects and institutional efficiently, together with variables that were normally compiled in the scoreboard, such as expenditures and human resources qualifications, namely tertiary education, sciences and engineering graduates.
At the regional level, Schiuma and Lerro (2008) discussed the role and relevance of knowledge based capital as a strategic resource and a source of regional innovation capacity. They identified human, relational, structured and social capital, as the four primary knowledge based categories, building up the knowledge based capital of a region. Schiuma and Lero (2008) used the concept of innovation capacity to refer to the overall innovation capabilities that a region can express, both in practice, and potentially. This model includes both the innovation dynamics taking place at the regional level, and those that could potentially be developed by policy andmanagement actions, by leveraging local and external knowledge resources.
The relationship between national innovative capacity and network contamination effects on the international diffusion of embodied and disembodied technology was analysed by Huang and Shih (2009). Their work examined two different social network models: cohesion models based on diffusion by direct communication; and, structural equivalence models, based on diffusion by network position similarity. The empirical results found distinguishable influences upon the performance of the national innovative capacity between countries with different technological diffusion forms and social proximity.
Embodied or disembodied technology diffusion through structural equivalence mechanisms has a significant influence on the performance of national innovative capacity. However, a country is affected more by its structurally equivalent competitors, than by its cohesion partners. Moreover, embodied or disembodied technology diffusions through cohesion mechanisms may have negative effects on the performance of national innovative capacity, which can be regarded as international technology diffusion via global stratification patterns (Huang and Shih,
2009).
As a result, the innovative capacity is not concerned with any single aspect of innovation performance, but with sources of its sustainability (Matheus and Hu, 2007). A country’s innovative capacity, considered as the ability of people and companies to create and transform knowledge into new, marketable products and services and more efficient processes, cannot be measured directly (Belitz et al., 2008).
The innovative capacity of a territory, nation or region, is grounded in its microeconomic environment and related to the number of scientists and engineers in the workforce and in the degree of protection of intellectual property and in the power of the clusters. This last point reflects upon the concentrated location of the resources that harness the managerial competitiveness.
For Stern et al. (2001), national innovative capacity relies on three vectors: (1) the endogenous growth based on the ideas of Romer (1990); (2) the theory of the industrial clusters based on the nation’s competitive advantages developed by Porter (1990); and (3) the research developed in the nationalinnovation systems presented by Nelson (1993). Its differences reflect the variations in economic geography, namely, the impact of the knowledge and spillovers of innovation amongst closely situated companies, and in the innovation’s policies through the level of public support for basic research or the protection of intellectual property.
Stern et al. (2001) and Porter and Stern (1999) have highlighted the importance, not only of the present competitiveness, but also of the capacity of sustaining it in the future, considering the following aspects as determinants of the national innovative capacity: common facilities such as public institutions, resources committed, policies that support innovation; the environment for innovation in the industrial clusters of a nation; and the quality of the relationships amongst the capacity to narrow the gap between research, the companies and the collective efforts that contribute to an entire set of specialized personnel and technology. The innovative performance of economies results from the interaction among these three categories. The national innovative
Global Journal of Management and Business Research Volume XI Issue XI Version I November 2011
1 69
capacity is supported by the innovation systems’ approach, amongst others. This systemic innovation approach has brought with it new knowledge about the performance, as well as the innovative and economic capacity of the countries. To be innovative, a country requires, first and foremost, a well-functioning national innovation system1. It secondly requires a favourable social climate for innovation (Belitz et al., 2008). Theseauthors present a composition of the innovation indicator for Germany, 2008; composed by aninnovation system and social climate for innovation. The first indicator is composed of education (highly qualified individuals), and R&D (new knowledge),financing (sufficient capital), that together are responsible for impelling networking (from partners),competition, implementation and demand market. The social climate for innovation (second indicator) is related to public opinion on the process change, social capital, trust, and science and technology.
For Natário et al. (2007), a country’s national economic capacity depends on that country’s institutional efficiency, its national culture and its innovation framework. The primary differences in the level of innovative capacity are associated with the efficient functioning of the national innovation systems. This requires a combination of the economic framework and the different institutions of the countries, in the determination of the direction and ratios of the innovative activities, a strong national culture for innovation and infrastructures supporting innovation. To measure the innovative capacity, Matheus and Hu (2005) and Hu and Matheus (2008), applied the ratio of the take-up of patents, issued by the US Patents and Trademarks Office (USPTO). For these authors, patents are widely recognized as providing a reliable and unbiased indicator of the innovation effort of a country. The adoption of patenting activities by Chinese firms and organizations at the USPTO were used as a measure of China’s National Innovative capacity (Griliches, 1990; Trajetnberg, 1990). To group countries by innovative capacity and innovation output, Natário et al. (2007) used the ratio of patent registration of the European Patent Office (EPO) and US Trademark Office (USPTO), measured by the ratios of high tech patent applications and general patent applications, relative to the population. However, patents are not only acknowledged as providing a reliable and unbiased indication of the innovation effort being expended by a country, but also regarded as a country’s R&D performance (Huang and Shih, 2009). R&D and patents
1The designation -national innovation systems -refers to enterprises,
institutions and surrounding conditions that influence the process by
which innovation arise (SeeLundvall (1992) and Edquist (1997).
are indicators that have major limitations for understanding the complexity of innovation processes. In fact, the innovation output indicator may be biased by the very characteristics of the National Innovation Systems, as Lorenz (2005) has shown. This topic has been the focus of discussion in the context of the revision of the EIS (Arundel and Hollanders, 2007; Hollanders and van Cruysen, 2008; Simões, 2008). A number of previous studies (Archibugi and Pianta, 1996; Smith, 2005) have assessed the strengths and weaknesses of different technology indicators, pointing out that R&D and patents have limited relevance in the innovative activities of some manufacturing, and most service, sectors, resulting in a serious underestimation of the extent of innovative efforts in these industries. In their empirical analyses, these data have the advantage of being available over an extended period of time (time series data) for firms, industries and countries (Bogliacino and Pianta, 2009). There is little doubt that patenting indicators cannot be considered as an innovation performance indicator. First, as several studies have illustrated, the use of patents is a volatile variable, varying according to the industries characteristics (Winter,1987). Therefore, it is not totally accurate to consider patents as an innovation performance indicator, much less the innovation performance indicator. For this reason, the EIS 2008 no longer labelled patents as an output indicator, but rather a throughput indicator (Hollanders and van Cruysen, 2008). Effectively, a new methodology has been used for theEIS 2008 report that is intended for use in the 2009 and 2010 reports, following a better understanding of the innovation process. The revision of the EIS methodology was a direct result of the challenges discussed in the EIS 2007 report to: 1) measure new forms of innovation; 2) assess overall innovation performance; 3) improve comparability at national, regional and international levels; and 4) measure progress and changes over time. The purpose of this revision has developed dimensions that brought together a set of related indicators to provide a balanced assessment of the innovation performance. The blocks and dimensions have been designed to accommodate the diversity of different innovation processes and models that occur in different national contexts (Hollanders and van Cruysen, 2008). Thus, it appears that under the new methodology used by EIS, patents that were in the previous Community Innovation Survey included in the definition of indicators "OUTPUT - Intellectual property" will be considered "Throughput" (as stated) indicators, or one of the dimensions used to capture the innovation efforts of firms. In view of this, and attempting to contemplate these concerns, to measure the
Global Journal of Management and Business Research Volume XI Issue XI Version I November 2011
1 70
innovative capacity of a nation was chosen by the required output of the EIS. This captures the outputs of firm activities, namely, the Innovators dimension.
This dimension captures the success of innovation by the number of firms that have introduced innovations onto the market or within their organizations. It covers both technological innovations and non-technological. Consequently, the variables considered to measure innovation were SMEs introducing product or process innovations (% of SMEs), SMEs introducing innovations that are marketing or organisational (% of SMEs); reduced labour costs (% of firms) and the reduced use of materials and energy (% of firms).
III.
C
ONCEPTUALM
ODEL ANDH
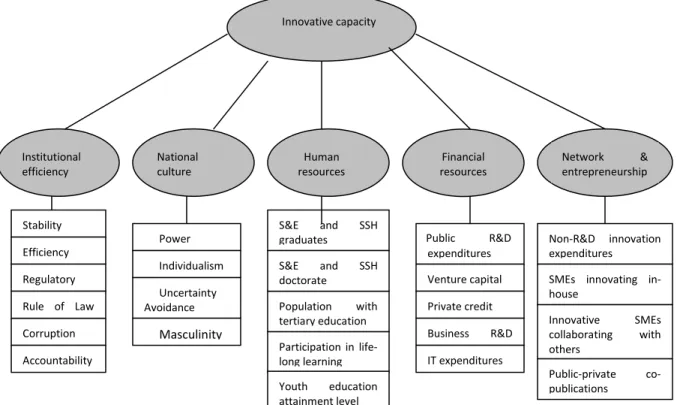
YPOTHESESWith the understandings that emanate in the theoretical foundations, the following dimensions, or groups of factors, are considered determinants of the territorial innovative capacity (Figure 1): institutional efficiency, based on the commitment and performance of the institutions, national culture, human capital, innovation’s workers skills and technological intensity, as well as the financial resources for innovation, and linkages and entrepreneurship.
The national innovative performance is conditioned by the specific characteristics of each country on the basis of five dimensions. In this paper, five hypotheses are proposed: the first is related to the influence of the institutional efficiency on innovative capacity, the second pertains to the role of national culture, the third refers to the influence of the innovation’s infrastructures in the promotion of innovative capacity, the fourth is qualified by the financing support of innovation and the fifth is associated with the linkages and cooperation networks used to stimulate/promote the innovation capacity.
Academic institutions are increasingly seen as influencers in the innovation capacity in a triple perspective or mission: triple helix (Vang-Lauridsen et at. 2007) acting as a spiral of knowledge capitalization. They
produce and coordinate the available scientific and technological knowledge; they provide superior graduation and skills for the industry, and through interaction with the industry and the creation of incubators, directly contribute to the development of the region (Vang-Lauridsen et al., 2007).Relying on the innovation systems’ approach of Lundvall (1992), Nelson (1993), Edquist (1997),Lundvall et al., (2006) and Asheim and
augment innovation (creation, diffusion and appropriateness) and promote competitiveness of this country; one can admit that the efficient functioning of these systems is associated with its institutional efficiency.
The specific institutional factors setting prevailing in a region plays a significant role in regard to the formation of a RIS (Regional Innovation System) and one of five primary sub-systems of the RIS suggested by Trippl (2006). The focus is on both formalinstitutions (such as laws, regulations, among others) and informal institutions (values, practices, routines, among others). Institutions matter, because they shape the behaviour of actors and the relationships between them. Factors such as the prevalent patterns of behaviour, values and routines, culture of cooperation and attitudes towards innovation constitutes the key factors of a region’s distinct institutional endowment (Trippl, 2006).
To test this hypothesis, we considered, as measurement variables, the stability and absence of violence and terrorism, government efficiency, regulatory quality, effective rule of law, control of corruption and voice and accountability, as defined by Evans and Rauch (1999) and Kaufmann et al. (2008), who calculated an index of these variables for different countries. Therefore, the first hypothesis is:
H1: Institutional efficiency has a positive influence on innovative capacity.
Coenen (2006), and considering that the national innovation system is defined as a complex set of actors (companies, and institutions), that whether in interaction or assembled, they are organized to
Global Journal of Management and Business Research Volume XI Issue XI Version I November 2011
1 71
Another determinant of national innovative capacity is the national culture, which influences the relationships, the constitution of innovation and cooperation networks, as well as the innovation system, and therefore, the innovative capacity. Porter (1990, 1998) and Dunning (1998) reiterated the importance of the national elements in international localization and the significance of the clusters to promote competitive advantage. The conditions to innovate are not applied universally, thus, each nation must determine its own characteristics in light of its own history, cultural values.
Hence, to measure the influence of national culture upon innovative capacity, the cultural dimensions of Hofstede (1987) were taken into consideration. The first of these dimensions is Power Distance that reflects the capacity of a society to accept an asymmetrical distribution of power; it varies from country to country. The second dimension is Individualism, which may be apprehended as the importance that is given to the objectives and individual efforts, as opposed to the objectives and collective efforts. The third is Uncertainty Avoidance, or the amount of uncertainty about future events that people of a certain national culture are willing to accept. The fourth is Masculinity that reflects the level of assertiveness promoted in the national culture. These dimensions, when taken together, allow for the classification and distinguishing of national cultures.
The definition of the second hypothesis rests upon a body of literature which includes papers by
Hofstede (1987), Ronen and Shenkar (1985), Kogut and Singh (1988) and Schneider and Barsoux (1997). The variables of significance correspond to Hofstede’s cultural dimensions, namely: power distance, uncertainty avoidance, individualism and masculinity. In the face of these considerations, the following hypothesis was established:
H2: The Dimensions of National Culture have a positive influence on innovative capacity.
The innovation’s collective infrastructure is the third pillar of national innovative capacity, according to several authors (Asheim and Coenen, 2006; Stern et al., 2002; Riddel and Schwer, 2003; Stern et al.,2001; Suarez-Villa, 1990, 1997). The creation of new knowledge is heavily dependent on a sufficient number of qualified scientists and engineers; for diffusion to take place, what matters most is the competence and talent of the workforce. In this sense, the works qualifications are essential for the success, or failure, of a country’s innovative efforts in the creation and diffusion of new knowledge.
Territories acquire great value from their innovation dynamics, depending on their capacity to create, disseminate and reproduce knowledge for products and services offered on the market in the creation of value. These dynamics are favored by the concentration of knowledge based, highly technological activities that employ human resources with high levels of education and qualification in the science & technology domain, such as the high-tech and service sectors.
Innovative capacity Institutional efficiency National culture Stability Corruption Efficiency Regulatory Rule of Law Accountability Power Individualism Uncertainty Avoidance Masculinity S&E and SSH graduates Population with tertiary education S&E and SSH doctorate Participation in life-long learning Human resources Public R&D expenditures Financial resources Network & entrepreneurship Youth education attainment level Venture capital Private credit Business R&D IT expenditures Non-R&D innovation expenditures SMEs innovating in-house Innovative SMEs collaborating with others Public-private co-publications
Figure 1 : Determinants of Innovative Capacity
Global Journal of Management and Business Research Volume XI Issue XI Version I November 2011
1 72
The highly qualified individuals (education) are key players in innovation ( Belitz et al., 2008). Consequently, the qualified human resources, in conjunction with an environment that stimulates intensive learning processes in R&D, may combine previous knowledge and explore new possibilities (Laranja, 2001), as well as stimulate innovation and creativity (Davenport and Prusak, 1998; PNUD, 2001). According to the literature, human resources are a key element of innovation. Innovation growth depends on the quality and availability of knowledge. Thus, it is a fundamental the qualification of human resources and the participation in life-long learning. In addition, the dynamic of learning and training influences the innovative capacity of the territories (Lundvall, 1992; Edquist, 1997; OECD, 2000a; Doloreux, 2004; Lundvall et al., 2006; Vang-Lauridsen and Chaminade, 2006; Vang-Lauridsen et al., 2007). Consequently, to test this hypothesis, the following variables were considered: science and engineering (S&E) and Social Sciences and Humanities (SSH) graduates (per 1000 population aged 20-29); S&E and SSH doctorate graduates (per 1000 population aged 25-34); population with tertiary education (percentage of people in the 25-64 age class); the participation in life-long learning per 100 people in the population aged 25-64 and the youth education attainment level. The third hypothesis has the following configuration:
H3: The Innovation’s Collective Infrastructure Training has a positive influence on innovative capacity. The creation of new knowledge may be stimulated through the increase of public and managerial R&D, as well as through the investment in information and communication technologies (ICTs). Countries make interactions that affect each other’s performance on economics, politics and culture, due to the development of information technologies (Huang and Shih, 2009). As largely emphasized in the literature, ICTs are vehicles for process innovation. The effects of ICTs on a firms’ competitiveness does not only regard process innovation, but also influences product innovation, by stimulating product differentiation, the development of new market niches, and directly allowing the implementation of new technological products (Camagni and Capello, 2005). Therefore, at the territorial level, ICTs spontaneously act on accessibility, creating the ability to overcome territorial periphery and the generation of the popular perception of "dead of distance" (Castells and Hall, 1994; Camagni and Capello, 2005).
For Mathews and Hu (2007), the significant effect of public R&D expenditures emerges as an important determinant of the degree of specialization of the countries; it can be seen as a source of innovation.
As a result, they examine inputs in the form of R&D expenditures to measure the national innovative capacity of a country. In turn, Hu and Mathews (2005) documented the important role of public R&D expenditures in acting as a steering mechanism for the private sector. Private credit conditions and venture capital are considered obstacles or vehicles for the development of innovations. To test this hypothesis, we considered Business and Public expenditures on R&D (percentage of GDP), Venture capital (% of GDP), Private credit (relative to GDP) and IT expenditures (% of GDP) as measurement variables. These considerations led us to frame the fourth hypothesis of the study as:
H4: Financing resources for innovation have a positive influence on Innovative Capacity. Another relevant aspect in the innovative performance of the territories is the coordination approach of the innovation activities: individually or in cooperation. The collaboration and the behavior in cooperation to innovate are modalities which present many benefits: the sharing of risks and costs which the innovation entails; accessing new and different markets; obtaining additional fundamental resources for innovation; accessing information, skills and specialists; and reducing development time for innovations (Von Stamm, 2005). The related R&D management literature stresses the necessity for the interaction among organizations to bring forth the progress of technological innovation between developers and users of new technology to enhance development (Huang and Shih, 2009). Schiuma and Lerro (2008) argued that innovation requires long-term cooperation between investors, entrepreneurs, researchers, firms, public authorities and consumers. Networking is the synergetic relationships that link the stakeholders within a region, as well as the external innovation players. It is one of three primary dimensions affecting a regional innovation capacity. Effectively, the learning process is an interactive characteristic and involves networking among firms, as well as dynamism in local reworks. This requires the development of linkages, networks and cooperation between different actors (Lundvall, 1992). Within a territory, there is particular importance to promote regional innovation, the artificial creation of the milieu through technological parks and cooperation between the various local actors and the network linkage (Landabaso, 1997). Many studies have illustrated that cooperation relationships are an efficient vehicle to promote innovation and competitiveness in a region or territory (Lundvall,1992; Edquist, 1997; OECD, 1997; Bramanti, 1999; Doloreux, 2004; Henttonen, 2006; Vang- Lauridsen et al., 2007).
Global Journal of Management and Business Research Volume XI Issue XI Version I November 2011
1 73
The network relationships of cooperation facilitate the production and transmission of the knowledge flow, the innovative performance determination of the companies and the territorial innovation process’ influence. Huang and Shih (2009) amplified that the influence of national innovative capacity requires a reinforcement of the internal elements. In addition, they recommend concentrating on the interaction between cohesive countries. Developing networks represents a method to increase the amount of accessible knowledge and improves the innovation capacity (Schiuma and Lerro, 2008). In face of these considerations, the following hypothesis was established:
H5 : The Systems of Interactions and Entrepreneurship have a positive influence on Innovative Capacity.
IV.
M
ETHODOLOGY ANDR
ESULTSThe primary data source used to evaluate the national innovative
capacity was the European Innovation Scoreboard for 2008. This database contains European country innovative activity and performance data and is revised annually.
The method used for the analysis is based on the application of a cluster
analysis, to group the countries according toinnovative capacity, measured by the level of innovation output. To verify the hypothesis, we applied multiple means comparison tests to distinguish the unique characteristics of each cluster. This methodology groups the countries according to their level of product and process innovation, marketing and organizational innovations, innovations that reduce labor cost and innovations that reduce the use of materials and energy.
The groups constituted of countries with similar records and those with dissimilar records. Considering that similarities are a set of rules that serve as criteria for grouping or separating items, in the present case, the SMEs introducing products or process innovations; SMEs introducing marketing or organizational innovations; reduced labor costs; and, reduced use of materials and energy were considered. This methodology maximizes the homogeneity of countries within a group and constitutes groups that are heterogeneous to each other, by minimizing the variance within the groups and maximizing the variance between the groups.
The use of cluster analysis proved to be adequate. The variables used to classify the countries were all significant for the final solution estimated.This was verified by conducting an ANOVA analysis (Table 1).
Cluster Error F Sig.
Mean Square df Mean Square df Mean Square df SMEs introducing product or process innovations 670,658 3 24,848 20 26,990 0,000 SMEs introducing marketing or organisanational innovations 975,489 3 44,731 20 21,808 0,000 Reduced labour costs 242,534 3 14,098 20 17,204 0,000 Reduced use of materials and energy 86,490 3 8,096 20 10,683 0,000
The results illustrate that all classification measurements used in this analysis were significant. The value of the significance probability is almost null and permits us to reject the null hypothesis stating that the measurements’ are not significant in classifying the countries.
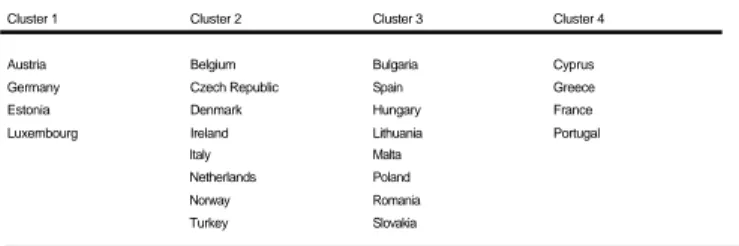
The application of the cluster analysis identified four country groups. The first consisted of Austria, Germany, Estonia and Luxembourg; the second consisted of Belgium, Czech Republic, Denmark, Ireland, Italy, Netherlands, Norway and Turkey; the third consisted of Bulgaria, Spain, Hungary, Lithuania, Malta, Poland, Romania and Slovakia; and, the fourth consisted of Cyprus, Greece, France and
Cluster 1 Cluster 2 Cluster 3 Cluster 4
Austria Belgium Bulgaria Cyprus
Germany Czech Republic Spain Greece
Estonia Denmark Hungary France
Luxembourg Ireland Lithuania Portugal
Italy Malta Netherlands Poland Norway Romania Turkey Slovakia Table2: Cluster Membership
These four groups presented different patterns in regard to their performance in terms of innovative capacity. The results in Table 3 illustrate that the first cluster has a higher percentage of firms that have conducted an introduction of new products or processes and introduced marketing and organization innovations.
The fourth group follows in terms of innovation indicators, but with an emphasis on innovations that reduce labor costs, materials and energy consumption. The second group is less innovating than the first and fourth groups. The third group, on the other hand, illustrates a much smaller innovative profile than the second.
Table 3:
Cluster Constitution To interpret the
relationship between the explanatory variables and the dependent variable of innovative capacity, we tested group mean differences regarding the variables considered in the hypothesis.
Regarding the importance of the institutional efficiency in the innovative capacity, we may state that Cluster 3, with minor innovative capacity,illustrates a
Table 1 : ANOVA Analysis
Portugal (Table 2).
smaller institutional efficiency in most of the variables used to measure this aspect, namely, in the relationship with the first cluster, with the exception of the
Global Journal of Management and Business Research Volume XI Issue XI Version I November 2011
1 74
stability and accountability indicators that we observed in Table 4.
Table 4:
Mean Differences among Groups -Institutional
Efficiency
Considering the influence of the differences in the dimensions of national culture on innovative capacity, we observe that the countries that constitute Cluster 3, by opposition to the ones that constitute Cluster 1, national culture characterized by a stronger power distance. This stronger power distance, verified in the countries within Cluster 3, seem to have a negative innovation influence, possibly due to aspect that is derived from strong power distances like less open communication channels, leading to lesser cooperation, to minor network relationships and to less interaction, which, in turn, limits the country’s innovative capacity(Table 5).
The results also illustrate that the countries in the Cluster 4 exhibit much higher uncertainty avoidance than countries in Clusters 1 and 2. Being that the characteristics of the countries in Cluster 4 illustrate innovation activities in reducing labor costs and materials an energy use, we can speculate that these cultural characteristics are related to the objectives considered in terms of innovation.
Cluster 1 Cluster 2 Cluster 3 Cluster 4 Dif.
PowerDistance 39,00 41,38 72,17 63,67 1<3
Individualism 69,25 67,38 50,33 44,33
UncertaintyAvoidance 48,50 57,50 71,50 100,67 1,2<4
Masculinity 64,50 43,63 67,00 43,67
Table 5: Mean Differences among Groups -National Cultural Dimensions
Regarding the human resources indicators, we observed that the number of doctoral graduates in S&E and in Social Sciences and Humanities (SSH) is higher in Cluster 4 that all of the other clusters, but the remaining indicators were not found to be significantly different (Table 6). Based on these results,
although
there were some
differences,
When we did not see a clear pattern that differentiated the clusters in terms of human resources capabilities.
When we look at the financing of innovations, we can see significant differences
in Business R&D expenditures (Table 7). In this aspect, the countries in cluster 1 and cluster 2 have higher levels than countries in the cluster 3 and 4. In all other aspects, there were no statistically significant differences between the groups. Therefore, business efforts influence innovation performance.
Cluster 1 Cluster 2 Cluster 3 Cluster 4 Dif. Public R&D expenditures (% of GDP) 0,60 0,62 0,40 0,49 Venture capital (% of GDP) 0,04 0,08 0,05 0,05 Private credit (relative to GDP) 1,48 1,38 0,85 1,65 Business R&D expenditures (% of GDP) 1,38 0,92 0,31 0,58 1,2>3,4 IT expenditures (% of GDP) 2,87 2,54 2,39 2,03
Table 7:
Mean Differences among Groups -Support Systems
In terms of linkages and entrepreneurial efforts, we can see major differences between the groups. In terms of non-R&D innovation expenditures, SME’s in-house innovation activities and innovative collaboration, we observed significant differences between the clusters. More specifically, the countries in Cluster 1 have higher levels on these three aspects of innovation. Cluster 4 also tended to have a higherlevel, when compared with Cluster 3 (Table 8).
Cluster 1 Cluster 2 Cluster 3 Cluster 4 Dif. Non-R&D innovation expenditures 3,10 0,49 0,88 0,77 1>2,3,4 SMEs innovating in-house 40,07 30,48 17,29 34,18 1>2,3 and 4>3 Innovative SMEs collaborating with others 15,79 9,62 6,10 19,29 4>2,3 and 1>3 Public-private co-publications per million population 5,37 6,03 2,49 4,62
Table 8: Mean Differences among Groups -Linkages & Entrepreneurship
These results illustrate the importance of entrepreneurial efforts in non-R&D innovation expenditures and in developing in-house innovation activities, as well
as the need for collaboration between firms.
V.
D
ISCUSSION ANDC
ONCLUSIONSThis paper contributes to the existing literature in the way it tests the importance of variables that have not been considered in the innovation scoreboard, namely national cultural aspects and institutional efficiency, together with variables that are normally considered in the scoreboard, such as expenditures and human resources, financing of innovation, linkages and the entrepreneurial efforts of firms. We determined
that
the primary differences in the level of innovative capacity are associated with the efficient functioning of the different national institutions of the country, a low power distance national culture, doctoral graduates in S&E and SSH, business efforts that finance R&D, firms efforts that develop in-house innovation, the support of non-R&D innovation activities and collaboration among firms to innovate. These results support Hypothesis 1, that stated that the national
Table 6 : Mean Differences among Groups - Human Resources
Global Journal of Management and Business Research Volume XI Issue XI Version I November 2011
1 75
innovation capacity is influenced by institutional factors, since the aspects of institutional efficiency, the type of regulation, the effective rule of law and the control of corruption levels were found to be significant variables in distinguishing the more innovative countries from the less innovative ones. The second hypothesis stated that the national culture has an influence on the country innovative capacity. This hypothesis was supported, since lower power distance countries were found to have higher innovative capacity then those countries with lower scores. This may suggest that hierarchical societies have less freedom of initiative and communication necessary for collaborative efforts and produce fewer innovations. These results are in line with Hypothesis 3, since the human resources qualifications are relevant for innovation, namely, the level of doctoral graduates in S&E and SSH were higher in more innovative countries, when compared with lesser innovative ones.
We found also evidence to support Hypothesis 4,which related innovation to the financing solutions used, since the level of business R&D financing is much higher in countries with better innovative performance indicators. The entrepreneurial efforts to develop in-house R&D and finance innovation in non-R&D activities were also a feature of the more innovative countries, together with the importance of collaboration among firms, thus, in accordance with Hypothesis 5. The practical implications of this study suggest that to stimulate their innovative capacity, countries need a constant commitment to, and active involvement in, their institutions and organizations, the investment in education and qualification, values of openness and commitment to invest and collaborate. This study presents some limitations to the comprehension of the micro mechanisms, which create innovation: a more detailed analysis of the effectiveness of several national innovative strategies. These limitations arise as a pathway for future research and appear to be of great interest to the embodiment of indicators about national and regional innovative strategy. This paper can be developed by enlarging the sample and considering other countries, such as the US and Japan, given their history regarding the innovative capacity. Another field of future research could address the inclusion of micro level variables, to measure the real leveraging of firms present in countries with more innovative capacity. Our future studies will begin to tackle these challenges.
R
EFERENCESR
ÉFÉRENCESR
EFERENCIAS1. Archibugi, D and Pianta, M (1996). Innovation surveys and patents as technology indicators: the
Technological Strategies, OECD, pp.17-56. Paris. 2. Archibugi, D and Pianta, M (2009).
Innovationperformances in Europe: a long term perspective. In Pro Inno Europe, Inno Metrics, March, European Commission Report.
3. Archibugi, D and Coco, A (2005).
Measuring technological capabilities at the country level: a survey and menu for choice. Research Policy, 34, 175194.
4. Arundel, A. and Hollanders, H. (2007). Differences in socio-economic conditions and regulatory environment: explaining variations in national innovation performance and policy implications. Inno-Metrics, Thematic Paper.
5. Asheim, BT and Coenen, L, (2006). Contextualising regional innovation systems in a globalising learning economy: on knowledge bases and institutional frameworks, Journal of Technology Transfer, 31(1), 163-173.
6. Belderbos, R; Carree, M and Lokshin, B (2004). Cooperative R&D and firm performance. Research Policy, 33, 1477-1472.
7. Belitz, H; Clemens, M; Schmidt-Ehmcke and Jens Werwatz, A (2008). Deficits in education endanger Germany’s innovative capacity. DIW Berlin, 14(4), 86-93. German Institute for Economic Research.
8. Bogliacino, F and Pianta, M (2009). Innovation performances in Europe: a long term perspective. Pro Inno Europe (Inno Metrics).
9. Bramanti, A(1999). From space to territory: relational development and territorial competitiveness, Revue d’Economie Régionale et Urbaine, 3, 633-654.
10. Camagni, R and Capello, R (2005). ICTs and territorial competitiveness in the era of internet. The Annals of Regional Science, 39, 421-438.
11. Camelo-Ordaz, C; Hernandéz-Lara, A and Valle-Cabrera, R (2005). The relationship between top management teams and innovative capacity in companies. Journal of Management Development, 24(7/8), 683-705.
12. Castells, M and Hall, P (1994). Technopoles of the World: The Making of The 21st Century Industrial Complexes, London: Routledge.
13. Davenport, T and Prusak,
L (1998).
WorkingKnowledge: How Organizations Manage What They Know. Boston: Harvard Business School press.
14. Doloreux, D (2004). Regional innovation systems in Canada: a comparative study. Regional Studies, 8(5) 481-494.
15. Dunning, J (1998). Location and the multinational enterprise: a neglected factors? Journal of International Business Studies, 25(1), 39-73.
state of the art. In OECD, Innovation, Patents and
16. Edquist, C (1997). Systems of Innovation: Technologies, Institutions and Organizations.
Global Journal of Management and Business Research Volume XI Issue XI Version I November 2011
1 76
London and Washington: Pinter.
17. Evans, P and Rauch, J (1999). Bureaucracy and growth: a cross - national analysis of the effects of "Weberian" state structures on economic growth. American Sociological Review, 64, 748-765.
18. Fan, P (2008). Innovation Capacity and Economic Development: China and India. UNI-Wider, Research Paper nº 2008/31, March.
19. Freeman, C(1995). The national systems of innovation in a historic perspective. Cambridge Journal of Economics, vol.18, 5-24.
20. Furman, JL; Porter, ME and Stern, S (2002). The determinants of
national innovative capacity. Research Policy, 31, 899-993.
21. Ganzaroli, A; Fiscato, G and Pilote, L (2006). Does business succession enhance firms’ Innovation capacity? Results from an exploratory analysis in Italian SMES. Working Paper n. 2006-29, Università degli Studi di Milano, Ottobre.
22. Griliches, Z (1990). Patent statistics as economic indicators: a survey. Journal of Economic Literature, 25, 1661-1707.
23. Henttonen, K. (2006). Innovation in Complex Networks - the State -of—the-Art and propositions for Further Research. In "The innovation Pressure, International ProAct-Conference". Tampere, Finland, 15-17 March. 24. Hofstede, G (1987). Culture and Organizations:
Software of the Mind. United Kingdom: McGraw-Hill. Hollanders, H and van Cruysen A (2008). Rethinking the European Innovation Scoreboard: Recommendations for further improvements. In workshop on ‘Improving the European Innovation Scoreboard methodology, Brussels, June.
25. Howells, J (2005). Innovation and regional economic development: a matter of perspective? Research Policy, 34, 1220-1234.
26. Hu, M-C and Mathews, JA. (2005). Innovative capacity in East Asia. Research Policy, 34(9), 1322-1349.
27. Hu, M-C and Mathews, JA. (2008). China’s national innovative capacity. Research Policy, 37, 1465-1479.
28. Huang, H-C and Shih, H-Yu (2009).
National innovative capacity in the international technology diffusion: the perspective of network contagion effects. In Proc. PICMET 2009, Portland: Oregon USA. Jaumotte, F (2006). Maintaining Switzerland’s Top Innovation Capacity. OECD ECO/WKP. 15 (487).
29. Kaufmann, D; Kraay, A and Mastruzzi, M (2008). Governance Matters VII: Aggregate and Individual Governance Indicators, 1996-2007. World Bank Policy Research Working Paper No. 4654, June.
31. Landabaso, M (1997). The promotion of innovation in regional policy: proposals for a regional innovation strategy. Entrepreneurship & Regional Development, 9 (1), 1-24.
32. Laranja, M (2001). Que politicas de ciência e tecnologia para uma nova economia do conhecimento e da inovação em Portugal? In Actas IV Conferência sobre Economia Portuguesa Como está a Economia Portuguesa, CISEP.
33. Lorenz, E (2005). Developing indicators for skills and innovation. In TrandChart Policy Workshop on Skills for Innovation.
34. Lundval, BA; Patarapong, I and Vang, J (eds.) (2006). Asia’s Innovation Systems in Transition. Cheltenham: Edward Elgar.
35. Lundvall BA and Johnson, B (1994). The learningeconomy. Journal of industry Studies, vol 1. 23-42.
36. Lundvall, BA. (ed.) (1992). National Systems of Innovation: Towards a Theory of Innovation and Interactive Learning. London: Pinter Publishers. 37. Mathews, JA, Hu, M-C (2007). Enhancing the role of
universities in building national innovative capacity in East Asia: the case of Taiwan. World Development 35(6), 1005-1020.
38. Natário, M; Couto, J; Tiago, T and Braga, A (2007), Determinants of the National Innovative Capacity: An Analysis to the European Reality. In Proc. 5th International Symposium on Management of
Managing Total Innovation and Open Innovation in the 21st Century, Chen, J; Xu Q and Wu X (eds.) pp. 211-214. Hangzhou: China. 39. Neely, A and Hii, J (1999). The Innovative Capacity
of Firms. University of Cambridge, Centre for Business Performance, Judge Institute of Management Studies. Nelson, R (ed.) (1993). National Systems of Innovation: a Comparative Study, Oxford: University Press.
40. OECD (1997). National Innovation System. Paris: OECD Publications.
41. OECD (2000). Perspectives de L’OCDE de la Science, de la
Technologie et L’Industrie 2000.[www.ocde.org/dsti/sti].
42. PNUD (2001). Relatório de Desenvolvimento Humano 2001. Nova Iorque: Oxford University Press.
43. Pontikakis, D; McDonnell, T and Geoghegan, W (2005). Conceptualising a National Innovation System: Actor, Roles and Incentives. CISC Working Paper, 16. Porter, M (1990). The Competitive Advantage ofNations. New Work: Free Press.
44. Porter, M (1998). The Competitive Advantage of Nations: with a new introduction by the author. London: Macmillan Business.
30. Kogut, B and Singh, H (1988). The effect of national culture on the choice of the entry mode. Journal of
International Business Studies, 19, 411-432.
45. Porter, M and Stern, S (1999). The New Challenge to America’s Prosperity: Finding from the
Global Journal of Management and Business Research Volume XI Issue XI Version I November 2011
1 77
Innovation Index. Council on Competitiveness, Washington, D.C., March.
46. Ridel, M and Schwer, RK (2003). Regional innovative capacity with endogenous employment: empirical evidence from the U.S. The Review of Regional Studies, 33(1), 73-84. 47. Romer, P (1990). Endogenous technological
change. Journal of Political Economy, 98, S71-S102. Ronen, S and Shenkar, O (1985). Clustering countries on attitudinal dimensions: a review and synthesis. Academy of Management Review, 10(3), 435. Schiuma, G and Lerro, A (2008). Knowledge based capital in building regional innovation capacity.
Journal of Knowledge Management, 12(5), 121-136.
48. Schneider, S and Barsoux, J-L, (1997). Managing Across Cultures. New York: Prentice Hall.
49. Simões VC (2008). Improving innovation scoreboards: Finding a way forward. In IV Symposium COTEC Europe, Naples.
50. Smith K (2005). Measuring Innovation. In The Oxford Handbook of Innovation, Fagerberg, J; Mowery, D and Nelson, R (Eds.), pp. 148-179. Oxford, OxfordUniversity Press.
51. Stern, S; Porter, ME and Furman, JL (2001). The determinants of national innovative capacity. In MIT Industrial Performance Seminar, Industry, Paper 00-034,Canada, July 27.
52. Suarez-Villa, L (1990). Invention, inventive learning and innovative capacity. Behavioral Science, 35(4), 290-310.
53. Suarez-Villa, L (1997). Innovative capacity, infrastructure and regional inversion: is there a long-term dynamic? In Innovative Behavior in Space and Time, Bertuglia CS; Lombardo S and Nijkamp P (eds.) pp.291-305. Berlin, Heidelberg and New York: Springer-Verlag.
54. Suarez-Villa, L (2003). Innovative Capacity, Networks and the rise of Experimental Firm: Implications for Regional Development and Policy. In International Workshop on Modern Entrepreneurship, Regional Development and Policy: Dynamic and Evolutionary Perspectives, Amsterdam: Tinbergen Institute.
55. Trajtenberg, M (1990). Patents as indicators of innovation, Economic Analysis of Product Innovation. Cambridge, MA: Harvard University Press.
56. Trippl, M (2006). Cross-Border Regional Innovation Systems. [http://epub.wu-wien.ac.at].
57. Vang-Lauridsen, J; Coenen, L; Chaminade, C and Asheim, B (2007). Universities, regional innovation systems and the Bangalore experience: towards a contextual and evolutionary perspective. In Proc. 5th International Symposium
Century, Chen, J; Xu Q and Wu X (eds.) pp. 884-888. Hangzhou: China.
58. Vang-Lauridsen, J and Chaminade, C (2006). Globalisation of Knowledge Production and Regional Innovation Policy: Supporting Specialized Hubs in Developing Countries. Circle Electronic Working Paper15.
59. Von Stamm, B (2005). Managing Innovation, Design & Creativity. England: John Wiley &Sons Ltd.
60. Winter SG (1987). Knowledge and competence as strategic assets. In The Competitive Challenge: Strategies for Industrial Innovation and Renewal, D. Teece (ed) pp.159-184. Ballinger: Cambridge, MA.
A
PPENDIX.Table 1a. Countries in the sample EU EU BE Belgium BG Bulgaria CZ Czech Republic DK Denmark DE Germany EE Estonia IE Ireland EL Greece ES Spain FR France IT Italy CY Cyprus LV Latvia LT Lithuania LU Luxembourg HU Hungary MT Malta NL Netherlands AT Austria PL Poland PT Portugal RO Romania SI Slovenia SK Slovakia FI Finland SE Sweden UK United Kingdom HR Croatia TR Turkey IS Iceland NO Norway CH Switzerland RS Serbia
on Management of Technology,- Managing Total Innovation and Open Innovation in the 21st
Global Journal of Management and Business Research Volume XI Issue XI Version I November 2011
1 78