1
A Work Project, presented as part of the requirements for the Award of a Masters Degree in Finance from the Faculdade de Economia da Universidade Nova de Lisboa.
VALUE RELEVANCE OF FINANCIAL ASSETS
Diana Monteiro Gomes, nº 85
A Project carried out on the Finance course, with the supervision of: Cláudio Pais
2
VALUE RELEVANCE OF FINANCIAL ASSETS
ABSTRACT
This study’s proposal is to examine for the Portuguese market, the value relevance of unrealized fair value gains and losses of financial assets, namely for financial
instruments at fair value through profit and loss (which includes held-for-trading
securities) and for available-for-sale financial assets. The objective is to obtain a perception of how well stock prices and returns reflect the fair value changes of these two financial assets. For a sample of Portuguese listed companies in a 2005-2007 period, no significant evidence is found regarding the value relevance of both
cumulative and incremental unrealized fair value gains and losses associated to the two
analyzed financial instruments. Several underlying factors for these results are presented, based on prior research.
KEYWORDS: Value relevance, Fair value accounting, Financial instruments, Unrealized
3 1. INTRODUCTION
This study investigates for the Portuguese market, the value relevance of unrealized gains and losses associated to fair value changes of two types of financial assets:
available-for-sale financial assets and financial instruments at fair value through profit and losses (henceforth, financial instruments through P&L), which includes securities
designated as held-for-trading.
An accounting amount is considered to be value relevant if the amount is simultaneously relevant and reliable, i.e., the accounting amount reflects relevant information that affects investors’ investment decisions and simultaneously is measured reliably enough so that it is reflected in share prices (Barth, 2000).
Fair value accounting has been subject to an extensively debate. Supporters of fair value accounting claim that fair value provides a more reliable and relevant measure of a firm’s assets, liabilities and earnings than historical cost, once it is composed by market-based information. In fact, several articles support this idea (e.g. Khurana and Kim, 2003). On the other hand, opponents (e.g. Bernard et al., 1995) claim that fair value measurement is subjective and contain estimation error, once not all market data is available and estimates are needed. Even further, they defend that fair value accounting induces additional volatility in earnings and capital measures that does not reliable reflect underlying economic volatility, leading investors to inefficient valuation decisions. Some empirical findings support the volatility increase associated to fair value accounting (e.g. Bernard et al., 1995; Hodder et al., 2006).1
1 Bernard et al. (1995) found for a sample of Danish banks that, on average, return on equity (ROE)
calculated on a fair value basis is more variable than ROE calculated on a historical cost basis. Hodder et al. (2006), in the light of Financial Accounting Standards Board (FASB) and IASB long-term objective to recognize all financial instruments at fair value, found for a sample of 202 U.S. commercial banks from 1996 to 2004, that the volatility of a “full fair value income” (measure of income that includes unrealized
4
This study assessment relies over the unrealized fair value gains and losses of available-for-sale financial assets and financial instruments through P&L. These gains and losses are associated to fair value changes, which consist of holding gains and losses for detaining a financial instrument at fair value. In this way, this study intent to verify if these fair value changes is reflected in the firms’ share prices. A price regression is used to assess whether cumulative unrealized fair value gains and losses are value relevant. However, to assess whether incremental unrealized fair value gains and losses are value relevant, it was regressed alternatively a return equation. This study’s findings indicate no significant evidence regarding both cumulative and incremental unrealized gains and losses of both financial instruments. Several factors could be underlying these results: on one hand, measurement error has been pointed out in prior research as one of the main contributors for the difficulty of establishing value relevance for financial instruments; on the other hand, other recognized financial assets and liabilities used within hedge accounting could be offsetting the fair value gains and losses of both analyzed financial assets (correlated omitted variables). Another possible factor could be related to the fact that this study’s sample is mainly composed by non-financial firms (82% of the sample’s observations), which could be driving these results once financial activities are not part of these firms’ core businesses. However, further analysis would be required to determine which of these factors underlies this research’s results, which falls out of this study’s scope.
This study’s research question is motivated in part by the recent events that are changing the Portuguese accounting structure. In fact, with the 1606/2002 EU Regulation, since 2005 all listed companies in Europe are required to report their
fair value gains and losses of all financial instruments into the income statement) is five times greater than net income volatility, and three times greater that of comprehensive net income.
5
consolidated financial statements accordingly to International Accounting Standards/International Financial Accounting Standards (IAS/IFRS), issued by the International Accounting Standard Board (IASB). Consequently and in the specific case of the Portuguese listed companies, the historical cost accounting principle presented in the Portuguese Official Accounting Plan (henceforth, POC) was replaced by the fair value accounting principle in the measurement of some financial assets and liabilities. For financial assets in particular, dramatic changes were introduced, once POC was largely evasive regarding the recognition and measurement of financial instruments. More, in 2010 a new set of Portuguese accounting standards – “Sistema de
Normalização Contabilistica” (SNC) – is expected to become effective. These new
accounting standards, based in IAS/IFRS, intend to revoke the actual POC and apply fair value measurement to some financial assets and liabilities. In this way, in 2010 and afterwards, the fair value measurement will be required to some financial assets and liabilities, not only to listed companies but to all Portuguese companies, enlarging the need for a value relevance study regarding financial assets in the Portuguese market.
Prior research also constitutes a motivation for this study’s research question. Studies regarding the value relevance of financial instruments’ fair value have presented conflicting results, and do not provide direct insight into differential value relevance of unrealized fair value gains and losses by financial assets category. In this way, this study not only contributes to the extent fair value literature, but also expands prior research by regarding the value relevance of fair value unrealized gains and losses by financial instruments type.
This study proceeds as follow: section 2 presents a literature review over prior research, as also an institutional background regarding the accounting standards in
6
which this study is based. Section 3 sets forth the estimating equations and section 4 presents related empirical findings, as also sample’s descriptive statistics. Section 5 presents this study’s conclusions.
2. LITERATURE REVIEW
2.1. Institutional background
The IASB provides three accounting standards regarding the fair value accounting for financial instruments: International Accounting Standard (IAS) 32 – Financial
Instruments: Presentation (IASB, 2000); IAS 39 – Financial Instruments: Recognition and Measurement (IASB, 2000) and International Financial Reporting Standard (IFRS)
7 – Financial Instruments: Disclosures (IASB, 2005).2
IAS 32 is considered as the precedent of fair value measurement for financial instruments, once it requires to all financial instruments (either recognized or unrecognized in the statement of financial position) the disclosure of its related fair value information (Lopes et al., 2004). IFRS 7 reinforces IAS 32 fair value disclosure requirements, and simultaneously requires additional qualitative disclosures, such as information related to risk exposure and risk management arising from financial instruments, as also information related to the financial instrument’s role in the firm’s financial position and performance.
IAS 39 states the recognition of all financial assets and liabilities into the statement of financial position. This standard defines four types of financial instruments: (1)
2 The corresponding accounting standards regarding the fair value accounting for financial instruments in
the United States are: Statement of Financial Accounting Standard (SFAS) 107 – Disclosures about Fair Value of Financial Instruments (FASB, 1991) and SFAS 119 – Disclosure about Derivative Financial Instruments and Fair Value of Financial Instruments (FASB, 1994) both requiring the fair value estimate disclosures for all financial instruments; SFAS 115 – Accounting for Certain Investment in Debt and Equity Securities (FASB, 1993) and SFAS 133 – Accounting for Derivative Instruments and Hedging Activities (FASB, 1998) both requiring the fair value recognition in the financial statements.
7
to-maturity investments; (2) loans and receivables; (3) financial assets or liabilities at fair value through profit and losses (FVTPL), which is subdivided into held-for-trading securities and financial instruments designated by the entity as at fair value through profit and losses upon its initial recognition. For summary purposes, this category in this study is mentioned as financial instruments at P&L; and (4) available-for-sale financial assets (AFS). While the two former financial instruments are recognized at amortized cost (out of this study’s scope), the two latter are recognized at fair value and constitutes this study’s focus.
Fair value is defined as being “the amount for which an asset could be exchanged,
or a liability settled, between knowledgeable, willing parties in an arm’s length transaction” (IAS 39, paragraph 9). Further, it is defined in IAS 39 gains and losses
associated to fair value changes (unrealized gains and losses) and gains and losses associated with the securities’ disposal. When financial assets are sold, the gain or loss associate with the financial instrument’s disposal (realized gain or loss) must be recognized in the income statement, in the accounting period in which it occurred. However, until the disposal of financial assets, gains and losses arising from changes in the fair value exist. These unrealized gains and losses (which consist of holding gains and losses for detaining a financial instrument at fair value) must also be recognized in the financial statements at every fiscal year-end, accordingly to the financial asset category. For financial instruments at P&L (FVTPL) these gains and losses shall be recognize in the income statement, whereas for available-for-sale financial assets (AFS) these shall be recognize in other comprehensive income (equity reserve). This study exploits these unrealized gains and losses in order to assess whether a differential value relevance of these gains and losses exist by financial asset category.
8
In the specific case of Portugal, the IAS/IFRS became mandatory accounting standards to all consolidated listed companies from 2005. Regarding non-listed companies, the accounting procedures are based in the Portuguese Official Accounting Plan (POC), where prudence and historical cost are the main accounting principles. Concerning financial instruments, POC differs largely from IAS, as it requires the measurement of financial assets by historical cost, and the recognition of impairment losses when the fair value amount of a financial asset is inferior to its historical cost. Nevertheless, a new set of accounting standards aiming to replace the current POC and complementary legislation, is expected to become effective in 2010 – Sistema de
Normalização Contabilística (SNC). Its accounting standards – Normas Contabilísticas e de Relato Financeiro (NCRF), are based in the structural lines of IAS/IFRS.
Consequently, the new NCRF 27 – Instrumentos Financeiros, approaches the Portuguese legislation of financial instruments accounting to IAS 32/39 and IFRS 7 requirements. In this way and because in a nearby future all Portuguese firms (beyond listed firms) will present their financial instruments at fair value, a value relevance study regarding fair value becomes important in this transitory phase.
2.2. Prior Research
The fair value relevance studies are not recent (e.g. Edwards and Bell, 1961). However, in the past years the empirical research on fair value accounting has been emerging momentously, due to fair value data accessibility with the implementation of accounting standards requiring the fair value disclosure or recognition in the financial statements.
Barth (1994) studies the value relevance of fair value disclosures for all financial instruments as one asset class. For a 1990 U.S. bank sample, she found that aggregated
9
investment securities explain banks’ share prices. However, such evidence was not found for these securities’ aggregated unrealized gains and losses with banks’ annual raw returns. The primary reason presented for the irrelevancy of unrealized gains and losses in this study was the exacerbated presence of measurement error in the fair value estimates. However, another plausible explanation is that investment securities’ fair value gains and losses could be offset by fair value changes of other financial assets or liabilities used in a context of hedge accounting. Contrarily to Barth (1994), Ahmed and Takeda (1995) after controlling for interest-rate sensitivity, found for a 1986-1991 bank sample evidence of a significantly positive association between banks’ annual raw returns and both aggregate realized and unrealized gains and losses of investment securities.3
Three similar studies – Barth et al. (1996); Eccher et al. (1996) and Nelson (1996) – examine the value relevance of fair value disclosures on a 1992-1993 bank sample, for five asset and liability categories: loans, deposits, long-term debt, off-Balance sheet items and investment securities. Barth et al. (1996) found evidence of loans and investment securities’ value relevance. Regarding securities, it is shown that securities’ fair value is positively related with banks’ share prices, but no such relation yield for banks’ annual returns. Eccher et al. (1996), excepting for loans for which was found no evidence, supports Barth et al. (1996)’s findings. Nelson (1996) found no consistent evidence on the relevance of fair value disclosures, over any of the five banks’ assets categories. Regarding solely to derivatives, all three previous studies found no evidence regarding the value relevance of fair value disclosures of off-Balance sheet items
3
Other studies (e.g. Barth et al., 1990; and Barth, 1994) argue that realized gains and losses of investment securities present a negative association with banks returns, signalling that investors perceived reported realized gains and losses as timely and as object of management discretion. In this sense, investment securities’ realized gains and losses are view as earnings smoothing.
10
(derivatives included). However, for a 1993-1994 bank sample, Venkatachalam’s (1996) findings suggest that derivatives’ fair value estimates explain cross-sectional variation in bank shares prices. Ahmed et al. (2006) extends prior findings by providing evidence of fair value relevance solely to derivatives recognized in the financial statements.
Other researches investigate the value relevance by security type. Petroni et al. (1995) investigates for a property-liability insurer’s sample, the relation between equity and fixed maturity debt securities with insurers’ price. They report that fair value of equity securities and U.S. Treasury investments (a subset of debt securities) explain property-liability share prices, over a 1985-1991 period. Park et al. (1999) extents prior research by investigating the value relevance of two financial instruments types, defined accordingly by accounting standards: available-for-sale and held-to-maturity securities. For a 1993-1995 bank sample, they demonstrate that both securities’ value differences (difference between fair value and book value amount) explain bank equity. Although these studies provide a refinement of fair value relevance research by financial asset category, no investigation is made regarding unrealized gains and losses associated to fair value measurement.
Concerning a different sample setting, Simko (1999) verifies to a cross-industrial sample, that aggregated investment securities’ fair value disclosures do not explain firms’ equity values. He attributes this result to the low significance of financial activities in their non-financials’ core businesses. Barth and Clinch (1998) studied for the Australian market the value relevance of aggregate financial instruments. They found that fair value disclosures of financial assets are significantly associated with
11
share prices. However, these studies do not enclose fair value study by regarding fair value unrealized gains and losses.
In summary, prior research evidence mixed results regarding the value relevance of financial instruments’ fair value. The majority of existent studies are concern with the value relevance of financial instruments’ fair value as one asset class, using mainly disclosure information, and examine exclusively financial entities. Therefore, it lacks direct evidence regarding the value relevance of fair value recognized amounts, by financial assets category and regarding solely unrealized gains and losses associated to fair value change. In this way, this study intends to expand existent research on financial instruments fair value relevance, by providing evidence on the Portuguese market, the value relevance of fair value unrealized gains by financial asset type.
3. RESEARCH DESIGN
This section develops a valuation model that provides a cross-sectional relation between firms’ value and the unrealized holding gains and losses associated to financial instruments, namely for available-for-sale securities (AFS) and for financial instruments at P&L (FVTPL). This study’s empirical models are based on the frequently employed Ohlson (1995) model and its subsequent refinement: Feltham and Ohlson (1995).4 This model represents the firm value as a linear function of book value of equity and the present value of expected future abnormal earnings. Essentially, it is expressed in terms of accounting earnings and equity book value, assuming these variables as summary
4 Other valuations models used in accounting research are: the dividend discount model; the permanent
earnings model; and the valuation model expressing the market value of equity as a function of the value of all of the firm’s assets and liabilities. However, nowadays the Ohlson (1995) model is the most employed model and it is considered as the most pervasive valuation model in accounting research (Barth, 2000).
12
measures of information reflected in financial statement as also investors’ consensus beliefs.5
3.1. Price Regression
Assuming the share price as summary measure of information relevant to investors, a price regression (level model) is developed. This regression is defined as the cross-sectional relation between the firm’s share price and its accounting net income, book value of equity and cumulative unrealized gains and losses, as follow:
t i t i t i t i t
i NIPS BVEPS AFSPS
P, 01 , 2 , 3 , , [1]
where P denotes price per share of common stock of firm i at time t; NIPS denotes net income per share of firm i at time t; AFSPS denotes tax liquid available-for-sale cumulative unrealized fair value gains and losses, recognized in other comprehensive income, of firm i at time t, in a per share basis; BVEPS is book value of equity per share, after subtracting the recognized amounts related to AFSPS, for firm i at time t; and µ is the regression error term. This equation is similar to the regressions used in Barth and Clinch (1998), Barth (1994), Ahmed and Takeda (1995) and Petroni et al. (1995).
As previous research (Barth and Clinch (1998); Barth et al. (2001); Venkatachalam (1996); Petroni et al. (1995)), all variables are deflated by the number of shares outstanding in order to mitigate potential scale effects. Also, the use of share price as dependent variable reduced the potential presence of heteroskedasticity error terms.
5 This model is based in three assumptions: (1) the no-intertemporal arbitrage price, which results when
interest rates are non stochastic, beliefs are homogeneous and individuals are risk-neutral; (2) the clean surplus relation, which states that current book value equals previous period’s book value plus income minus dividends; and (3) the linear information dynamic, which defines the stochastic process for abnormal earnings and non-accounting information.
13
The fair value information regarding the financial instruments is not likely to be public until the release of the annual report. Hence, as previous studies (Barth et al. 2001), to ensure that the accounting information is in the public domain, the depend variable P – firm’s share price, corresponds to the share price six months after the fiscal year-end, as of June 30 t+1. All per share data is adjusted to stock splits and stock dividends.
The focus of this study is to test whether the cumulative unrealized gains and losses of Available-for-Sale financial assets provide value relevant information to investors. Hence, the key variable of interest in this regression is AFSPS. It is predicted a positive association of this variable with share price. Similarly, net income and book value of equity are also expected a positive relation with share prices.
3.2. Return Regression
The previous equation allows us to examine whether recognized fair value amounts are reflected in the firm value. However, it does not analyze whether fair value changes are reflected in firm value changes over a specific period, carrying this way the necessity for an alternative approach.
In fact, the price regression associates firm value with cumulative unrealized gains and losses, not allowing the inclusion of unrealized gains and losses associated to the financial instruments through P&L. This security’s unrealized gains and losses are recognized in the income statement in the corresponding accounting period it has occurred, while for available-for-sale securities these gains and losses are accumulated in an equity reserve. In this way, a return regression (level change model) allows us to analyze for both types of financial assets whether the fair value change, or the
14
incremental amounts of unrealized gains and losses, are associated with annual share
returns (firm value change).
More, Easton (1999) considers more reliable using return as the market metric, as it mitigates possible scale effects and correlated omitted variables. Further, using a change specification is possible to analyze the role and the timeliness of accounting values in relation to value changes in the financial statements, contrarily to event studies.6
All in all, and similarly to Barth (1994), to test the incremental securities’ unrealized gains and losses on a timelier basis, a return regression is developed. The return regression is defined as the cross-sectional relation between the firm’s annual share return, its accounting net income and incremental unrealized gains and losses of both financial assets, as follow:
t i t i t i t i t i t
i NIMV NIMV IUAFS IUFVTPL
RT, 01 , 2 , 3 , 4 , , [2]
where RT designates the share price return of firm i at time t. This return is defined as the annual percentage variation of six month after fiscal year-end shares prices, i.e., (Pt –
Pt-1)/Pt-1. IUAFS designates the recognized tax liquid amount associated to
available-for-sale’s incremental unrealized fair value gains and losses, of firm i at time t. IUFVTPL designates the recognized tax liquid amount associated to financial instruments through P&L’s incremental unrealized fair value gains and losses, of firm i at time t. However, the unrealized gain and loss of financial instruments through P&L are recognized in the income statement in an illiquid tax basis (while the available-for-sale is presented in a liquid tax base). Hence, to deduct the tax charge, it was calculate and then deducted the
6 Easton (1999) states: “Studies [in accounting research] (…) provide evidence regarding the role of
accounting data as a summary of events that have affected firms over the reporting period. In contrast, studies of the market response during a very short interval around the time of the announcement of the accounting data [event studies] examine the role of these data in providing information to investors about events that may affect their perceptions of the firm”.
15
effective tax rate of each firm. NIMV (∆NIMV) designates the accounting net income (net income annual variation) after subtracting the tax liquid incremental unrealized gains and losses associated to financial instruments through P&L, of firm i at time t.
is the regression error term.The right-hand variables are all deflated by each firm’s beginning year market value of equity (MVt-1), in order to mitigate scale effects (Christie, 1987). This equation is
similar to the regressions used in Barth and Clinch (1998), Barth (1994), Petroni et al. (1995) and Park et al. (1999).
This regression intends to test whether the incremental amounts of unrealized gains and losses of both financial assets are value relevance. So, the key variables of interest in this regression are IUAFS and IUFVTPL. All variables are expected to present a positive association with share price returns.
4. SAMPLE DATA AND EMPIRICAL RESULTS 4.1. Sample and Descriptive Statistics
The sample is composed by all Portuguese listed companies in Euronext Lisbon, with public and available consolidated financial statements reported accordingly to IAS/IFRS standards, and with a fiscal year-end as of 31st December. On average, 55 holding companies were listed in the sample period. Three companies were eliminated from the sample for presenting a different fiscal year-end from the 31st December. In this way, the sample is composed by 52 firms. Because listed companies only started to apply IAS in their accounting procedures after 2005, the sample period is 2005-2007. The sample data is composed by accounting information which was hand-collected from the firms’ annual reports to shareholders, and also by market information such as the firms’ share price, collected from publicly sources.
16
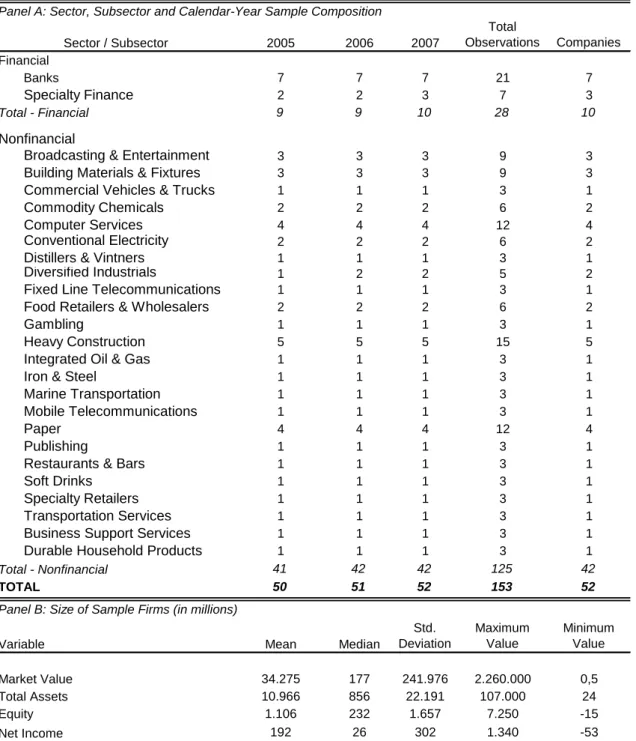
Panel A: Sector, Subsector and Calendar-Year Sample Composition
2005 2006 2007 Total Observations Companies Financial Banks 7 7 7 21 7 Specialty Finance 2 2 3 7 3 Total - Financial 9 9 10 28 10 Nonfinancial
Broadcasting & Entertainment 3 3 3 9 3
Building Materials & Fixtures 3 3 3 9 3
Commercial Vehicles & Trucks 1 1 1 3 1
Commodity Chemicals 2 2 2 6 2
Computer Services 4 4 4 12 4
Conventional Electricity 2 2 2 6 2
Distillers & Vintners 1 1 1 3 1
Diversified Industrials 1 2 2 5 2
Fixed Line Telecommunications 1 1 1 3 1
Food Retailers & Wholesalers 2 2 2 6 2
Gambling 1 1 1 3 1
Heavy Construction 5 5 5 15 5
Integrated Oil & Gas 1 1 1 3 1
Iron & Steel 1 1 1 3 1
Marine Transportation 1 1 1 3 1
Mobile Telecommunications 1 1 1 3 1
Paper 4 4 4 12 4
Publishing 1 1 1 3 1
Restaurants & Bars 1 1 1 3 1
Soft Drinks 1 1 1 3 1
Specialty Retailers 1 1 1 3 1
Transportation Services 1 1 1 3 1
Business Support Services 1 1 1 3 1
Durable Household Products 1 1 1 3 1
Total - Nonfinancial 41 42 42 125 42
TOTAL 50 51 52 153 52
Panel B: Size of Sample Firms (in millions)
Mean Median Std. Deviation Maximum Value Minimum Value Market Value 34.275 177 241.976 2.260.000 0,5 Total Assets 10.966 856 22.191 107.000 24 Equity 1.106 232 1.657 7.250 -15 Net Income 192 26 302 1.340 -53 TABLE 1 Sector / Subsector Variable
Sample Descriptive Statistics of Portuguese Listed Companies from 2005 to 2007
The sample comprises all Portuguese listed companies in Euronext Lisbon from 2005 to 2007, with public and available annual consolidated financial statements reported accordingly to IAS/IFRS, and with fiscal year end at 31st December.
Table 1, Panel A, presents sector, subsector and calendar year breakdowns of the sample firms. It reveals that the non-financial sector dominates the sample, containing 125 of the total 153 observations (82%). In fact, the financial sector contains only 10
17
Variable Mean Median
Std. Deviation Maximum Value Minimum Value Price Regression NIPS 0,754 0,244 2,308 16,541 -4,644 BVEPS 5,655 1,897 13,881 91,447 -3,864 AFSPS 0,183 0,000 0,674 4,084 -1,872 Return Regression NIMV -0,113 0,082 2,967 7,493 -27,575 ∆NIMV 0,018 0,002 0,520 3,872 -1,873 IUFVTPL 0,018 0,000 0,118 1,027 -0,097 IUAFS 0,005 0,000 0,218 1,312 -2,016 NIPS = BVEPS = AFSPS = NIMV = ∆NIMV = IUFVTPL = IUAFS =
Net Income before incremental fair value gains/losses of financial intrusments through profit and losses (FVTPL), of company i at time t , deflated by the company's beginning market value (MVt-1)
Diference between NIt and NIt-1, before incremental fair value gains/losses of
financial intruments through profit and losses, of company i at time t , deflated by the company's beginning market value (MVt-1);
Incremental fair value amount of unrealized gains/losses, associated to financial instruments recognized at fair value through profit and losses (FVTPL), of company i at time t , deflated by the company's begginnig market value (MVt-1);
Incremental fair value amount of unrealized gains/losses, associated to available-for-sale financial instrument (AFS), of company i at time t, deflated by the company's begginnig market value (MVt-1);
TABLE 2
The sample comprises all Portuguese listed companies in Euronext Lisbon from 2005 to 2007, with public and available annual consolidated financial statements reported accordingly to IAS/IFRS, and with fiscal year end at 31st December. Includes 52 companies from 26 sectors.
The Price regression variables are deflated by the outstanding number of shares. The Return regression variables are deflated by the company's beginnig market value (MVt-1).
Book Value of Equity per share, after subtracting the cumulative unrealized gains and losses of available-for-sale financial instruments (AFS), of company i at time t;
Cumulative unrealized gains and losses of available-for-sale financial instrument, of company i at time t , deflated by the number of shares; Net Income of firm i at time t, deflated by the number of shares;
Descriptive Statistics for Regression Variables: 2005-2007
companies, providing a total of 28 observations. It is possible to conclude immediately that a value relevance study relying only to the financial industry, as prior research, would not be feasible. Within the non-financial sector, heavy construction is the dominant subsector, with 5 companies listed and 15 observations obtained in total.
18
Also, paper and computer services subsectors present a significant contributor, each with 12 observations provided in total. Appendix 1 presents firm breakdown by sector. Table 1, Panel B, reveals for the Portuguese market the descriptive statistics for the main accounting variables. It presents high variations for total assets and market capitalization, demonstrating the disperse size and nature of Portuguese listed companies. In fact, the market capitalization for this sample period ranges from € 0,5 millions to € 2,26 billions.
Table 2 presents descriptive statistics for the regression variables of equation [1] deflated by the number of shares outstanding, and equation [2] variables deflated by the beginning market value. It reveals that mean (median) of NIPS is 0,75 (0,24). However,
NIMV presents a negative mean of -0,11 and a smaller median (0,08). As presented in
Table 1, panel B, market capitalization presents a high variation, increasing similarly the variation of NIMV. The cumulative unrealized gains and losses of available-for-sale financial asset presents a zero median and a 0,18 mean. Regarding the incremental unrealized gains and losses of both securities, it is presented a zero median and a very close zero mean for both financial assets. This points out that in the sample period, the holding gains and losses have been conflicting between positive and negative fair value valuations, which could reflect the underlying market’s volatility.
4.2. Empirical results
Table 3 presents summary statistics from estimating equations [1] and [2]. The coefficients are adjusted to White (1980) Heteroskedasticity-consistent standard errors and covariance.
Observing the price regression findings in Table 3, with a 30% adjusted R2, NIPS and BVEPS present, as expected, a significant positive relation with share price,
19
Panel A: Price Regression
Variable Coeffcient Std. Error t-statistic Intercept 4,134 0,421 0,000 * NIPS 0,884 0,410 0,033 * BVEPS 0,186 0,092 0,045 * AFSPS -0,920 0,907 0,312 Adjusted R2 0,296 F-statistic 0,000 N 142
Panel B: Return Regression
Variable Coeffcient Std. Error t-statistic Intercept -0,161 0,040 0,000 * NIMV 1,874 0,138 0,000 * ∆NIMV 2,967 0,627 0,000 * IUPL 4,708 3,971 0,239 IUAFS 2,369 3,229 0,465 Adjusted R2 0,744 F-statistic 0,000 N 108 NIPS = BVEPS = AFSPS = NIMV = ∆NIMV = IUFVTPL = IUAFS = TABLE 3
The sample comprises all Portuguese listed companies in Euronext Lisbon from 2005 to 2007, with public and available annual consolidated financial statements reported accordingly to IAS/IFRS, and with fiscal year end at 31st December. Includes 52 companies from 26 sectors.
The Price regression variables are deflated by the outstanding number of shares. The Return regression variables are deflated by the company's beginnig market value (MVt-1).
All coefficients are robust, with White (1980) Heteroskedasticity-Consistent Standard Errors and Covariance.
Diference between NIt and NIt-1, before incremental fair value gains/losses of
financial intruments through profit and losses, of company i at time t , deflated by the company's beginning market value (MVt-1);
Incremental fair value amount of unrealized gains/losses, associated to financial instruments recognized at fair value through profit and losses (FVTPL), of company i at time t , deflated by the company's begginnig market value (MVt-1);
Cumulative unrealized gains and losses of available-for-sale financial instrument, of company i at time t , deflated by the number of shares;
Net Income before incremental fair value gains/losses of financial intrusments through profit and losses (FVTPL), of company i at time t , deflated by the company's beginning market value (MVt-1)
Incremental fair value amount of unrealized gains/losses, associated to available-for-sale financial instrument (AFS), of company i at time t, deflated by the company's begginnig market value (MVt-1);
Summary Statistics from Regressions associating Price and Returns with unrealized gains/losses of available-for-sale financial instruments and financial instruments at fair
value through profit and losses: 2005-2007
Net Income of firm i at time t, deflated by the number of shares;
Book Value of Equity per share, after subtracting the cumulative unrealized gains and losses of available-for-sale financial instruments (AFS), of company i at time t;
* indicates significantly different from zero at the 5% level (one-sided).
t i t i t i t i t
i NIPS BVEPS AFSPS
P, 0 1 , 2 , 3 , , t i t i t i t i t i t
i NIMV NIMV IUFVTPL IUAFS
20
presenting coefficients (p-values) of 0,88 (0,03) and 0,18 (0,04), respectively. However, regarding to cumulated unrealized gains and losses of available-for-sale financial assets
(AFSPS) no significant evidence is found in relation to share prices. In a similar way, in
the return regression with a 74% adjusted R2, the incremental unrealized gains and losses of both securities types (IUFVTPL and IUAFS) present no explanatory power in its cross-sectional relation with firm’s share return. As expected, NIMV and ∆NIMV present a significantly positive relation with share returns, with coefficients (p-values) of 1,87 (0,00) and 2,97 (0,00) respectively. In this way, it is not possible to conclude significantly whether fair value amounts and fair value changes, associated to unrealized gains and losses, affect firms’ value and firms’ value changes.
All in all, evidence of value relevant information to investors, is solely provided by net income and book value of equity variables. The lack of evidence on the two financial instruments’ unrealized fair value gains or losses, either cumulative or incremental, is consistent in general with Barth (1994) and Nelson (1996) findings. In prior research, some explanations have been attributed to this type of results. Measurement error is pointed out as one of the main factors making annual fair value gains and losses difficult to establish value relevance. Measurement error is defined as the difference between economic amount and the related accounting amount (Barth et
al., 2001), and it occurs when the fair value amount of an asset is not accessible. In fact,
not all financial instruments detain a quoted price in an active market, and for some specific financial instruments estimates are required in order to determinate its fair value. However, if the error in estimating fair value is too large from the underlying economic amount, the value relevance of fair value disappears.
21
Another plausible explanation is the potential presence of correlated fair value gains and losses of other recognized financial assets or liabilities, which offset the fair value gains and losses of both analyzed financial assets (correlated omitted variables). This could be the case of hedging instruments, which in some cases have the same accounting treatment as the two financial instruments examined in this research.
Another possible factor could be related to the fact that this study’s sample is manly composed by non-financial firms. Simko (1999) for a non-financial sample finds no significant evidence regarding the value relevance of financial instruments’ fair value, which he attributes to the insignificance of financial activities for this type of firms. Hence, the high fraction of non-financial firms in this study’s sample could be determining this study’s results.
Further analysis would be required to determine which of these factors underlies the lack of evidence for this sample’s unrealized fair value gains and losses.
5. CONCLUSIONS
This study assesses for the Portuguese market, the value relevance of both
cumulative and incremental unrealized fair value gains and losses associated to
available-for-sale financial assets and financial instruments through P&L. Previous research regarding the value relevance of financial instruments’ fair value has presented conflicting results, and does not provide direct insight into differential value relevance of unrealized fair value gains and losses by financial assets category. In this way, this study expands existent research by assessing the value relevance of fair value unrealized gains and losses by financial instruments type.
Using share prices as summary measure of relevant information to investors, a price and return regressions were used to determine the cross-sectional relation between
22
firms’ share prices and returns with book value of equity, net income, annual variation of net income and both cumulative and incremental unrealized fair value gains and losses of the two analyzed financial instruments. Findings indicate as expected, a positive association between firms’ share prices and returns with net income, annual variation of net income and book value of equity. However, no significant evidence was found for both the cumulative and incremental unrealized fair value gains and losses of available-for-sale financial assets and financial instruments through P&L.
Three possible factors were indicated for these results: (1) the presence of measurement error in fair value estimates, which could be contributing to the difficulty of establishing value relevance on financial instruments’ fair value amounts; (2) the possible existence of correlated omitted variables, associated to hedge accounting; and (3) the sample is mainly composed by non-financial firms, which could be driving these results once financial activities do not belong to these firms’ core businesses. However, which of these factors determines the lack of evidence on the value relevance of unrealized fair value gains and losses, is a subject for further research.
23 REFERENCES
Ahmed, Anwer and Takeda, Carolyn. 1995. “Stock market valuation of gains and losses on commercial banks’ investment securities: An empirical analysis”. Journal of
Accounting and Economics, 20: 207-225.
Ahmed, Anwer., Kilic, Emre and Lobo, Gerald. 2006. “Does Recognition versus Disclosure Matter? Evidence from Value-Relevance of Banks’ Recognized and Disclosed Derivative Financial Instruments”. The Accoutning Review, 81(3): 567-588.
Barth, Mary. 2000. “Valuation-based accounting research: Implications for financial reporting and opportunities for future research”. Accounting and Finance, 40: 7-31. Barth, Mary., Beaver, William and Wolfson, Mark. 1990. “Components of Earnings and
the Structure of Bank Share Prices”. Financial Analysis Journal, XX: 53-60.
Barth, Mary., Beaver, William and Landsman, Wayne. 1996. “Value-Relevance of Banks’ Fair Value Disclosures under SFAS No.107”. The Accounting Review, 71(4): 513-537.
Barth, Mary., Beaver, William and Landsman, Wayne. 2001. “The Relevance of the Value Relevance Literature for Financial Accounting Standard Setting: Another View”. Journal of Accounting and Economics, 31: 77-104.
Barth, Mary and Clinch, Greg. 1998. “Revalued Financial, Tangible, and Intangible Assets: Associations with Share Prices and Non-Market-Based Value Estimates”.
Journal of Accounting Research, 36: 199-233.
Barth, Mary. 1994. “Fair Value Accounting: Evidence from Investment Securities and the Market Valuation of Banks”. The Accounting Review, 69(1): 1-25.
24
Bernard, Victor., Merton, Robert and Palepu, Krishna. 1995. “Mark-toMarket Accouting for Banks and Thrifts: lessons from the Danish Experience”. Journal of
Accounting Research, 33(1): 1-32.
Christie, Andrew. 1987. “On Cross-Sectional Analysis in Accounting Research”.
Journal of Accounting and Economics, 9(3): 231-258.
Easton, Peter. 1999. “Security Returns and the Value Relevance of Accounting Data”.
Accounting Horizons, 13(4): 399-412.
Eccher, Elizabeth., Ramesh, K. and Thiagarajan, S. 1996. “Fair value disclosures by bank holding companies”. Journal of Accounting and Economics, 22: 79-117.
Edwards, E. and Bell, P. 1961. The theory and Measurement of Business Income. Berkeley: University of California Press.
Financial Accounting Standards Board. 1991. Statement of Financial Accounting Standards 107 “Disclosures about Fair Value of Financial Instruments”. Norwalk, Connecticut.
Financial Accounting Standards Board. 1993. Statement of Financial Accounting Standards 115 “Accounting for Certain Investments in Debt and Equity Securities”. Norwalk, Connecticut.
Financial Accounting Standards Board. 1994. Statement of Financial Accounting Standards 119 “Disclosure about Derivative Financial Instruments and Fair Value of Financial Instruments”. Norwalk, Connecticut.
Financial Accounting Standards Board. 1998. Statement of Financial Accounting Standards 119 “Accounting for Derivative Instruments and Hedging Activities”. Norwalk, Connecticut.
25
Feltham, G. and Ohlson, J. 1995. “Valuation and clean surplus accounting for operating and financial activities”. Contemporary Accounting Review, 11: 689-732.
Hodder, Leslie., Hopkins, Patrick and Wahlen, James. 2006. “Risk-Relevance of Fair-Value Income Measures for Commercial Banks”. The Accounting Review, 81(2): 337-375.
International Accounting Standards Board. 2000. International Accounting Standard 32 “Financial Instruments: Presentation”. London.
International Accounting Standards Board. 2000. International Accounting Standard 39 “Financial Instruments: Recognition and Measurement”. London.
International Accounting Standards Board. 2005. International Financial Reporting Standard 7 “Financial Instruments: Disclosures”. London.
Khurana, Inder and Kim, Myung-Sun. 2003. “Relative value relevance of historical cost vs. fair value: Evidence from bank holding companies”. Journal of Accounting and
Public Policy, 22: 19-42.
Lopes, Patricia and Rodrigues, Lúcia. 2004. “Accounting Practices for Financial Instruments. How far are Portuguese companies from IAS?”. FEP Working Papers 150, Universidade do Porto, Faculdade de Economia do Porto.
Nelson, Karen. 1996. “Fair Value Accounting for Commercial Banks: An Empirical Analysis of SFAS No. 107”. The Accounting Review, 71(2): 161-182.
Ohlson, Jim. 1995. “Earnings, book values and dividends in security valuation”.
Contemporary Accounting Research, 11: 661-687.
Park, Myung., Park, Taewoo and Ro, Byung. 1999. “Fair Value Disclosures for Investment Securities and Bank Equity: Evidence from SFAS No. 115”. Journal of
26
Petroni, Kathy and Wahlen, James. 1995. “Fair Values of Equity and Debt Securities and Share Prices of Property-Liability Insurers”. The Journal of Risk and Insurance, 62(4): 719-737.
Simko, Paul. 1999. “Financial Instruments Fair Values and Nonfinancial Firms”.
Journal of Accounting, Auditing and Finance, 14(1): 247-274.
Venkatachalam, Mohan. 1996. “Value Relevance of banks’ derivatives disclosures”.
Journal of Accounting and Economics, 22: 327-355.
White, H. 1980. “A heteroscedasticity-consistent covariance matrix estimator and a direct test for heteroscedasticity”. Econometrica, 48: 817-838.
27
Panel C: Sector, Company and Calendar-Year Sample Composition
Total Observations Financial B.COM.PORTUGUES 3 B.ESPIRITO SANTO 3 BANCO BPI 3 BANCO POP.ESPANOL 3 BANCO SANTANDER 3 BANIF - SGPS 3
ESPIRITO SANTO FIN.NOM, SGPS (PT) 3 ESPIRITO SANTO FINANCIAL GROUP 3
FINIBANCO HOLDING, SGPS 3 SONAE CAPITAL 1 Total - Financial 28 Nonfinancial ALTRI SGPS 2 BRISA 3 CIMPOR,SGPS 3 CIRES 3 COFINA,SGPS 3 COMPTA 3 CORTICEIRA AMORIM 3 EDP 3 ESTORIL SOL, SGPS 3 EUROPAC 3 F.RAMADA-INVESTIMENTOS, SGPS 3 FISIPE 3 GALP ENERGIA,SGPS 3 GLINTT 3 IBERSOL,SGPS 3
IMOB.C GRAO PARA 3
IMPRESA,SGPS 3 INAPA-INV.P.GESTAO 3 J.MARTINS,SGPS 3 LISGRAFICA 3 MARTIFER 3 MEDIA CAPITAL 3 MOTA ENGIL 3 NOVABASE,SGPS 3
OREY ANTUNES ESC. 3
P.TELECOM 3 PAP.FERNANDES 3 PORTUCEL 3 REDITUS,SGPS 3 REN 3 S.COSTA 3 SACYR VALLEHERMOSO 3 SAG GEST 3 SEMAPA 3 SONAE IND.SGPS 3 SONAE,SGPS 3 SONAECOM,SGPS 3 SUMOLIS 3 TEIXEIRA DUARTE 3 TOYOTA CAETANO 3
VAA VISTA ALEGRE 3
ZON MULTIMEDIA 3
Total - Nonfinancial 125
TOTAL 153
APPENDIX 1
Sector / Company
Sample Descriptive Statistics of Portuguese Listed Companies from 2005 to 2007
The sample comprises all Portuguese listed companies in Euronext Lisbon from 2005 to 2007, with public and available annual consolidated financial statements reported accordingly to IAS/IFRS, and with fiscal year end at 31st December.