M
ASTER IN
F
INANCE
MASTER´S
FINAL
WORK
D
ISSERTATION
T
AX
A
VOIDANCE
A
ND
C
ORPORATE
S
OCIAL
R
ESPONSIBILITY
A
NDRÉ
F
ILIPE
F
ERREIRA
S
ANTA
M
ARTA
M
ASTER IN
F
INANCE
MASTER´S
FINAL
WORK
D
ISSERTATION
T
AX
A
VOIDANCE
A
ND
C
ORPORATE
S
OCIAL
R
ESPONSIBILITY
A
NDRÉ
F
ILIPE
F
ERREIRA
S
ANTA
M
ARTA
S
UPERVISOR:
VICTOR
MAURÍLIO
SILVA
BARROS
i
Abstract
This study aims to understand if there is a relationship between company’s corporate tax avoidance and corporate social responsibility (CSR). The sample comprises 4,453 firm-year observations from 914 US-listed companies in the NYSE and NASDAQ, between 2002 and 2016. Overall, we do not find a statistical support for an association between corporate tax avoidance and corporate social responsibility. However, corporate tax avoidance appears to be positively associated with CSR for firms engaged in higher levels of corporate corporate social responsibility, which is consistent with risk management theory (Godfrey et al. 2009, Larrinaga et al., 2008). Our results provide a different insight to the literature, suggesting that firms that have more socially responsible activities tend to be also more tax avoidant because it helps in mitigating the risk of possibly being audited and having regulatory sanctions, as well as bad reputation from bad press and public scrutiny.
ii
Resumo
Esta tese visa entender se existe uma conexão entre planeamento fiscal corporativo e responsabilidade social corporativa (RSC). Utilizamos uma amostra composta por 4.453 observações de 914 firmas americanas na NYSE e NASDAQ, entre 2002 e 2016. No geral, não encontramos evidências estatísticas de uma associação entre planeamento fiscal corporativa e responsabilidade social corporativa. No entanto, através de uma regressão por quantis, encontramos evidências estatísticas de uma relação entre planeamento fiscal corporativo e RSC em níveis mais altos de RSC, consistente com a teoria da gestão de risco (Godfrey et al. 2009, Larrinaga et al., 2008). Os nossos resultados fornecem uma visão diferente da literatura, sugerindo que as empresas que usam mais planeamento fiscal para reduzir o valor a pagar em impostos concentram-se em praticar mais atividades de RSC para mitigar o risco de possivelmente serem auditadas e com sanções regulatórias, bem como má reputação proveniente da imprensa e do escrutínio do público.
iii
Acknowledgments
I would like to thank my advisor Professor Victor Barros for all the support provided, for all the wisdom he shared, for always being available to answer any doubts I had, and for all the motivation and guidance he transmitted throughout this journey.
I would also like to thank my friends for sharing this experience and making it worthwhile. And my mother, Maria de Lurdes, my father, Paulo, and my sister Íris for always being there and taking care of me.
Finally, I am truly thankful to my girlfriend, Inês Costa, for all the guidance, motivation and support given throughout the completion of the thesis. All the night calls, with suggestions, encouragement and consolation really helped me get the thesis done.
iv
Índice
ABSTRACT ... I RESUMO ... II ACKNOWLEDGMENTS ... III 1 INTRODUCTION ... 12 LITERATURE REVIEW AND HYPOTHESIS DEVELOPMENT ... 3
2.1 CORPORATE SOCIAL RESPONSIBILITY ... 3
2.2 CORPORATE TAX AVOIDANCE ... 4
2.3 CORPORATE TAX AVOIDANCE AND CSR ... 5
3 DATA AND METHODOLOGY ... 7
3.1 DATA ... 7
3.2 VARIABLE DEFINITION AND MEASUREMENT ... 8
3.2.1 Dependent variable ... 8
3.2.2 Independent variable ... 9
3.2.3 Control variables ... 10
3.3 BASE REGRESSION MODEL ... 12
3.4 DESCRIPTIVE STATISTICS ... 12 3.5 CORRELATIONS RESULTS ... 13 4 EMPIRICAL RESULTS ... 15 4.1 REGRESSION RESULTS ... 15 4.2 QUANTILE REGRESSION ... 15 5 CONCLUSIONS ... 19 6 REFERENCES ... 20
1 Introduction
Corporate tax avoidance has been a target of substantial scrutiny in previous research throughout the years, and so has corporate social responsibility. Yet, studies focusing on the relationship between the two are fairly scarce. With a crescent presence of tax avoidance in firms, especially US companies1, as well as a tendency for more socially responsible activities2, it is unexpected that literature linking them is effectively lacking. Following suggestions for deeper investigation associating tax avoidance with CSR (Hanlon and Heitzman, 2010), recent studies have been emerging in an attempt to relate them (e.g. Lanis and Richardson, 2012; Hoi et al., 2013; Watson, 2015) and, in our research, we aim to add clarification to that link.
Corporate social responsibility, as Sikka (2010) states, “is broader than simple compliance with law”. It has to incorporate the economic, legal, ethical and discretionary expectations of society in the corporations’ decisions, prioritizing the needs of stakeholders over the interests of shareholders3. Socially responsible companies practice voluntary activities that contribute to community health (e.g. breast cancer initiatives), safety (e.g. crime prevention), education (e.g. literacy), employment (e.g. formations at work), environment (e.g. recycling), among others (hunger, animal rights) (Kotler and Lee, 2005).
Tax avoidance represents firms’ set of tax planning strategies to reduce their explicit taxes, ranging from municipal bond investments (the less aggressive form of tax planning) to sheltering or even tax evasion (Hanlon and Heitzman, 2010; Dyreng et al., 2008). The most frequently used measures to capture tax avoidance are effective tax rates, GAAP ETR and Cash ETR, and the latter is used in our empirical analysis. Most managers perceive corporate taxes as mere firm operating costs, and the focus of their firm businesses to be long-term profits. Therefore, their objective is to reduce those costs in order to maximize shareholders’ value, disregarding other stakeholders’ interests (Friedman, 1970; Sikka, 2010).
1 See Murphy (2011) for a study putting the United States as the country with the highest loss to tax
evasion, with an estimated loss of US$337 billion.
2 See Min-Dong and Lee (200 8) 3 see Carroll (2015)
2
The benefits brought to a firm from reducing tax payments may implicate external costs. The State finances public goods (education, health, national defense, public transport, and law enforcement) through the tax revenue collected from individuals and corporations. When companies engage in tax avoidance, there is a loss of that tax revenue, limiting that possibility of the State in providing support to public goods (Sikka, 2010, Freedman, 2003). For this reason, the practice of tax avoidance is viewed as a socially irresponsible activity, possibly leading to negative public and media scrutiny.As consequence, tax avoidance can jeopardize company’s reputation and damage their brand’s value. However, companies may strategically engage in socially responsible activities as a management of risk, in order to increase their reputation (Godfrey et al. 2009, Larrinaga et al., 2008). This increase in a corporation’s CSR reputation “provides some degree of insurance protection against the risk of market, political, regulatory and social sanctions when negative corporate events occur.” (Hoi et al., 2013).
Previous research suggests there may be an association between CSR and tax avoidance. Lanis and Richardson (2012) find that there is a negative association between CSR disclosures and tax aggressiveness. The more a company is socially responsible, the less likely it is tax aggressive. With a different approach, Hoi et al. (2013) show that only irresponsible CSR activities are significantly and positively related to tax avoidance. However, Preuss (2010) and Sikka (2010) state that socially responsible firms (or the ones who claim to be socially responsible) also practice tax avoidance activities. In this study we examine the relationship between CSR and tax avoidance, and specifically whether firms exhibiting higher levels of CSR engage in more tax avoidance.
We use financial data from the Thomson Reuters Eikon database consisting of 4,453 firm-year observations from 914 firms in the NYSE and NASDAQ, between 2002 and 2016. For the data on CSR, we use Thomson Reuters Datastream’s ESG Combined Scores. Consistent with Hoi et al. (2013), our results do not indicate a direct association between CSR and tax avoidance. We find there is a positive between high-level tax avoidance firms and CSR, consistent with the risk management theory. More tax avoidant companies tend to focus on increasing their socially responsible activities to protect against public and press scrutiny, as well as political and regulatory sanctions. We also examine the link between low-level tax avoidance and CSR, and do not find a relevant association. The remainder of the research is structured as follows: Section 2 presents
3
previous literature and development of our hypotheses. Section 3 describes the data and methodology of the study. Section 4 presents the empirical results. Section 5 concludes.
2 Literature Review and Hypothesis Development
2.1 Corporate Social Responsibility
Corporate social responsibility (CSR) is a term difficult to define, but it is a practice that is gaining major importance in companies over the years. This importance is emphasized by the fact that, by the end of the 90’s, almost 90% of Fortune 500 firms had their CSR activities promoted in their annual reports as opposed to less than half of Fortune 500 firms mentioning anything related to CSR in 1977 (see Min-Dong & Lee, 2008).
Kotler & Lee (2005) define CSR as a voluntary “commitment to improve community well-being through discretionary business practices and contributions of corporate resources”. The authors point that these practices can be monetary and nonmonetary and contribute to community health (e.g. breast cancer initiatives), safety (e.g. crime prevention), education (e.g. literacy), employment (e.g. formations at work), environment (e.g. recycling), among others (hunger, animal rights). CSR is also defined by Business for Social Responsibility as “operating a business in a manner that meets or exceeds the ethical, legal, commercial, and public expectations that society has of business” (see Kotler & Lee, 2005).
Business for Social Responsibility (nonprofit global organization that deals with topics related to Social Responsibility) emphasizes, supported by their research, that Corporate Social Responsibility can bring many benefits to Companies, such as reduction of operating costs, increased attractiveness to investors, increased market share, among others (see Kotler & Lee, 2005; Carroll, 2015). Also, Jones (1995) states that altruistic behaviors that are “trusting, trustworthy, and cooperative, not opportunistic, will give the firm a competitive advantage”, and potentially decreases the “risks of becoming the target of lawsuits” (Min-Dong & Lee, 2008). Therefore, CSR is now considered as more than just a moral responsibility of firms to provide social benefits, as managers also use it strategically to serve and improve the bottom line performance of the firms (Kotler &
4
Lee, 2005; McWilliams, Siegel & Wright, 2006; Min-Dong & Lee, 2008).
2.2 Corporate Tax Avoidance
Tax avoidance is yet again a term that brings a lot of discussion over its meaning, as there is no uniquely recognized definition. Some researchers state tax avoidance is legal tax planning whereas tax evasion is illegal tax planning (see Weisbach (2003)), while others prefer not to exploit the legality of tax avoidance, stating it “represents a continuum of tax planning strategies” used to decrease explicit taxes, where, at one end of the continuum (the less aggressive type of tax planning) we have, for example, "municipal bond investments", and at the other end of the continuum we have "noncompliance", "aggressiveness", "sheltering" and "evasion" (see Hanlon & Heitzman, 2010, Dyreng et al. 2008). We will follow the latter definition.
The complexity of its definition has lead researchers to use many different measures of tax avoidance. Out of the 12 measures Hanlon and Heitzman (2010) review, GAAP ETR (ratio of total income tax expense over pretax income) and Cash ETR (ratio of cash tax paid over pretax income) are the most used by literature. We will use Cash ETR as our tax avoidance measure.
For a notion of the behavior of European quoted companies regarding tax avoidance, Tax Justice Network made a survey in 2009 and “estimated that 99% of the European quoted companies have operations in tax havens, which levy low taxes and offer secrecy to enable corporations to avoid taxes in other jurisdictions” (see Sikka, 2010). Additionally, a study made by Murphy (2011) puts the United States as the country with the highest loss of tax evasion, with an estimated loss of US$337 billion.
Although corporate tax avoidance can be perceived as beneficial for the shareholders and the company, it entails costs. Risk-neutral shareholders’ belief that executives will act in their behalf to focus on profit maximization can potentially lead to tax decisions that act in the private interests of opportunistic executives (Desai & Dharmapala, 2006, Hanlon & Heitzman, 2010). If shareholders become aware of these actions, they will “price protect themselves and bid the firm price down” (Chen et al., 2010). Another consequence of tax avoidance is the possibility of being audited by the tax administration in the US
5
(IRS), getting caught and subsequently receive punitive actions. This eventually leads to other consequences, such as bad reputation, weakening of the brand, loss of clients, as evidenced by the analysis of Hanlon & Slemrod (2009) of a negative (-1,04%) stock price reaction to news of a firm’s involvement in tax shelters.
2.3 Corporate tax avoidance and CSR
Corporations have to take into account the potential concerns of both society in general and shareholders. On one hand, society’s issue is to see if the company pays its taxes; on the other hand, shareholder’s issue is to see if the company is really avoiding taxes to maximize shareholder value (Huseynov and Klamm, 2012). The fact that avoiding taxes leads to a loss of tax revenue for the state, limiting the capacity to provide support to education, health, national defense, public transport and law enforcement (Lanis & Richardson, 2010), suggests that tax avoidance companies are socially irresponsible. However, these companies can adopt other socially responsible measures as a risk management strategy to increase CSR reputation, thus diminishing “expected costs associated with aggressive tax practices” (Hoi et al., 2013). If this is the case, there would be a positive relationship between CSR and CETR. Sikka (2010) exploits some case studies of companies who claim to be socially responsible and engage in tax evasion. Huseynov & Klamm (2012) examine the effect of CSR on tax avoidance for S&P500 firms that use auditor-provided tax services. To measure CSR, the authors use three variables from the KLD STATS database — corporate governance, community, and diversity. To measure tax avoidance they use both GAAP effective tax rate (ETR) and Cash ETR. Huseynov & Klamm (2012) conclude that CSR levels influence the relationship between fees paid for auditor-provided tax services and tax avoidance. Specifically, they find a link between tax fees and lower cash effective tax rates when a firm has corporate governance strengths4 or diversity concerns5, and between tax fees and
higher Cash ETR’s in a firm with any community concerns.
4 Socially responsible behaviors. 5 Socially irresponsible behaviors.
6
Lanis & Richardson (2012) find that there is a negative association between CSR disclosures and tax aggressiveness. Their sample consists of a cross-section of 408 publicly listed Australian corporations, and data was collected from the Aspect-Huntley financial database for the 2008/2009 financial year. Tax aggressiveness is measured based on ETRs. The authors find that higher the level of CSR disclosure of a corporation are associated with lower levels of corporate tax aggressiveness. Also, Lanis & Richardson (2012) extended the base regression model by grouping the CSR activity items by 6 different categories: corporate and CSR strategy items, staffing strategy items, social investment items, environment items, customer and supplier items, and community and political. They conclude that firm’s social investment commitment, and corporate and CSR strategy are statistically significant items of CSR activities, and that they cause a negative effect on tax aggressiveness.
Hoi et al. (2013) use a large sample of U.S. public firms over the period 2003-2009 and conclude firms with more irresponsible CSR activities, especially firms with excessive irresponsible CSR activities (four or more). In their study, CSR was obtained using negative social ratings from KLD database. The authors find no association between responsible CSR activities and tax avoidance. The authors adopt a wider perspective to measure CSR activities. These are corporate actions affecting all the firm’s stakeholders including shareholders, employees, communities, government, and customers. Irresponsible CSR activities are those that harm the firm’s stakeholders.
Literature suggests that the main reason for the lack of research providing an association between tax avoidance and CSR is the fact that corporate taxes are mostly perceived as a “business transaction and one of the many costs of operating a corporation” (Lanis and Richardson, 2012), thus managers’ objective is to maximize shareholders’ value, through the avoidance of taxes, disregarding other corporation’s stakeholders needs (Friedman, 1970; Sikka, 2010; Hoi et al., 2013). However, as previously mentioned, avoiding taxes negatively impacts the general society, as the state will have fewer funds to finance the various public goods (e.g. education, health, national defense). Therefore, it is regarded as a socially irresponsible measure when a firm “engages in strategic tax behavior designed solely to minimize its corporate taxes” (see Lanis and Richardson, 2012).
7
As CSR is regarded as having a positive impact in the well-being of most of the firms’ stakeholders, and tax avoidance strategies are perceived as exerting a negative impact in society in general, the first research hypothesis is as follows:
H1: Corporate social responsibility is negatively associated with corporate tax avoidance.
In this case CSR is our dependent variable whereas corporate tax avoidance is our variable of interest. This type of association is different from the literature, as CSR is normally the independent variable.
Despite the fact that corporate tax avoidance is perceived to have a negative impact to the general public, tax avoidant companies may strategically engage in socially responsible activities as a management of risk strategy, in order to increase their reputation. In fact, the literature suggests that there is a link between CSR and Risk Management (e.g. Godfrey et al., 2009). As Hoi et al. (2013) points, the increase in a corporation’s CSR reputation “provides some degree of insurance protection against the risk of market, political, regulatory and social sanctions when negative corporate events occur.” Therefore, the risk management theory suggests that corporations engage in strategic tax planning to reduce corporate taxes may focus in also adopting more socially responsible activities to increase their reputation and protect against the potential adjacent consequences of avoiding taxes (Godfrey et al., 2009, Hoi et al. 2013). Based on this rationale, we expect companies that are engaged in higher levels of CSR activities will exhibit higher levels of corporate tax avoidance. The second research hypothesis is as follows:
H2: Corporate social responsibility is positively associated with corporate tax avoidance
for firms that have higher levels of corporate social responsibility.
3 Data and Methodology
3.1 Data
Our sample consists of 4,453 firm-year observations from 914 firms in the NYSE and NASDAQ, between 2002 and 2016. Our sampling period is limited by the non-existing CSR data and scores of the Thomson Reuters Datastream’s ESG Combined Scores prior to 2002. These are the firms with the required information from Thomson Reuters Eikon
8
Database (for financial accounting data) and from Thomson Reuters Datastream’s ESG Combined Scores (for CSR data), after excluding the financial firms from the initial sample (following prior research on tax avoidance).
3.2 Variable definition and measurement
3.2.1 Dependent variable
We use Thomson Reuters Datastream's ESG combined scores to measure companies' CSR performance. Thomson Reuters ESG Combined Score is an overall company score between 0 and 100 based on the reported information in the environmental, social and corporate governance pillars (ESG Score) with an ESG Controversies overlay. It is calculated as the weighted average of the two component scores, with recent controversies being reflected in the latest complete period.
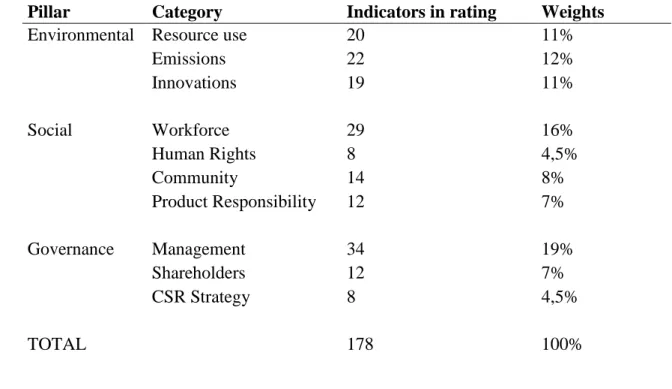
ESG category Score measures company’s ESG performance based on company reported data in the public domain (corporate website, annual reports, ESG reports, bylaws, code of conduct, etc.) across ten categories: resource use, emissions and innovation (Environment); workforce, human rights, community and product responsibility (Social); management, shareholders and CSR strategy (Governance).
ESG controversies category score measures a company's exposure to environmental, social and governance controversies and negative events reflected in global media. It is calculated based on 23 ESG controversy topics. During the year, if a scandal occurs, the company involved is penalized and this affects their overall ESGC scores and grading. Controversy scores are fully automated and objective. It is calculated an aggregated controversy percentile rank across E, S, and G, using all 23 controversy measures. A detailed description can be seen in table 1.
We are aware of the limitations present in this CSR measure. KLD database is a much more recognized and the most frequently used score to measure corporate social responsibility activities by the literature, that brings different elements to the estimation of CSR, for example, distinct scores to individual activities, scores for irresponsible activities and their description for each company.
9
Table 1: CSR scores description
The Thomson Reuters ESG Scores were designed to transparently and objectively measure company’s relative ESG performance across ten themes (emissions, environmental product innovation, human rights, shareholders, etc.) based on company reported data. There are two overall ESG Scores calculated per company, per fiscal year in the model:
1. Thomson Reuters ESG Score – measures company’s ESG performance based on company reported data in the public domain (corporate website, annual reports, ESG reports, bylaws, code of conduct, etc.) across ten categories as described below.
2. Thomson Reuters ESG Controversy (ESGC) Score – overlays the Thomson Reuters ESG Score with ESG controversies to provide a comprehensive evaluation on the company’s sustainability impact and conduct. The ESG Combined Scores are calculated as the weighted average of the two component scores per fiscal period, with recent controversies being reflected in the latest complete period.
Pillar Category Indicators in rating Weights
Environmental Resource use 20 11%
Emissions 22 12% Innovations 19 11% Social Workforce 29 16% Human Rights 8 4,5% Community 14 8% Product Responsibility 12 7% Governance Management 34 19% Shareholders 12 7% CSR Strategy 8 4,5% TOTAL 178 100% 3.2.2 Independent variable
Following prior research (Lanis & Richardson 2012; Hoi et al. 2013), we use cash effective tax rate (CETR) to capture the consequences of broad tax avoidance practices. CETR is the ratio of cash tax paid over pretax income for firm i in year t (Dyreng et al. 2010). Therefore, the lower the Cash effective tax rate, the higher the level of corporate tax avoidance.
10
We are aware of the limitations of this measure. CETR only captures non-conforming tax avoidance.6 As Cash ETR uses cash taxes paid as the numerator, it “is affected by tax deferral strategies but is not affected by changes in the tax accounting” (Hanlon and Hetizman, 2010). Also, this measure can be misleading, as cash taxes paid may include taxes paid or returned to or from the IRS, for example, from earnings from a different period.7
Despite these limitations, Cash ETR is one of the most recognized and used measure in literature to capture corporate tax avoidance, and it is the measure we will follow.
3.2.3 Control variables
We include various control variables to control for firm characteristics found to impact a firm’s ETR. These are return on assets (ROA), market-book-ratio (MKTBKR), size of the firm (SIZE), plant, property, and equipment (PPE) leverage (LEV), intangible assets (INTANGIBLES), inventory intensity (INVENTORY).
ROA is a measure of firm’s profitability equal to pre-tax income scaled by total assets, MKTBKR is a growth variable equal to the market value of equity scaled by the book value of equity, and SIZE (natural logarithm of total assets) is used to control for firm size effects. These variables are included in our regression model following Dyreng et al. (2008) findings that small and high-growth firms have higher ETRs.8
As Capital intensive firms may have more tax planning opportunities, and therefore, lower ETRs, we include the variable PPE (measured as plant, property, and equipment scaled by total assets) to control for this effect.9 Gupta & Newberry (1997) also find leverage to be positively associated with tax avoidance. LEV is long-term debt scaled by total assets.
6 Conforming tax avoidance is when a firm is able to reduce its explicit taxes by both reporting lower
accounting earnings and lower taxable income.
7 This limitation is pointed by Dyreng et al. (2008), and the authors’ alternative to the annual Cash ETR is
a 10-year Cash ETR (Long-Run Cash ETR). Their findings suggest the annual Cash ETR is not a good predictor of the long-run behavior of firms regarding tax avoidance.
8 Other studies find no association between size and ETR (for example Gupta and Newberry, 1997) or
find a negative association between size and ETR (for example Lanis and Richardson, 2007).
11
Following Hoi et al., 2013 and Chen et al., 2008, we also include INTANGIBLES (measured as Goodwill scaled by total assets) in our empirical analysis to control for our tax avoidance measure. INVINT (inventory scaled by total assets) is also included, following Lanis and Richardson (2012). Lastly, we include dummies to control for year and industry fixed effects. Table 2 describes the variables definition of our regression.
Table 2: Variables definition
Measure of Tax Avoidance:
CETR Cash effective tax rate Ratio of cash tax paid over pretax income for the firm. CETR is truncated between 0 and 1.
Measure of CSR:
CSR Environment, Social and Governance combined score
Overall company score between 0 and 100 based on the reported information in the environmental, social and corporate governance pillars (ESG Score) with an ESG Controversies overlay. It is calculated as the weighted average of the two component scores, with recent controversies being reflected in the latest complete period.
Control Variables:
PPE Capital intensity (-) Plant, property and equipment divided by total assets
LEVERAGE Leverage (-) Long-term debt divided by total assets
INTANGIBLES Intangibles (?) Goodwill divided by total assets ROA Return on assets (?) Net income divided by total
assets
SIZE Firm size (?) Natural log of total assets
MKTBKR Market-to-book ratio (?) The market value of equity divided by the book value of equity
12
3.3 Base regression model
We test our relation between CSR and tax avoidance, with the following base regression model:
𝐶𝑆𝑅𝑖𝑡 = 𝛼0+ 𝛽1𝐶𝐸𝑇𝑅𝑖𝑡 + 𝛽2𝑅𝑂𝐴𝑖𝑡+ 𝛽2𝑀𝐾𝑇𝐵𝐾𝑅𝑖𝑡+ 𝛽4𝑆𝐼𝑍𝐸𝑖𝑡+ 𝛽5𝑃𝑃𝐸𝑖𝑡
+ 𝛽6𝐿𝐸𝑉𝑖𝑡+ 𝛽7𝐼𝑁𝑇𝐴𝑁𝐺𝑖𝑡+ 𝛽8𝐼𝑁𝑉𝐼𝑁𝑇𝑖𝑡+ 𝑌𝑒𝑎𝑟 𝐷𝑢𝑚𝑚𝑖𝑒𝑠 + 𝐼𝑛𝑑𝑢𝑠𝑡𝑟𝑦 𝐷𝑢𝑚𝑚𝑖𝑒𝑠 + 𝜀𝑖𝑡
where 𝐶𝐸𝑇𝑅𝑖𝑡 is a corporation’s cash effective tax rate, measured as the ratio of cash tax
paid over pretax income for firm i in year t; 𝑅𝑂𝐴𝑖𝑡 is the Return on assets for firm i, year t measured as the pre-tax income scaled by total assets; 𝑀𝐾𝑇𝐵𝐾𝑅𝑖𝑡 is the market value of equity scaled by the book value of equity for firm i, year t; SIZEit is the natural
logarithm of total assets; PPEit is property, plant and equipment for firm i, year t, scaled
by total assets; LEVit is the leverage for firm i, year t, measured as long-term debt scaled
by total assets; INTANGit is the goodwill for firm i, year t, scaled by total assets; INVINTit
is inventory for firm i, year t, scaled by total assets. We also tested for headquarter dummies, but the impact in our regression model was residual, and industry provides a better fit to the model.
Our second hypothesis relates to the left tail of the CSR distribution (i.e. more CSR activities engaged by a firm), our statistical test and inference is based on a quantile regression estimate.
3.4 Descriptive statistics
Table 3 reports descriptive statistics of the variables present in our regression. For CETR, the mean (median) is 0.2782 (.2590). CETR varies from 0 to 0.9326 (with a range of 0-1), and its standard deviation is 0.1864. For CSR, the mean (median) is 44.9510 (42.3400)
13
with a range of 0-100, meaning that on average firms have a CSR score of around 45. For
the control variables, we have that PPE has a mean (median) of .2492 (.1861), LEVERAGE has a mean (median) of .2166 (.2062), INTANGIBLES has a mean (median) of .1755 (.1462), ROA has a mean (median) of .0764 (.0683), SIZE has a mean (median) of 22.6708 (22.5747), MKTBKR has a mean (median) of 3.6821 (2.7949), and INVENTORY has a mean (median) of .1156 (.0907).
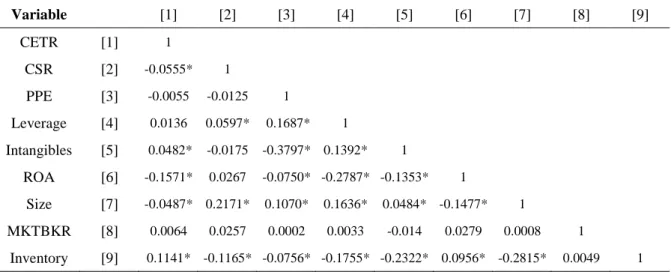
3.5 Correlations results
In Table 4 it is represented the Pearson pairwise correlation results. This correlation matrix shows CETR is negative and significantly correlated with CSR (correlation -0.0555; p-value 0.0002), indicating that the higher the firms’ score of CSR, the lower its cash ETR (more aggressive towards tax avoidance). For CETR, we also have that INTANGIBLES and INVENTORY are positive and significantly correlated, while ROA and SIZE are negative and significantly correlated, consisted with the majority of the literature.
Variable Obs Mean Std. Deviatio n Min Max 1st quartil e Median 3rd Quartile CETR 4453 .2782 .1864 0 .9326 .1637 .2590 .3438 CSR 4453 44.951 15.2720 0 95.9 34.4 42.34 53.86 PPE 4453 .2492 .2047 0 1 .0999 .1861 .3413 Leverage 4453 .2166 .1459 0 1 .1160 .2062 .3084 Intangibles 4453 .1755 .1393 0 .6316 .0587 .1462 .2684 ROA 4453 .0764 .0556 -.350878 .4925 .0340 .0683 .1026 Size 4453 22.6708 1.3838 17.2733 27.4051 21.7694 22.5747 23.6095 Mktbkr 4453 3.6821 22.7930 -477.0976 856.4461 1.7664 2.7949 4.2801 Inventory 4453 .1156 .1094 0 .7916 .0351 .0907 .1578
14
We also tested for the multicollinearity by conducting a variance inflation factor (VIF) test. If a variable has a VIF value above 10, it can be an indication of multicollinearity. With a mean VIF of 1.92 and no variable having a VIF value near 10, we don’t find evidence of multicollinearity in our regression.
To test for the normality of the variables, we conducted a battery of tests to check the normality of the residuals. First, we generated the residuals of our regression and viewed the Kernel density estimation and the standardized normal probability (P-P), and we concluded that the residuals are non-normal. Finally, we conducted the Shapiro-Francia test, as it has less than 5000 observations. We ended up with the same conclusion, the residuals are non-normal. Therefore, our predictions may be inaccurate. However, as we don’t have a variance issue, we can disregard the fact that we violate the assumption of normality.
Additionally, we did a Wald test to check if the variables present in our regression can be removed from our model and not reducing its fit. We made the test by using the test command in stata, and checking if the parameters of our variables were simultaneously equal to zero. As the p-value equaled zero, we rejected the null hypothesis, indicating that every variable creates a significant improvement in the fit of our model.
Table 4: Pearson Correlation analysis
Variable [1] [2] [3] [4] [5] [6] [7] [8] [9] CETR [1] 1 CSR [2] -0.0555* 1 PPE [3] -0.0055 -0.0125 1 Leverage [4] 0.0136 0.0597* 0.1687* 1 Intangibles [5] 0.0482* -0.0175 -0.3797* 0.1392* 1 ROA [6] -0.1571* 0.0267 -0.0750* -0.2787* -0.1353* 1 Size [7] -0.0487* 0.2171* 0.1070* 0.1636* 0.0484* -0.1477* 1 MKTBKR [8] 0.0064 0.0257 0.0002 0.0033 -0.014 0.0279 0.0008 1 Inventory [9] 0.1141* -0.1165* -0.0756* -0.1755* -0.2322* 0.0956* -0.2815* 0.0049 1
This table presents the Pearson Correlation univariate analysis. * Significance at the .05 level.
15
4 Empirical results
4.1 Regression results
We test the influence of CETR on CSR using our regression model. Table 5 reports these results. We find the regression coefficient for CSR is negative, contrary to H1, but it is not statistically significant. Therefore, we do not find statistical evidence that an increase in tax avoidance leads to a decrease in the company’s CSR score.
Looking at the effect control variables have on tax avoidance, we find ROA is positive and very significantly related with CSR, as well as SIZE (p<.01). These associations suggest that bigger companies engage in more CSR activities. Leverage is also positive and significantly related with CSR. PPE is negative and significantly related with CSR. Capital-intensive firms are expected to have higher tax planning opportunities, and this can lead to irresponsible CSR activities, decreasing the CSR score of a company. We also find Intangibles and Inventory to be negative and very significantly associated with CSR (p<.01).
4.2 Quantile Regression
Quantile regression allows us to confirm if there is a link between corporate tax avoidance and CSR at higher levels of CSR, our second hypothesis. Quantile regression enables us & Tukey (1977, p. 266), while exploiting and comparing these different methods observe: “What the regression curve does is give a grand summary for the averages of the distributions corresponding to the set of x’s. We could go further and compute several different regression curves corresponding to the various percentage points of the distributions and thus get a more complete picture of the set. Ordinarily, this is not done, and so regression often gives a rather incomplete picture. Just as the mean gives an to get a more concrete inference, at different distributions of tax avoidance, which we otherwise would not obtain from an ordinary least square (OLS) regression.10 Mosteller incomplete
10 OLS regressions only describe the relationship between independent variables and the conditional
16
picture of a single distribution, so the regression curve gives a corresponding incomplete picture for a set of distributions.”
Table 5: OLS Regression results (H1)
(1) CSR CETR -1.860 (1.237) PPE proportion -2.854* (1.455) Mktbkr 0.0133 (0.00957) Leverage 3.460* (1.724) Intangibles -7.700*** (2.026) ROA 17.58*** (4.442) Size 2.903*** (0.181) Inventory Intensity -12.87*** (2.816) Observations Adjusted R2 4453 0.1095
Standard errors in parentheses
* p < 0.05, ** p < 0.01, *** p < 0.001
independent variables and any specified percentile of the conditional distribution of the dependent variable. For a more profound analysis of quantile regressions, see Koenker and Hallock (2001).
17
Table 6 presents the results of our quantile regression at high levels of CSR. Our Quantile regression estimates at the 75th percentile of the CSR distribution. In this scenario, we find a very negative and significant association between CSR and CETR at high levels of CSR. Therefore, there is statistical evidence that at higher levels of Corporate social responsibility activities, as a corporation’s level of tax avoidance increases, its CSR also increases. Corporations that are more tax aggressive may tend to adopt more socially responsible measures to try to offset their tax aggressive policies.
For the control variables, the quantile regression shows a negative and significant association between PPE, and high-level CSR, a negative and significant association between INVENTORY and high-level CSR, a negative and significant association between INTANGIBLES and high-level CSR. The opposite significant association happens with ROA, SIZE and LEVERAGE. Only Market-to-book Ratio doesn’t have a significant association with CSR.
We also analyze the regression at lower levels of CSR (25th percentile). As we expected,
there is no association between CSR and Tax avoidance, at lower levels of CSR.
To get a more detailed vision of the association between CSR and corporate tax avoidance at different distributions of corporate social responsibility scores, we measured the deciles of CSR, as shown in table 7. The results show that the negative association between CSR and corporate tax avoidance is only significant between the 50th and the 80th percentile. Perhaps companies that are fully committed in engaging in CSR activities (90th percentile) prefer not to evade taxes or are at that level because they don’t engage in any kind of irresponsible activity (corporate tax avoidance may impact the measure of CSR as it is denoted as a type of irresponsible CSR activity).
18
Table 6: Quantile Regression results (H2)
(1) (2) CSR 75th percentile CSR 25th percentile CETR -4.245** -1.611 (2.016) (0.999) PPE proportion -5.937*** -1.243 (2.270) (1.117) Leverage 7.716*** 0.673 (2.898) (1.464) Intangibles -9.008*** -4.231*** (3.180) (1.606) ROA 19.673*** 8.248** (6.007) (3.688) Size 3.349*** 2.497*** (0.302) (0.135) Mktbkr 0.004 0.010 (0.016) (0.011) Inventory -16.110*** -8.240*** (4.201) (2.174) Observations 4453 4453 Adjusted R2
Standard errors in parentheses
* p < 0.1, ** p < 0.05, *** p < 0.01
Table 7: Quantile Regression results (H2)
(1) (2) (3) (4) (5) (6) (7) (8) (9) CSR 10th percentile CSR (20th percentile CSR (30th percentile CSR (40th percentile CSR (50th percentile CSR (60th percentile CSR (70th percentile CSR (80th percentile CSR (90th percentile CETR 0.561 -1.501 -1.500 -1.536 -2.180** -2.634** -3.609** -3.211* -2.252 (0.915) (0.995) (0.939) (0.953) (1.110) (1.216) (1.438) (1.770) (2.104) PPE -0.708 -1.006 -1.075 -1.224 -1.767 -3.563* -4.811*** -5.875*** -7.309*** (0.646) (1.225) (1.163) (1.239) (1.441) (2.010) (1.786) (1.922) (1.758) Leverage -0.477 0.527 1.735 3.188* 4.312** 5.646** 6.093** 6.968*** 3.127 (1.584) (1.616) (1.442) (1.804) (1.889) (2.499) (2.414) (2.456) (1.943) Intangibles -5.708*** -4.045** -2.865* -3.455* -3.797* -4.761** -6.478** -13.344*** -17.537*** (1.549) (1.826) (1.704) (1.811) (2.056) (2.335) (2.539) (2.960) (2.436) ROA 16.708*** 12.984*** 13.440*** 13.424*** 13.739*** 18.998*** 20.752*** 22.485*** 25.919*** (3.918) (2.733) (3.980) (4.455) (4.596) (6.100) (5.188) (6.476) (5.452)
19 Size 3.277*** 2.739*** 2.306*** 1.901*** 1.877*** 2.085*** 2.645*** 3.934*** 4.498*** (0.156) (0.145) (0.143) (0.154) (0.172) (0.224) (0.261) (0.295) (0.289) mktbkr 0.012 -0.000 -0.000 0.013 0.016** 0.014 0.008 0.005 0.028*** (0.012) (0.005) (0.014) (0.015) (0.008) (0.015) (0.008) (0.013) (0.008) Inventory -11.723*** -6.985** -8.777*** -8.651*** -12.046*** -11.943*** -16.702*** -15.450*** -24.961*** (1.724) (2.751) (2.582) (2.533) (2.173) (3.310) (3.528) (4.135) (3.265) Observatio ns 4453 4453 4453 4453 4453 4453 4453 4453 4453 Adjusted R2
Standard errors in parentheses
* p < 0.1, ** p < 0.05, *** p < 0.01
5 Conclusions
Following previous and important empirical contributions of Lanis & Richardson (2012), Huseynov & Klamm (2012), Hoi et al. (2013) and Watson (2015), this study examines the association between CSR and tax avoidance. Using cash ETR to measure tax avoidance and
a sample consisting of 4,453 firm-year observations from 914 US firms in the NYSE and NASDAQ, between 2002 and 2016, our regression results indicate there is not a direct association between CSR and the practice of tax avoidance. However, through quantile regression estimation, focusing on the association between corporate tax avoidance and CSR at higher levels of CSR, we find a positive link between them.
Our results provide a different insight to the literature, suggesting that, consistent with risk management theory, firms that engage in more CSR activities may tend to engage in corporate tax avoidance, as they are aware that practicing more alternative CSR activities helps in mitigating the risk of possibly being audited and having regulatory sanctions, as well as bad reputation from bad press and public scrutiny. An alternative future research, that we did not test, is whether this association is stronger with bigger and/or more profitable firms.
20
6 References
Aupperle, K., Carroll, A., Hatfield, J. 1985. An empirical examination of the
relationship between corporate social responsibility and profitability, Academy
of Management Journal, Vol. 28. No- 2, 446-463.
Carroll, A., 2015. Corporate social responsibility: The centerpiece of competing and complementary frameworks, Organizational Dynamics 44, 87-96.
Chen, S., Chen, X., Cheng, Q., Shevlin, T., 2010. Are family firms more tax aggressive than non-family firms?, Journal of Financial Economics 95 (1): 41-61.
Desai, M., Dharmapala, D., 2006. Corporate Tax Avoidance and high-powered Incentives, Journal of Financial Economics 79 (1): 145-179.
Dyreng, S., Hanlon, M., Maydew, E., 2008. Long-run corporate tax avoidance. The
Accounting Review 83: 61-82.
Dyreng, S., Hanlon, M., Maydew, E., 2010. The Effects of Executives on Corporate Tax Avoidance, The Accounting Review 85 (4): 1163-1189.
Freedman, J., 2003. Tax and corporate responsibility. Tax Journal 695 (2), 1–4. Friedman, M., 1970. ‘The social responsibility of business is to increase its profits’.
New York Times Magazine, September, 13.
Godfrey, P. C., C. B. Merrill, and J. M. Hansen. 2009. The relationship between corporate social responsibility and shareholder value: An empirical test of the risk management hypothesis. Strategic Management Journal 30 (4): 425–445. Gupta, S., Newberry, K. 1997. Determinants of the variability in corporate effective tax
rates: Evidence from longitudinal data, Journal of Accounting and Public Policy 16 (1): 1-34.
Hanlon, M., & Heitzman, S. (2010). A review of tax research. Journal of Accounting
21
Hanlon, M., Slemrod, J., 2009. What does tax aggressiveness signal? Evidence from stock price reactions to news about tax shelter involvement, Journal of Public
Economics 93 (1-2): 126-141.
Hoi, C., Wu, Q., Zhang, H., 2013. Is Corporate Social Responsibility (CSR) Associated with Tax Avoidance? Evidence from Irresponsible CSR Activities, The
Accounting Review, 88 (6): 2025-2059.
Huseynov, F., Klamm, B., 2012. Tax Avoidance, tax management and corporate social responsibility, Journal of Corporate Finance 18 (4): 804-827.
Jones, T, 1995. Instrumental Stakeholder Theory: A Synthesis of Ethics and Economics,
The Academy of Management Review, Vol. 20, No. 2 (Apr., 1995), pp. 404-437.
Koenker, R., and K. F. Hallock, 2001. Quantile regression. Journal of Economic
Perspectives 15: 143-156.
Kotler, P., Lee, N., 2005 Corporate Social Responsibility: Doing the most good for your company and your cause, Hoboken, NJ: Wiley.
Lanis, R., Richardson, G., 2012. Corporate social responsibility and tax aggressiveness: An empirical analysis, Journal of Accounting and Public Policy 31 (1): 86-108. Larrinaga, C., Moneva, J., Bebbington, j. 2008. Corporate Social Reporting and
Reputation Risk Management. Accounting Auditing & Accountability Journal, Vol. 21 nº 3: 337-361
Lietz, G., 2013. Determinants and Consequences of Corporate Tax Avoidance. Working
Paper, University of Münster.
McWilliams, A., Siegel, D., Wright, P., 2006. Corporate Social Responsibility: Strategic Implications, Journal of Management Studies, 43(1), 1-18.
Min-Dong, Lee, P., 2008. A review of the theories of corporate social responsibility: Its evolutionary path and the road ahead, International Journal of Management
Reviews Volume 10 Issue 1 pp. 53–73.
Mosteller, F., Tukey J.. 1977. Data Analysis and Regression: A Second Course in Statistics. Reading, Mass.: Addison-Wesley.
22
Murphy, R., 2011. The Cost of Tax Abuse: A Briefing Paper on the Cost of Tax Evasion Worldwide, The Tax Justice Network.
Preuss, L., 2010. Tax avoidance and corporate social responsibility: you can't do both, or can you? Corp. Gov. 10, 365–374.
Richardson, G., Lanis, R., 2007. Determinants of the variability in corporate effective tax rates and tax reform: evidence from Australia. Journal of Accounting and
Public Policy 26 (6), 689–704.
Sikka, P., 2010. Smoke and mirrors: Corporate social responsibility and tax avoidance.
Accounting Forum 34: 153–168.
Tax Justice Network, 2009. Where on earth are you? Major corporations and tax havens. London: Tax Justice Network. http://www.taxresearch.org.uk/ Documents/Whereonearth.pdf
Watson L (2015). Corporate social responsibility, tax avoidance, and earnings performance. Journal of the American Taxation Association 37, 1-21. 8. Weisbach, D., 2003. Corporate tax avoidance. In: Proceedings of the National Tax