MASTER IN
F
INANCE
MASTER´S FINAL WORK
DISSERTATION
C
ORPORATE
T
AX
A
VOIDANCE
F
OLLOWED BY
M
ERGERS AND
A
CQUISITIONS
DANIEL JOSÉ DA SILVA DUARTE
MASTER IN
F
INANCE
MASTER´S FINAL WORK
DISSERTATION
C
ORPORATE
T
AX
A
VOIDANCE
F
OLLOWED BY
M
ERGERS AND
A
CQUISITIONS
DANIEL JOSÉ DA SILVA DUARTE
S
UPERVISOR:
V
ICTORM
AURÍLIO SILVA BARROSi
Abstract
This paper aims to understand the change in corporate tax avoidance following a M&A
deal. Several M&A features were tested in a sample which covers 707 European deals.
Overall, results suggest that there is no statistical evidence of changes in corporate tax
avoidance following M&A deals. However, we found some evidence of higher level of
corporate tax avoidance when the deal is horizontal and when the target company had
operating losses the year before deal. Our results suggest a decrease in ETR of about 3%
for horizontal mergers and a reduction of effective taxes paid between 6.2% and 8.6% if
target had negative pre-tax income pre-deal. This reduction in ETR increases to 9% for
horizontal deals, in which the target had a negative pre-tax income one-year before the
deal. Our findings support the view that tax motives may not trigger M&A deals, although
significant tax savings appear to occur for certain M&A characteristics.
JEL: G34; H26; F20
ii
Resumo
Este trabalho tem como objetivo perceber as alterações ao planeamento fiscal da empresa
após uma operação de F&A. Várias características de F&A foram testadas numa amostra
que abrange 707 operações Europeias. No geral, os resultados sugerem que não há
evidência estatística de alterações no planeamento fiscal da empresa adquirente após uma
operação de F&A. No entanto, encontrámos evidência de um maior nível de planeamento
fiscal quando as operações são horizontais e quando a empresa-alvo tem resultados
operacionais negativos no ano anterior à operação. Os nossos resultados sugerem uma
diminuição de cerca de 3% na taxa efetiva de imposto quando a operação é horizontal e
uma redução dos impostos pagos, entre 6.2% e 8.6%, se a empresa-alvo apresentou
resultados operacionais negativos no ano anterior à operação. Esta redução na taxa efetiva
de imposto aumenta para 9% se a operação for simultaneamente horizontal e a
empresa-alvo tenha resultados operacionais negativos no ano anterior à operação. Os nossos
resultados suportam a perspetiva de que motivos fiscais podem não despoletar uma
operação de F&A, no entanto uma significativa poupança fiscal parece verificar-se para
determinadas características das F&As.
JEL: G34; H26; F20
iii
Acknowledgements
I would like to express my sincere gratitude to my advisor Professor Victor Barros for his
persistence, motivation, enthusiasm and continuous support in this troubled journey. His
expertise and immense knowledge were essential for me to follow the right path and to
submit this thesis.
A special thanks to Professor Clara Raposo for her suggestions, constant joy and for being
an example to follow for all of us. I would also to thank to Professor Raquel Gaspar for
her patience, advice and support in this process.
I am also thankful to my friends for all the laughs and silly things and for always being
there.
Finally, I would like to thank to my beloved family for their support. Especially to my
father Francisco and my mother Célia for their encouragement and education given
throughout these years. To my little brother João, thank you for being the amazing person
iv
List of Tables
Table 1: Headquarters statistics and database construction ... 39
Table 2: Industry descriptive statistics ... 40
Table 3: Variables definition ... 41
Table 4: Descriptive Statistics ... 43
Table 5: Correlation analysis ... 44
Table 6: Effect of D_afterdeal variable on tax avoidance measures (Hypothesis 1) ... 45
Table 7: Effect of D_afterdeal_indust variable on tax avoidance measures ((Hypothesis 2) ... 46
Table 8: Effect of D_afterdeal_taxavoidt-1variable on tax avoidance measures (Hypothesis 3) 47 Table 9: Effect of D_afterdeal_loss variable on tax avoidance measures (Hypothesis 4) ... 48
Table 10: Effect of D_afterdeal_domest variable on tax avoidance measures (Hypothesis 5) .. 49
Table 11: Effect of D_afterdeal_indust_loss variable on tax avoidance measures ... 50
Table 12: Effect of D_afterdeal on tax avoidance measures (H1) - Robustness analysis ... 51
Table 13: Factorial analysis ... 52
List of Figures
Figure 1: Total M&A transaction value by sort of deal (2005 through to 2014) ... 38v
Table of Contents
ABSTRACT ... I
RESUMO ... II
ACKNOWLEDGEMENTS ... III
LIST OF TABLES ... IV
LIST OF FIGURES ... IV
1 INTRODUCTION ... 1
2 LITERATURE REVIEW... 4
2.1 TAX ISSUES AS DETERMINANTS OF M&A ... 5
2.2 TAX AVOIDANCE FOLLOWING M&A ... 9
2.3 RESEARCH HYPOTHESES ... 14
3 EMPIRICAL RESEARCH ... 16
3.1.1 Data ... 16
3.2 METHODOLOGY ... 17
3.2.1 Measuring Corporate Tax Avoidance ... 17
3.2.2 Econometric Approach ... 18
3.2.3 Descriptive statistics ... 22
4 RESULTS ... 22
4.1 HYPOTHESES RESULTS ... 23
4.1.1 Tax avoidance following M&A deal ... 23
4.1.2 Tax avoidance following M&A deal in the same industry ... 25
4.1.3 Tax avoidance following M&A deal when target has lower ETR ... 25
4.1.4 Tax avoidance following M&A deal when target has negative pre-tax profit ... 26
4.1.5 Tax avoidance following cross-border M&A deal ... 26
4.1.6 Further analysis ... 27
4.2 ROBUSTNESS CHECKS ... 27
5 CONCLUSIONS ... 30
6 REFERENCES ... 32
1
1
Introduction
Over the last years, mergers and acquisitions have increased significantly both in value
and number of transactions, increasing its importance as form of business investment.
According to Thomson Reuters M&A Review (2015), in 2015 was announced $4,7
trillion in worldwide M&A operations, more 40% than in 2014, being set as the biggest
M&A year ever, until then, beating the previous record of $4,4 trillion in 2007. Another
interesting fact in 2015, was the significant number of mega-deals (more than $5 billion)
in 2015. The 137 mega-deals planned last year, represented 52% of total M&A value in
2015. Over the last decades M&A activity has been represented by several waves. Knox
and Harik (2015) argued that, 2015 could be the start of a new wave for M&A. The
authors refer that the increasingly number of deals is related with stock market conditions.
M&A´s can generate synergetic gains through reduction of doing business costs
(economies of scale) and consolidation, leading to a greater market share and
consequently to an increase in revenues (Devos et al., 2008). Besides operational
synergies, there are also potential tax synergies arising from M&A operations. Prior
literature argues that tax attributes (e.g. net operating losses) can play an important role
on M&A activity (See Auberbach and Reishus, 1986;1987;1988; Hayn, 1989), and that
usually, these attributes are reflected in higher premiums paid by the companies in M&A
deals (See Kaplan, 1989). Additionally, the literature suggests an increase of tax
avoidance strategies, especially from multinational firms, which arise mainly from the
tax rate-gap between countries (See Schwarz, 2009; Huizinga and Laeven, 2008;
Clausing, 2009). Parent companies from high tax juridisctions engage in more tax
avoidance strategies (via income shifting) with their affiliates, from lower tax
juridisctions, in order to reduce their tax burden (See Klassen and Laplante, 2012;
2
M&A, especially for cross-border deals (Belz et al., 2013; Huizinga & Voget, 2009). A
recent and much criticized case was the announced $160 billion deal between Pfizer and
Allergan. With the M&A, Pfizer would strategically move its headquarters to Ireland in
order to reduce its actual corporate tax burden. According to Fortune (2015), the operation
would reduce (approximately 25%) Pfizer´s current effective tax rate (ETR) to a
combined effective tax rate of approximately 17% to 18% in the first year after this tax
inversion deal. Besides all synergies related to the creation of the biggest drug maker
company, this was a clear tax-motive merger as Ireland has low corporate income tax
rates1. Another recent announced tax inversion deal, that was effectively concluded, was
made between the American company Johnson Controls and an Irish company Tyco. As
US companies are subjected to one of the highest tax rate in the world, cross-border deals
are increasingly becoming more frequent.
This study aims to assess whether the level of corporate tax avoidance increase for the
acquirer company following an M&A deal. The characteristics that may well shape the
deal are also analysed. By using several tax avoidance measures, similar to Chen et al.
(2010) study, we test if there is evidence of lower taxes paid by the acquirer after deal.
Belz et al. (2013) found a decrease of target´s ETR by 3% following M&A deal, however,
the authors have only documented this result graphically.
We use data from Thomson Reuters Eikon database, which covers 10 years of European
M&A deals. Our sample comprises 359 completed M&A deals from 34 different
European countries, which were announced between 2005 and 2014. In addition to the
main aim of this thesis, several hypotheses are added, regarding the type of deal
(horizontal vs non-horizontal and domestic vs cross-border), existence of operating losses
1 The smaller company, Irish-based Allergan would buy the larger company, American-based Pfizer,
3
by the target and tax rate differences between both acquirer and target company. Overall,
our findings suggest that there is no evidence of higher level of corporate tax avoidance
following an M&A. However, this overall result may be shaped by several characteristics.
Firstly, if both firms operate in the same industry, there is a statistically significant
evidence of a reduction in acquirer´s book effective tax rate of 3%, following deal.
Secondly, if the target company presented negative pre-tax income the year before deal,
we found that acquirer´s tax burden is reduced between 6.2% and 8.6%, depending on the
tax avoidance measure. This reduction increases by about 9% for book ETR, if the deal
is horizontal and the target had negative pre-tax income one year before the deal,
simultaneously. Lastly, ambiguous results were found regarding the deal be domestic
rather than cross-border. Additional tests were performed to assess the robustness of our
findings. The rest of the research is structure as following: Section 2 presents previous
literature regarding M&A tax issues and tax avoidance strategies of multinational firms;
Section 3 describes the data and the methodology applied; Section 4 presents and
discusses the results and Section 5 concludes the study.
4
2
Literature Review
Over the last years, mergers and acquisitions have increased significantly both in value
and number of transactions, increasing its importance as form of business investment.
There are several reasons for a company to acquire another company, or for two or more
companies to merge. The overall reason pointed for a company to acquire other company
is that the acquiring firm considers the operation profitable in terms of investment
(Pautler, 2001). Synergy gains, reduction of the costs of doing business, better
organizational activity, the increase of market power or a better management efficiency
are other, but not less important reasons for M&As. Ngueyn et al. (2012), by using a
sample of domestic US acquisitions, found ex-post evidence that M&As were motivated
by market timing, agency or hubris reasons as a response to economic, and or industry
shocks. Martynova and Renneboog (2008) have analysed the determinants of the five
M&A waves and found that are some common reasons for all waves. The authors pointed
managerial self-interest and hubris as motives for M&A activity.
With an increased globalization of business and the lack of opportunities in local markets,
companies had to rapidly adjust to those changes via foreign investment. Cross-border
M&A represent the largest share of FDI, for developed countries2. It allows firms to
diversify their production overseas, leading to a higher economic integration among
countries all over the world (di Giovanni, 2005). Having access to different customers,
suppliers and capital markets, cross-border deals are an important driver for a greater
competitiveness in a dynamic economy. There are several determinants for a cross-border
deal to take place. Erel et al. (2012) found that the geography is relevant for a deal to take
place, arguing that, it is more likely for a company to acquire another if that company
2 In comparison to greenfield investment, in 1999, cross-border M&A represented 80% of total FDI (See
5
operates in a nearby country. The authors also pointed that currency movements between
countries could increase the likelihood of the acquirer firm being from the country with
the appreciating currency, while the target was more likely to be from the country with
the depreciating currency. The authors add that economically developed countries, with
higher accounting standards and higher stock market performance are more likely to be
the buyer. Rossi and Volpin (2004) analysed the main differences in laws and
enforcement between countries and concluded that, besides better accounting standards,
the volume of M&A in a country is also explained by a stronger shareholder protection.
The authors also found that higher investor protection the probability of a cross-border
operation to occur. The authors argue that, usually, target companies are related to
countries with lower investor protection and acquirers to countries with better investor
protection, suggesting the importance of cross-border deals as a driver for a global
convergence in corporate governance standards.3 Manchin (2004) found similar
conclusions, arguing that target firms can improve corporate governance by adopting
some “inside rules” of the acquirer, improving its efficiency and investor protection.
Besides the previously presented determinants of cross-border M&As, there are also
significant tax factors that might affect the volume of M&As4.
2.1 Tax issues as determinants of M&A
There is an extent literature about the impact that taxation can take in M&A operations
and in multinational companies´ activity in general. The first tax issue is the corporate
combination form that the transaction can take. A transaction can take the form of a
taxable or tax-free operation and the choice may have a significant impact on the potential
corporate tax benefits (Gilson et al., 1988). If the transaction is considered taxable,
3 Similar findings were obtained in Monteiro (2012) study.
4 The authors also concluded that M&A waves are occur more often in periods of economic recovery
6
shareholders from target company have to pay taxes from the capital gains obtained from
the sale of target company shares. However, if the transaction is tax-free, target
shareholders do not have to pay any taxes until they decide to sell the shares received
from the acquiring company. The second alternative can be beneficial for target
shareholders of smaller companies, once they can obtain a more balanced and diversified
portfolio by exchanging their stocks for stocks of a larger and more diversified company5.
Bierman (1980) presents, in a very simple way, the tax incentive of a company to acquire
the shares of another firm. The author argues that a company may have a tax advantage
to acquire the shares of other company initially, if decides to pay dividends6. In the case
of a cash transaction, target shareholders are immediately taxed due to the gain resultant
from the deal. Sullivan (1993) found that target shareholders request higher premiums to
compensate the immediate liability they are subject to after the deal. Erickson (1998) have
analysed the impact of tax and non-tax characteristics of a target company in the deal´s
structure. The author found similar conclusions: in taxable transactions the average
premium demanded is higher than in tax-free transactions. The author adds that the
probability of non-taxable (stock) transaction taking place, increases with the market-to-
-book (M/B) ratio of the acquiring company. Similarly, Carleton et al. (1983) found that
the probability of a cash takeover is a decrease function of dividend pay-out ratios and
M/B ratios, adding that, a company with low dividend pay-out ratios and M/B ratios is
more likely to be acquired through a cash takeover rather than through a securities
exchange.
5 Although this option might be preferable in the perspective of individual taxation, can limit the
potential corporate tax benefits (See Auberbach & Reishus (1987)).
6 The amount of dividends paid to the investors will be greater if the acquirer retains its earnings initially
7
Besides shareholders´ tax factors, there are also potential tax benefits, at a corporate level,
that may trigger M&A operations. Firstly, an acquiring company may have unused tax
credits and tax losses (NOLs) that can be transferred to the target company to offset its
taxable income, or vice-versa. A company that presents a tax loss or have unused tax
credits can carryforwards these tax benefits to be used when the company has enough
taxable income to be reduced (Cooper & Knittel, 2006)7. Secondly, a company might
step-up asset basis for tax purposes. Before an acquisition, a company can readjust the
value of their assets by increasing the tax basis of those assets (Brown & Ryngaert, 1991).
Increasing the tax basis of the assets lead to higher deductions, which are treated as tax
expenses, reducing the combined company´s tax liabilities. However, this potential
benefit can be partially offset by the recapture tax8. Thirdly, companies can increase the
amount of debt to benefit from the tax deductibility of interest9. Financing operations with
debt rather than equity may be advantageous from a tax point of view. By financing its
operations with debt, the merged firm can reduce its tax burden through deductions of
interest expenses. Several studies were conducted to analyse the impact and influence of
tax benefits in M&A activity. Auberbach and Reishus (1986) evaluate the potential tax
benefits companies could obtain through this type of operation. The authors found that
potential tax benefits could play an important role only for a small sample of M&A,
however estimated gains from step-up and leverage increase were not relevant10.
Similarly, Auberbach and Reishus (1987) concluded that the most significant tax benefit
were the unused tax credits and losses, especially when used by the acquiring company
7 If the taxable income is not enough to offset the current year´s loss, the company can carryforwards
the rest of unused tax credits for the next year, under certain rules.
8 In USA, when a company deducts asset´s depreciation to the taxable income, tax payer is obliged to
report the gains obtained from transfer of the asset. These gains are treated as ordinary income and subjected to capital gain tax.
9 See Modigliani and Miller (1963)
8
to shelter income from the target company. Again, increasing leverage and step-up were
not relevant tax factors. By comparing a sample of mergers with pseudomergers, to
analyse M&A activity, Auberbach and Reishus (1988) found little evidence of gain from
interest deductions, step-up and unused tax credits and losses.11 Hayn (1989) found a
positive relationship between tax attributes of the acquired company (NOLs, unused tax
credits or step-up asset basis) and abnormal returns obtained from both-side shareholders
following the announcement period, suggesting that tax attributes could be a motivation
for acquisitions.
Potential gains arising from tax attributes can represent an increase in value of the
combined firm, in the form of higher premiums paid by the acquired company12. Moore
and Pruitt (1987) conclude that higher merger premiums at the announcement date are
not due to tax motivation13, arguing that NOLs are priced in capital markets and are
partially reflected in the shares price of loss firms. Kaplan (1989) have estimated the
importance of tax benefits in premiums paid of 76 Management Buyouts (MBO) and
concluded that these tax benefits were a significant source of wealth for MBO operations.
The value of tax benefits (mostly from interest deductions) represented between 21% and
142,6% of the premium paid to pre-buyout shareholders, which is a wide and surprising
range14. Erickson and Wang (2007) found that target´s organizational form influences the
premium paid by the acquirer. By comparing two different organizational forms (S and
C), they concluded that S corporations have higher premiums comparing to C
corporations, once the sale can generate future tax deductions for the acquirer.15 Sherman
11 Previous studies presented by Auberbach and Reishus were subjected to many restrictions. 12 See Gaugan (2015).
13 With anti-merger tax-credit transfer provisions (TRA 1986), incentives for profitable firms to merge
with loss firms were reduced due the probability of unused NOLs to expire.
14 Moreover, the capital gains tax liability from the shares sold by pre-BO shareholders, represented 15%
of the premium.
9
(1972) pointed important tax advantages arising from conglomerate mergers, associated
with the use of debt and better growth opportunities16.
Potential tax benefits associated with unused tax losses and credits, increasing leverage,
organizational structures can motivate merger and acquisitions activity and can usually
be reflected in higher premiums paid by the acquirers. More recently tax avoidance has
been studied as a consequence of M&A, rather than a determinant of such operations.
2.2 Tax avoidance following M&A
There is extent literature about multinationals tax avoidance activity around the world,
mainly from US-based companies. Corporate tax avoidance can be defined as all tax
planning transactions that clearly reduce the tax burden of a company. Usually,
multinational firms are structured by a parent in a country with a specific tax jurisdiction
and foreign affiliates with a different tax jurisdiction. Typically, these foreign affiliates
are located in countries with lower statutory tax rates (tax havens) that can be very
attractive for the parent to incur in some tax planning schemes to reduce its combined tax
burden. As previously mentioned, US is one of developed countries with higher statutory
tax rate (35%) and one of the few with a worldwide taxation system17. Contrary to most
of the developed countries, where foreign income is only taxed in the foreign country, US
multinationals pay additional taxes from the income of their foreign subsidiaries when
the income is repatriated to the US.18 Clearly, this system makes US companies less
competitive when compared with countries with an exemption tax system19. Hence, US
multinational firms are increasingly becoming more tax aggressive and entering in tax
16 Conglomerates offer better growth and expansion opportunities, using its earnings instead of paying
dividends, subjected to high capital gains tax rate.
17 According to EY (2015) report, only 6 out of 34 OECD countries have a worldwide taxation system. 18 The additional tax paid from foreign income is called repatriation tax rate.
19 Dividends from foreign business activities usually are not taxed under tax exemption system (See ICC
10
schemes and tax planning to avoid taxes20. Cross-border M&As might offer an
opportunity for corporate tax avoidance. Huizinga and Voget (2009) have studied the
effect of international tax system on the structure of cross-border M&A operations. They
found that international double tax liabilities21 affect the organizational structure of
multinationals after cross-border M&A. Moreover, concluded that countries with low
level of double taxation are more likely to attract parent firms. Barrios et al. (2012) found
surprising conclusions about the importance of taxes on foreign subsidiaries location. The
authors conclude that the combination of foreign income taxation and supplementary
parent income taxation are independent and may disincentive the foreign subsidiary
location choice22. Huizinga et al. (2012) evaluate the impact of additional international
taxation on the target company. The authors concluded that target shareholders bear the
total additional international taxation resulting from the cross-border transaction. Total
tax costs of the operation are fully supported by target shareholders, not affecting
acquiring shareholders. Becker and Fuest (2010) found that in M&A operations, tax credit
system23 possibly is not optimal and that exemption system can take parent companies to
overinvest in low tax countries.
As previously defined, corporate tax avoidance is referred as all tax planning transactions
that explicitly reduce the amount of taxes paid by a company. Concepts such as tax
shelter, tax aggressiveness, tax planning and tax evasion are strongly associated with the
notion of tax avoidance (Hanlon & Heitzman, 2010). There are several measures of tax
avoidance present in the literature. The most widely measure used in the literature to test
20 See Klassen and Laplante (2012).
21 These international tax liabilities represent non-resident withholding taxes.
22 This result is explained by the option of parent company to defer taxes paid on foreign income until
being repatriated.
23 Tax credit system allow companies to receive a tax credit from taxes paid on foreign income. Tax
11
evidence of changes in corporate tax avoidance is the effective tax rate (ETR). Rego
(2003) have studied if economies of scale for international operations result in more tax
avoidance opportunities. The author found evidence of economies of scale for tax
planning. The author adds that while larger firms have higher ETRs24, multinational firms
with greater pre-tax income and more extensive foreign operations exhibit lower ETRs.
Mills et al. (1998) have analyzed how much firms invest in tax planning. Similarly, the
authors concluded that larger firms invest less in tax planning than smaller firms.
Moreover, firms with foreign operations also spend more in tax planning than firms with
no foreign activity. Dyreng et al. (2010) found that the levels of corporate tax avoidance
can be highly influenced by executives. The authors observed that corporate tax
avoidance is more pronounced with the entry of the executive and that, ends after the
executive leaves the company. Arguing that top executives can effectively manage firm
tax expenses reducing ETR ratios.
There is no accordance in the literature as to whether leverage increases following an
M&A. Ghosh and Jain (2000) empirically found strong evidence of higher financial
leverage levels following mergers. The authors have observed an average (permanent)
increase of 17% comparing to leverage levels of the combined firm before the merge25.
Nevertheless, Graham and Tucker (2006) concluded that firms that engage in tax shelters
have less debt ratios. The authors add that interest tax deductibility benefit is much lower
than the tax savings generated by tax shelters, being seen as substitutes for tax purposes.
Multinational tax avoidance activities are strictly associated with advantages that
different tax jurisdictions countries typically offer (Schwarz, 2009). Multinationals firms
(MNFs) have the advantage to shift generated income between countries with different
24 Larger firms have higher ETRs due to political costs.
12
tax jurisdiction26. Income shifting can be made by setting intra-firm transfer prices on
parent-affiliate operations, by choosing intellectual property location or by planning the
moment when foreign income received is repatriated27. MNFs can shift income by
increasing (decreasing) export prices to high-tax regions (tax havens)28. Clausing (2003)
found that country´s tax rate affects significantly the intra-firm trade prices. Intangible
assets transfer offers a unique opportunity for income shifting strategies (Karkinsky &
Riedel, 2012). Since intellectual property, like patents, are not a homogeneous good, it is
more difficult to have a comparable market price for such transaction, according to
arms-length principle. Governments are extremely concerned with MNFs´ tax aggressiveness
to reduce, at any cost, their tax burden. Klassen and Laplante (2012) found evidence that
firms in US with lower average foreign tax rates are more aggressive income shifters due
to changes in US tax policy29. They estimated that, between 2005 and 2009, companies
with lower average foreign tax rates have shifted more $10 billion per year out of United
States30. The high statutory tax rate imposed by US government can be the origin of
increasingly tax avoidance activity of US firms. Clausing (2009) found evidence of the
tax rate-gap between US and foreign countries being the responsible of increasing tax
avoidance incentives and revenue lost, pointing formulary apportionment of international
income as a solution for income shifting. EY (2015) report estimated the impact of a
reduction in US statutory corporate tax rate on cross-border M&A. A reduction of 10 ppt
in statutory corporate tax rate would avoid that 1,300 US companies and affiliates left to
OECD foreign acquirers: “…Unites States would have shifted from a $179 billion deficit
with OECD countries to a $590 billion surplus, a $769 billion shift”.
26 See Huizinga and Laeven (2008) and Bartelsman and Beetsma (2003) 27 (e.g. United States)
28 High-tax affiliates decrease pre-tax profit while tax heaven affiliates increase their profitability. 29 Decrease of regulatory costs, less IRS audit intensity and increase in transfer-pricing enforcement
activities out of US.
13
In the last years, it has been observed an increasingly pattern of cross-border M&A tax
inversion deals. A cross-border M&A tax inversion occurs when parent firm moves its
headquarters to a foreign country, so that the foreign firm becomes the “parent”. Clearly,
these agreements have emerged for tax purposes (Marples & Gravelle, 2014). By
changing its headquarters to a low-tax country, the combined tax rate of the merged
company reduces significantly. Desai and Hines (2002) have investigated the
determinants of corporate inversions. They concluded that larger and more leveraged
firms are more likely to invert. Countries such as Cayman Islands, Bermuda, Panama or
British Virgin Islands have no corporate income tax rates, being considered pure tax
havens31. However, other countries in Europe, like Ireland, Netherlands or Liechtenstein,
though not being considered pure tax havens, have very low corporate income tax rates32.
Desai et al. (2006) have studied the reasons for transactions in tax havens. The authors
found that the affiliates were allocated in large tax haven countries with the purpose of
transferring taxable income.
Although there is extent literature showing evidence of tax avoidance strategies of
multinational companies among countries, few studies present tax avoidance strategies as
consequence of M&A activity. Belz et al. (2013) have studied changes in tax avoidance
of targets of European M&A. They have observed a 3% decrease in target´s ETR
following M&A and even, an 8% decrease for tax aggressive acquirers. However, this
result was obtained graphically, so there is no empirical proof that, effectively, exist tax
avoidance following M&A deal.
To sum up, there are several potential tax benefits that companies can acquire through a
M&A agreement. Empirical studies show that multinational firms engage in tax
31 See Kudrle (2016).
14
avoidance activities to reduce its tax burden. Although it is claimed that these operations
are done with tax motivation in mind, there exist still lack of evidence on the literature
proving it.
2.3 Research Hypotheses
The purpose of this research is to search for evidence as to whether the level of corporate
tax avoidance increases following an M&A operation. Is this evidence more pronounced
for cross-border M&As operations? Can M&A deals between companies from the same
sector provide tax synergies? Do some companies provide better tax conditions for M&A
(e.g. lower tax rates, net operating losses)?
A concurrent paper by Belz et al. (2013) analysed the change in target´s ETR before and
after deal, and found evidence of a 3% reduction following the deal. Nevertheless, their
paper only documents such change graphically and such effect is only found for the target,
thus it is relevant to perform a deeper analysis. The first research hyphotesis is as follows:
H1: There is a decrease in acquirer´s effective tax rate following a M&A deal.
Companies from same industry may have potential gains arising from M&A operation as
reducing competition, economies of scale or increasing market power. Ciobanu et al.
(2014) concluded that companies being from similar industry increases the probability of
a success takeover. Devos et al. (2008) have estimated synergy gains arising from M&A.
The authors found that tax savings represented 1.64% of additional gain, while operating
synergies represented the remaining 8.38%. Thus, companies from the same industry,
can also save higher amounts of taxes, which motives our second research hyphotesis:
H2: There is a decrease in acquirer´s effective tax rate following the M&A deal if both
15
International tax rate differences among countries can influence the location of FDI and
M&A flows. Erel et al. (2012) concluded that international tax differences were an
increasing function of attractiveness of FDI. Hence, companies with lower tax rates can
be seen as more desirable targets to engage in tax avoidance strategies. This suggests the
following hypothesis:
H3: There is a decrease in acquirer´s effective tax rate following the M&A deal if, in the
year before the M&A deal, the acquirer´s level of the tax avoidance is higher than the
target´s level of corporate tax avoidance.
The literature relates frequently the impact of potential tax attributes that companies have,
on M&A operation. If a target firm has operating tax losses, these losses can be transferred
to the acquirer, or vice-versa, in order to reduce its earnings (e.g. Auberbach & Reishus,
1987). By offsetting the taxable income of the acquirer firm, it allows the acquirer to
reduce the effective amount of taxes paid. Hence, the fourth hyphotesis is the following:
H4: There is a decrease in acquirer´s effective tax rate following the M&A deal if target
company presents losses the year before the M&A deal.
Tracking the reasoning of H3, multinational firms can benefit from affiliates being located
in low tax countries to engage in tax avoidance strategies via income shifting. Companies
from certain industries can be strongly motivated to move their patents to low-tax
countries and then charge a fee or royalty to high-tax country affiliates (See Dyreng et al.
(2008)). As previously mentioned, it is difficult to establish the arm´s length principle for
intangible assets, making it easier to shift income for companies in specific industries.
Thus, the following hyphotesis is addressed:
H5: There is a decrease in acquirer´s effective tax rate following cross-border M&A
16
3
Empirical Research
3.1.1 Data
The initial sample comprises all completed European M&A available on Thomson
Reuters Eikon database occurred between 2005 and 2014. The period choice was based
on implementation of International Accounting Standards for European companies33,
which increases comparability. By European M&A, we understand operations where both
acquirer and target are European based. Several observations were excluded for the
following reasons: European special member state territories were excluded due to
restricted disclosure of financial data; we have also excluded deals where one or both
companies had no identification code, which is essential to collect and match the financial
data. All ownership percentages and forms of acquisition were considered in order to have
a significant number of deals in our sample. After these steps, a sample of 1,031 deals
was identified containing information about deal size, percentage acquired, transaction
form, company´s nation, company industry, announcement date, form of transaction and
company public status. The initial data covers 32 European countries, representing a total
transaction value of 975€ billion, in which 334 M&As are cross-border deals, totalizing
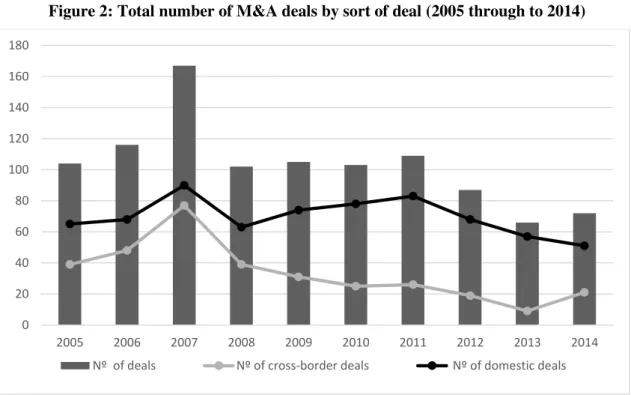
a transaction value of 404€ billion (41% of total transactions value). Figure 1 presents the
total value of M&A transactions during 2005 and 2014, and the split value for
cross-border and domestic deals. We can observe that 2006 was the year with higher value of
total transaction, with 245€ billion spent in M&A. The lowest year in transactions value,
was 2009, following the Global Financial Crisis. In Figure 2, it is observed that 2007 was
33 From 1 of January of 2005, European companies were obliged to prepare their consolidated financial
17
the year with more deals (167 deals) in the sample. After 2008, there is evidence of a clear
divergence between the number of cross-border and domestic deals in Europe.
With the deals identified, we have collected financial statements data for both acquirer
and target company for the same ten years, from 2005 to 2014, including headquarters
location. The country base of a firm can be different from the headquarters location, so
we deleted companies with headquarters out of Europe, in order to avoid possible
misleading results. After collecting all the necessary data, the two data bases were
merged, in order to associate the acquirer-target deal to its financial data. For the merger
process, we have considered only one deal of each acquirer and target company. Once the
merger was made by the identification code and by year, having more than one deal could
imply an erroneous merger of both databases. A final sample of 10-years financial
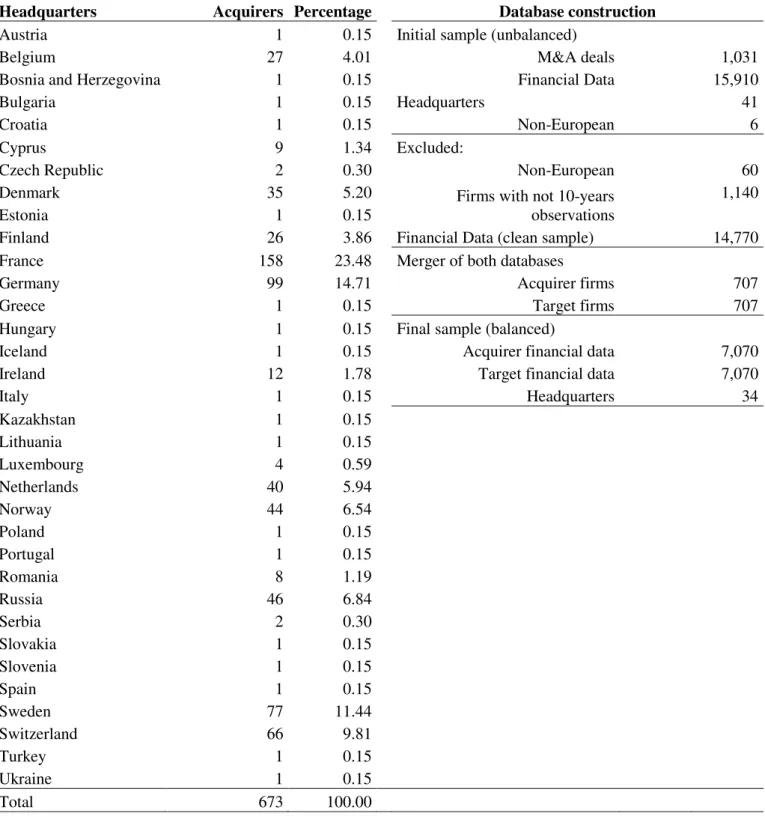
statement data was obtained for 707 deals, 226 of which are cross-border deals, from 27
different business sectors and 34 European countries. Because some variables used in this
study are not available for all years and deals, the sample was further narrowed to 359
deals. Table 1 summarizes the process described above, as the number of acquirer firms
per headquarters´ country.
3.2 Methodology
3.2.1 Measuring Corporate Tax Avoidance
In this research, to test our research hypotheses, three measures of tax avoidance were
applied, in a similar approach to Chen et al. (2010) study. The authors applied two tax
rate measures: Book ETR34 and Cash ETR, and two other book-tax measures: MPBT35
and DDBT36. Nonetheless, due to lack of available data, in this study only two of these
34 Also known as GAAP ETR in US context. 35 Manzon-Plesko (2002) book-tax difference.
18
tax rate measures are used: Book ETR and Cash ETR. Book ETR (BETR) is defined as
the ratio of income tax payable to EBT and was set as missing, when it assumed negative
values or when higher than 1. This measure “reflects the aggregate proportion of the
accounting income payable as taxes”37. The second measure, CASH ETR (CETR), is
equal to cash taxes paid divided by EBT. Contrary to BETR, this measure captures tax
deferral strategies38. These two measures of corporate tax avoidance only reflect
non-conforming tax avoidance, so we add a third measure which could reflect the non-conforming
tax avoidance: cash taxes paid divided by operating cash flow (CONFTAX). This measure
was initially proposed by Hanlon and Heitzmann (2010) and later tested by Salihu et al.
(2013). The authors found that this measure was statistically different from Book ETR
and Cash ETR39. The reason to apply all these different measures is trying to capture the
many features of tax avoidance from different companies, to get more consistent results.
All the three variables were truncated to range between 0 and 1.
3.2.2 Econometric Approach
The econometric analysis is based on corporate tax avoidance valuation model present in
literature but focused on M&A deals. This model is present in several studies such as
Rego (2003), Mills et al. (1998), Dyreng et al. (2010) or Gupta and Newberry (1997)
applied to different contexts. The standard model consists in explaining tax avoidance,
through ETR, as a function of different firm characteristics that work as control variables.
At first glance, to test the impact on acquirer’s tax avoidance measures following the deal,
we have created a dummy variable, D_afterdeal, which is equal to 1 from the year when
the deal occurs until (2014) the end of the sample. By including this variable, in a
37 See Salihu et al. (2013).
38 See Hanlon and Heitzmann (2010).
39 In non-conforming tax avoidance is assumed that firms reduce simultaneously taxable income while
19
difference-in-differences model we expect to capture potential tax avoidance arising from
the M&A operation itself and its effects during time.
To test our first hypothesis, the following difference-in-differences model was estimated
(equation 1):
𝑇𝐴𝑋𝐴𝑉𝑂𝐼𝐷𝑖𝑡 = β0+ β1𝐷𝐴𝐹𝑇𝐸𝑅𝐷𝐸𝐴𝐿𝑖𝑡+ β2𝑆𝐼𝑍𝐸𝑖𝑡+ β3𝐶𝐴𝑃𝐸𝑋𝑖𝑡+ β4𝐼𝑁𝑇𝐴𝑁𝐺𝐼𝐵𝐿𝐸𝑖𝑡+
β5𝐼𝑁𝑉𝐸𝑁𝑇𝑂𝑅𝑌𝑖𝑡+ β6𝐴𝐶𝐶𝑅𝑈𝐴𝐿𝑆𝑖𝑡+ β7𝑅𝑂𝐴𝑖𝑡+ β8𝑃𝑃𝐸𝑖𝑡+ β9𝐿𝐸𝑉𝐸𝑅𝐴𝐺𝐸𝑖𝑡+
β10𝐸𝑄𝑈𝐼𝑇𝑌𝑖𝑡+ β11𝑇𝑅𝑈𝑆𝑇𝑐𝑡+ ∑27𝑖=1𝜑𝑧+ ∑10𝑡=1𝛿𝑡 + ∑34𝑐=1𝛾𝑐+ ℰ𝑐𝑖𝑧𝑡 , (eq. 1)
where 𝜑𝑧 is industry fixed-effect specification for industry z; 𝛿𝑡is the time fixed-effect
variable for year t; 𝛾𝑐 represents country fixed-effect variable for country c and ℰ𝑐𝑖𝑧𝑡 is
the error term. TAXAVOID is the corporate tax avoidance measure representing each one
of the three measures explained above. To control firms´ characteristics, we have used
the following variables as proxies: LTOTALASSETS is equal to the natural log of total
assets of the firm and is used as a proxy for firm´s size, CAPEX is given by the ratio of
capital expenditures to total assets, INTANGIBLE is defined as goodwill divided by total
assets. INVENTORY represents inventory intensity measured as the ratio of inventory to
total assets, ROA is a measure of firms´ profitability, equal to the ratio of net income to
total assets, PPE represents capital intensity, defined as the ratio of property plant and
equipment (PP&E) to total assets, LEVERAGE is defined as long-term debt divided by
total assets. EQUITY is equal to equity of the company divided by total assets.
ACCRUALS is a measure of earnings management, and is given by the ratio of EBT to
operating cash flow, all divided by total assets lagged.This variable aims to control for
corporate tax avoidance derived from earnings management.40Lastly, we have included,
a country level variable, TRUST 41. This variable, which reflects the trust in government,
40 See Desai and Dharmapala (2009)
20
is a proxy for the culture of a country. Robinson and Slemrod (2012) include several
economic, political and culture measures to study the determinants of tax system variation
among countries. The authors found that TRUST was the most reliable determinant of tax
system variation.
To test the effect of M&A between companies from the same industry sector on acquirer´s
tax avoidance, we have included, in equation (2), the variable D_afterdeal_indust42 :
𝑇𝐴𝑋𝐴𝑉𝑂𝐼𝐷𝑖𝑡 = β0+ β1𝐷𝐴𝐹𝑇𝐸𝑅𝐷𝐸𝐴𝐿𝑖𝑡+ α1𝐷𝐴𝐹𝑇𝐸𝑅𝐷𝐸𝐴𝐿𝐼𝑁𝐷𝑈𝑆𝑇𝑖𝑡+ 𝐶𝑂𝑁𝑇𝑅𝑂𝐿𝑆 + ℰ𝑐𝑖𝑧𝑡
(eq. 2) in which the same controls from equation (1) are used for all the equations.
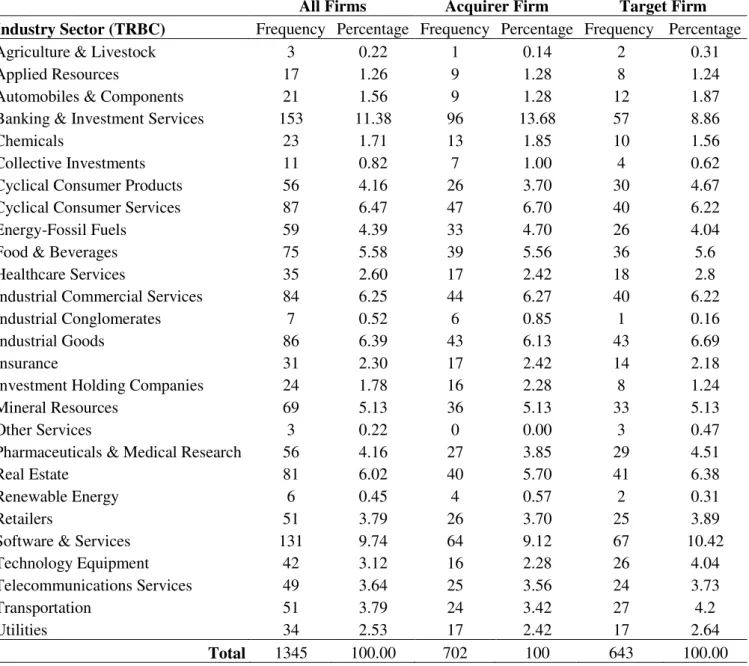
In Table 2, it is illustrated the industry sectors included in our sample, sorted by acquirer
and target firm. We can observe that the higher number of firms belong to Banking &
Investment Services (153), Software and Services (131) and Cyclical Consumer Services
(87).
Equation (3) aims to test the relationship between acquirer’s tax avoidance measures and
D_afterdeal_Taxavoidt-1, which is given by the interaction of D_afterdeal and target´s
Taxavoid measure the year before M&A. This variable is equal to 1 when the target´s
Taxavoid measure is lower than acquirer´s Taxavoid the year before the deal, and 0
otherwise. The economic reason for this hypothesis is that companies with lower tax rates
can be seen as more desirable targets to engage in tax avoidance strategies. Each target´s
Taxavoidt-1 measure corresponds to the same acquirer´s Taxavoid measure:
𝑇𝐴𝑋𝐴𝑉𝑂𝐼𝐷𝑖𝑡 = β0+ β1𝐷𝐴𝐹𝑇𝐸𝑅𝐷𝐸𝐴𝐿𝑖𝑡+ α1𝐷𝐴𝐹𝑇𝐸𝑅𝐷𝐸𝐴𝐿𝑇𝐴𝑋𝐴𝑉𝑂𝐼𝐷𝑖𝑡 + 𝐶𝑂𝑁𝑇𝑅𝑂𝐿𝑆 + ℰ𝑐𝑖𝑧𝑡
(eq. 3)
42 Given by the interaction of D_afterdeal and indust, in which indust is equal to 1 if both acquirer and
21
The fourth model assesses the potential benefit of target´s negative pre-tax income one
year before deal in acquirer´s tax avoidance. Potential tax losses could be transfer from
the target to the acquirer, or vice-versa, in order to reduce its earnings (e.g. Auberbach &
Reishus, 1987). To achieve this result, it was included D_afterdeal_loss43, where loss is
equal to 1 when target´s pre-tax income one year before deal is negative and 0, otherwise.
Equation (4) is the following:
𝑇𝐴𝑋𝐴𝑉𝑂𝐼𝐷𝑖𝑡 = β0+ β1𝐷𝐴𝐹𝑇𝐸𝑅𝐷𝐸𝐴𝐿𝑖𝑡+ α1𝐷𝐴𝐹𝑇𝐸𝑅𝐷𝐸𝐴𝐿𝐿𝑂𝑆𝑆𝑖𝑡+ 𝐶𝑂𝑁𝑇𝑅𝑂𝐿𝑆 + ℰ𝑐𝑖𝑧𝑡
(eq. 4) To evaluate the potential impact in tax avoidance after an international M&A operation,
we have included an interaction variable, D_afterdeal_domest, where domest isequal to
1 if the operation is domestic and 0 if the operation is cross-border. The resultant equation
(5) is presented below:
𝑇𝐴𝑋𝐴𝑉𝑂𝐼𝐷𝑖𝑡 = β0+ β1𝐷𝐴𝐹𝑇𝐸𝑅𝐷𝐸𝐴𝐿𝑖𝑡+ α1𝐷𝐴𝐹𝑇𝐸𝑅𝐷𝐸𝐴𝐿𝐷𝑂𝑀𝐸𝑆𝑇𝑖𝑡 + 𝐶𝑂𝑁𝑇𝑅𝑂𝐿𝑆 + ℰ𝑐𝑖𝑧𝑡
(eq. 5) Lastly, we have extended our analysis, regarding the combined effect of both firms being
from the same industry sector and the target company having operational losses one year
before the deal. To test this effect, we have created an interaction variable,
D_afterdeal_indust_loss, which represents the interaction between D_afterdeal,
D_indust and D_loss44. Equation (6) is illustrated below:
𝑇𝐴𝑋𝐴𝑉𝑂𝐼𝐷𝑖𝑡 = β0+ β1𝐷𝐴𝐹𝑇𝐸𝑅𝐷𝐸𝐴𝐿𝑖𝑡+ α1𝐷𝐴𝐹𝑇𝐸𝑅𝐷𝐸𝐴𝐿𝐼𝑁𝐷𝑈𝑆𝑇_𝐿𝑂𝑆𝑆𝑖𝑡+ 𝐶𝑂𝑁𝑇𝑅𝑂𝐿𝑆 + ℰ𝑐𝑖𝑧𝑡
(eq. 6) Table 3 describes the variables applied in the econometric approach and the respective
coefficient sign that is expected.
43 Interaction between D_afterdeal and loss.
44D_indust is a dummy variable, which is equal to 1, if both target and acquirer are from the same
22
3.2.3 Descriptive statistics
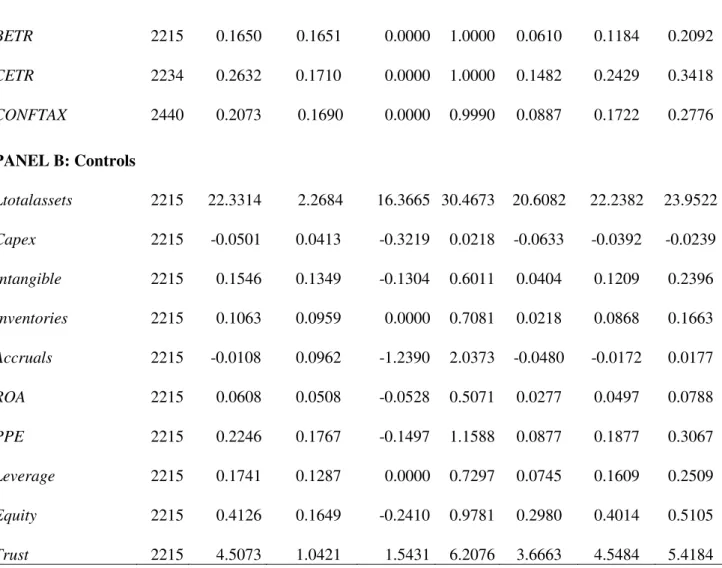
Table 4 summarizes statistics description of the variables used in the equations described
above45. Regarding the three tax avoidance measures, acquirer´s BETR mean is equal to
16.5%, the lowest of three, with CETR and CONFTAX means being equal to 26.3% and
20.7%, respectively. The standard deviation of this 3 measures are significantly high with
0.165, 0.171 and 0.169, respectively. It should be noted that the value for ROA is equal
to 0.061, which means that the average acquirer presents a positive net income. The
average level of leverage ratio of acquirer is equal to 0.174, which means that 17.4% of
total assets is long-term debt. Equity´s mean (median) ratio is equal to 0.415 (0.401),
which mean that, on average, investors own 41.5% of total assets of the firm46.
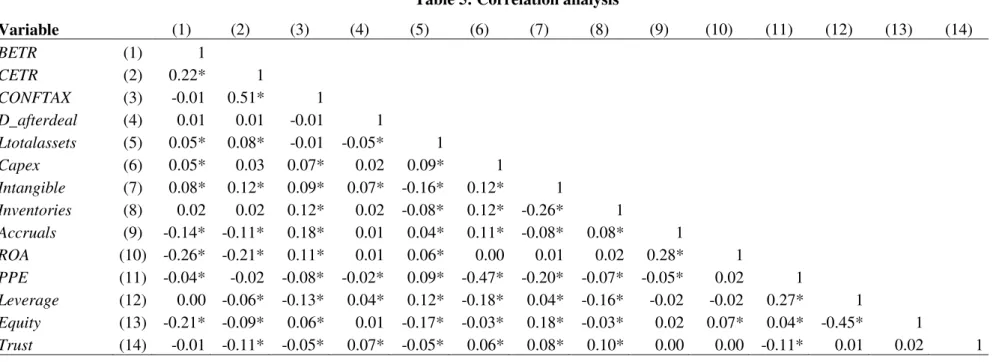
In Table 5, it is represented the coefficients of the pairwise Pearson correlation between
the main variables. All tax avoidance measures seem to be statistically related with each
other, expect BETR with CONFTAX. ROA and TA are negatively related with BETR and
CETR. Regarding previous literature of the relation between BETR and firm level control
variables, there seems to exist a consistent relationship. For example, LTOTALASSETS is
positely correlated (correlation 0.05; p-value 0.00) with BETR, while EQUITY is
negatively correlated (correlation -0.210; p-value 0.00) with BETR.
4
Results
Tables 6 to 10 present the initial results for our research hypotheses. The regression
analysis is conducted using three different alternative proxies for corporate tax avoidance:
BETR, CETR and CONFTAX47. In Table 6, three equations are performed, which
45 The descriptive statistics of control variables correspond to BETR as the tax avoidance measure
applied.
46 Although LEVERAGE and EQUITY are highly correlated, we find no evidence of multicollinearity. 47 An additional measure for long-run cash tax avoidance was tested. However, it was not included
23
correspond to H1. From Table 7 to 10, interaction variables described above are added to
the equations from Table 6, according to the remaining hypotheses. Additional tests were
performed for a more reliable analysis of the results. To test the specification of the model,
we have performed the Ramsey regression specification-error test (RESET) for omitted
variables, and we concluded that all regressions had no omitted variables. For spurious
regression diagnostic, we have performed a Durbin-Watson test for all regressions. No
evidence of spurious regression was found. We have also tested for the multicollinearity,
and no evidence of multicollinearity was found for all the regressions48. To control
heteroskedasticity, we have used Huber-White estimator to obtain robust standard
errors49.
4.1 Hypotheses Results
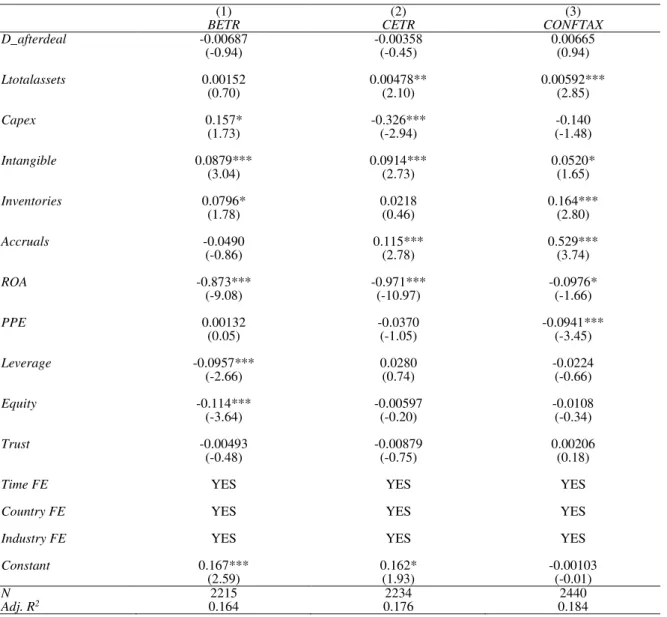
4.1.1 Tax avoidance following M&A deal
Focusing on Table 6, we can observe a negative coefficient for D_afterdeal variable, in
columns (1) and (2), when using BETR and CETR. Although the sign is consistent with
our hypothesis, there is no statistical evidence of higher corporate tax avoidance for the
acquirer following an M&A operation. Belz et al. (2013) found, graphically, a decrease
of ETR after the deal but for the target company. Overall, although taxes might influence
a M&A operation, it is inconclusive as to whether, the overall level of corporate tax
avoidance is affected by an M&A deal.
Regarding the control variables, summarizing the impact of the control variables in our
tax avoidance measures, it is observed that Ltotalassets is positive for all 3 measures,
although it is statistically significant only when CETR and CONFTAX are applied. This
48 Applying the variance inflation factor (VIF), VIF values for coefficient were never higher than 3, except
for equation (6), in which D_afterdeal presented a VIF approximately equal to 4.
24
result is consistent with the literature (e.g. Rego, 2003; Zimmerman, 1983) which
suggests that larger firms support higher tax burdens. For Capex, there is statistical
evidence of positive relationship with BETR, which is consistent with Dyreng et al.
(2010). Acquirers with higher levels of capital expenditures seem to have higher book
ETRs. However, with CETR, it has a negative and significant relationship. Intangibles
as described above are given by the ratio of goodwill to total assets. We find evidence of
a very significant and positive relationship with all tax avoidance measures.It seems that
acquirers with high amounts of subscribed goodwill in their financial statements, face
higher tax burdens. There is extent literature about goodwill, in the context of business
combinations, regarding the valuation of these intangibles in purchase premiums.
International Financial Reporting Standard 3 (IFRS 3) establishes the principles and
requirements that acquirers should apply to measure goodwill. An accurate measurement
of goodwill isn’t simple once, first, it is difficult to assign a discrete value for these assets,
and second, it is not easy to know how changes in value should be treated after their
recognition in financial statements50. For Inventories, there is a positive and significant
relationship with BETR and CONFTAX. This result is consistent with Gupta and
Newberry (1997) contrary to Mills et al. (1998), who found no consistent relationship
between inventory intensity and tax expenditures. For ROA, there is statistically evidence
of a negative relationship with the three measures. This is consistent with Mills et al.
(1998) that more profitable firms engage in more tax planning activities. Accruals, as
measure of earnings management, it is significantly and positively related with CASH
ETR and CONFTAX.
50 See Abeysekera (2012). Norbäck et al. (2009) also found that goodwill treatment had impact in foreign
25
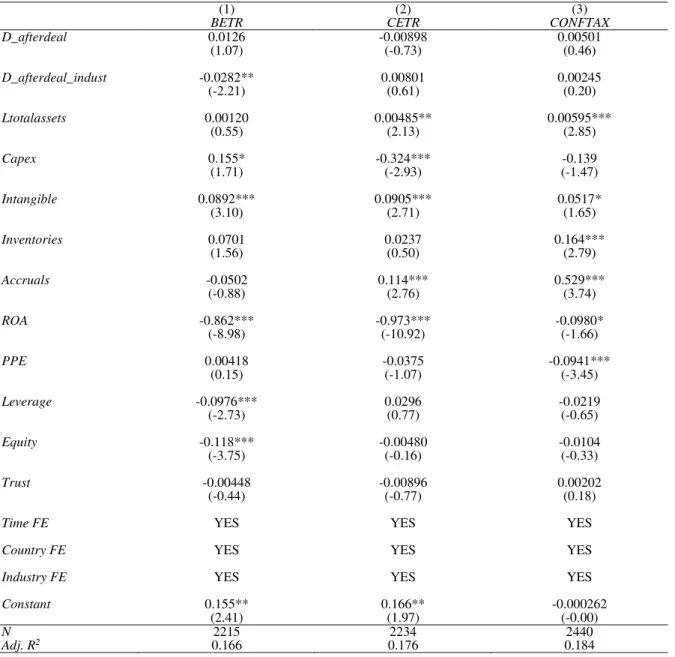
4.1.2 Tax avoidance following M&A deal in the same industry
The second research hypothesis is tested in Table 7, by adding an interaction variable
between D_afterdeal and D_industry. We find statistical evidence of an inverse
relationship between D_afterdeal_indust and BETR, in column (1). The result suggests
that, ceteris paribus, acquirer´s BETR decreases by, approximately, 3% after deal, if both
acquirer and target belong to the same industry sector. These results are consistent with
Fee and Thomas (2004) findings, who found evidence of stronger operating performance
the year after the merge, for a sample of horizontal mergers. Healy et al. (1992) found
evidence of higher operating cash-flow after merger, for a sample of US firms.Although
not tabulated, the average EBT for all the acquirers from horizontal M&As, in our sample,
is equal to $3.06 billion. Thus, for horizontal M&A operations, a decrease in BETR of 3%
would represent, on average, $0.09 billions of tax savings for the average acquirer.
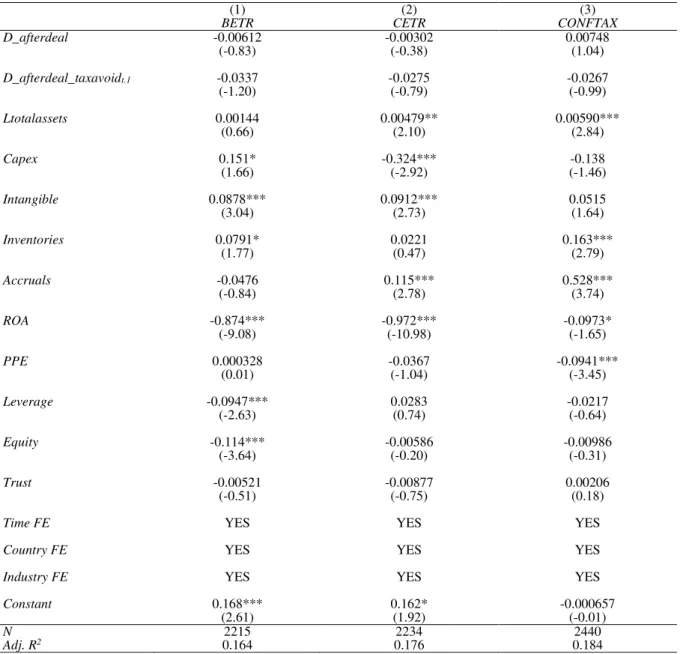
4.1.3 Tax avoidance following M&A deal when target has lower ETR
Table 8 tests H3, which aims to test whether acquirer´s effective tax rate decreases if the
target´s effective tax rate is lower one period before deal. The results suggest that there is
no evidence of lower level of corporate tax avoidance following M&A operation when,
the period before, acquirer´s ETR is higher than target´s ETR. The three tax avoidance
measures exhibit a negative sign, however, none presents statistical significance. In order
to better understand this ambiguous result, an untabulated analysis was performed by
computing the mean of each tax avoidance measure, for both acquirer and target, one year
before the deal. The mean difference among companies varies between 1% and 2%, in
26
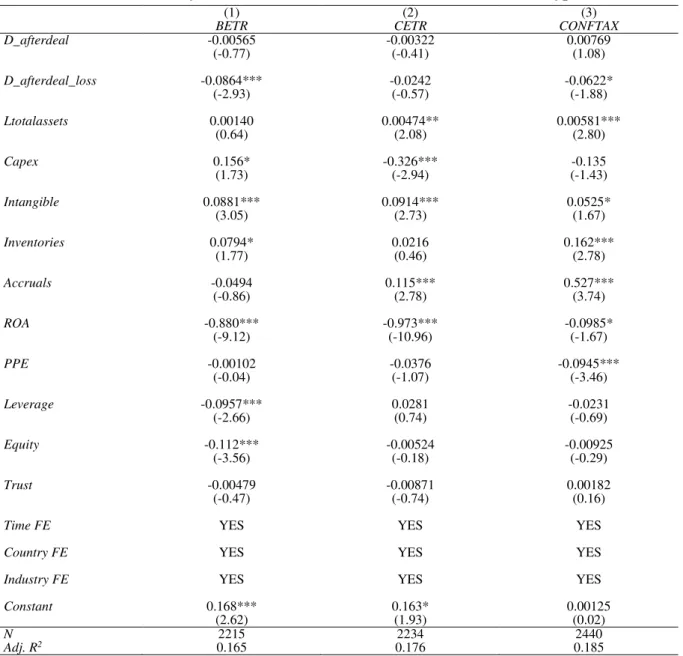
4.1.4 Tax avoidance following M&A deal when target has negative pre-tax profit
The fourth hypothesis, in Table 9, assesses whether the acquirer´s level of corporate tax
avoidance increases if the target company presents negative pre-tax profit in the period
pre-deal. We found statistical evidence of lower tax burden for the acquirer company if
the target presents a negative pre-tax profit the period before deal. In all estimations,
D_afterdeal_loss exhibit a negative sign, which is statistically significant when BETR
and CONFTAX are applied. Based on the results, it is expected a decrease in ETR between
6% and 9% for the acquirer company following the M&A deal. Our results are consistent
with previous findings, such as in Auberbach and Reishus (1986;1987;1988) studies, who
found evidence of potential gains in merger activity arising from transference of tax
attributes from one company to offset the losses of the other, and Hayn (1989), who
argued that tax attributes could be an important driver for acquisitions. Consistent with
this findings, is the idea that target NOLs carryforwards can be seen as an economic asset
for the target company, in the sense that can reduce the amount of taxes paid in the
future51.
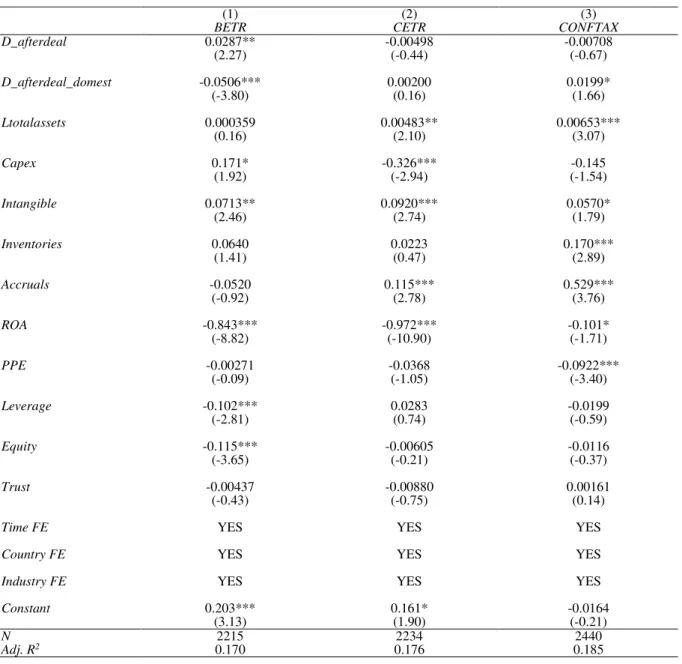
4.1.5 Tax avoidance following cross-border M&A deal
Table 10 presents our final hypothesis (H5), which assesses whether acquirer´s tax burden
is lower when the deal is cross-border, in contrast with domestic ones. The results
obtained evidence ambiguous conclusions for this hypothesis. On one hand, the results
present a negative relation between BERT and D_afterdeal_domest, which means that
acquirer´s BETR will decrease after deal, if the operation is made between companies
operating in the same country. This result can possible be explained by the increase of
market power in acquirer´s country, leading to a stronger operational performance
27
deal. However, it is contrary to the theory that companies from high-tax jurisdiction enter
in M&A deals with companies from low-tax countries, in order to reduce the amount of
taxes paid via income shifting (e.g. transfer prices). Erel et al. (2012) found that taxes
seem to influence cross-border mergers decision, once acquirer is usually from a
higher-tax jurisdiction country than target. It is important to note that, the authors have included
mergers from companies all over the world, while in this research, only European M&A
were included. The average corporate tax rate difference between all acquirer´s and target
firms for our sample, corresponds to 0.4%, which is quite low. On the other hand, when
we use CONFTAX, in equation (3), a statistical evidence of a positive effect between
CONFTAX and D_afterdeal_domest is found. This result suggests that, acquirer´s
CONFTAX will decrease by 2% whether the deal is cross-border. Overall, the results
obtained are inconclusive, once different tax avoidance measures give different
conclusions, regarding the effect of the deal be cross-border or domestic.
4.1.6 Further analysis
Based on the results obtained in H2 and H4, a further analysis was performed. In Table
11, we tested jointly whether there is evidence of tax avoidance, when acquirer and target
belong to the same industry sector and the target company presents operational losses the
year before the deal. The results evidence a negative relationship between
D_afterdeal_indust_loss and BETR. In column (1), this result suggests statistical evidence
of a 9% decrease in acquirer’s BETR, meaning that ETR decreases even further for deals
in which both companies operate in the same industry and the target has losses in the year
pre-deal.
4.2 Robustness Checks
To access the robustness of our results, we have performed several sensitivity analyses.
28
relationship with tax avoidance were introduced. The literature refers many times the
relationship between horizontal mergers and anti-trust policy. Many large firms enter into
anti-competitive horizontal mergers, in order to eliminate competition and increase its
market power (Lee, 2013). These operations, made by monopolistic firms can seriously
affect the efficiency of the market. Anti-trust laws play a relevant role by maintaining the
basic rules of competition, in order to avoid these monopolistic practices52. Thus, a
measure of effectiveness of anti-monopoly policy (Anti-trust), for each country was added
as component of domestic competition. A proxy for the macroeconomic environment of
a country (Macroeconomic) was introduced. Erel et al. (2012) found that macroeconomic
performance could make cross-border M&A more attractive for acquiring firms. Choi
and Jeon (2011) also found a long-run equilibrium relationship between some
macroeconomic variables and merger activity. The variable Macroeconomic is a
composition of several indicators of the country53. The quality and strength of accounting
standards affects the volume of M&A activity, once it is fundamental, a good disclosure
for the identification of potential targets (Rossi & Volpin (2004)54. Bris and Cabolis
(2008) have built some measures of change in investor protection. The authors found a
positive relationship between the quality of shareholders´ protection and accounting
standards in acquirer´s country and the merger premium paid in cross-border deals,
relatively to domestic deals. Thus, the variable Accounting was added as a measure of
strength of auditing and accounting standards. Finally, we introduced the variable R&D,
which reflects the level of R&D spending by companies in a country, relative to
international peers. Bertrand and Zuniga (2006) found that international M&A operations
52 Anti-competitive practices such as predatory pricing and exclusive dealing (See Armstrong and Porter,
2007).
53 This variable includes government budget balance, gross national savings, inflation, government debt
and country credit ranking, all taken from Global Competitiveness Report.
54 The authors used an index of the quality of accounting standards as a proxy for investors protection
29
can stimulate R&D expansion. Furthermore, several countries have tax incentive policies
for companies to increasing their R&D expenditures55. Additionally, for this analysis,
deals involving companies from the financial sector56 were excluded, once this sector has
to follow different regulations that non-financial firms. In Table 12, we test the robustness
of H1, and it is observed that the inclusion of the new variables does not change the initial
conclusions. Moreover, although not tabulated, all other hypotheses were tested and we
found that all initial results are robust. Analyzing the effect of the new variables on tax
avoidance measures, Anti-trust appears to be negatively related with CETR and
CONFTAX. This result indicates that the higher the level of effectiveness of
anti-monopoly policy in acquirer’s country, the lower the amount of taxes paid by the acquirer
firm. For R&D, there is statistical evidence of a positive relationship with CONFTAX,
indicating that the higher the level of R&D spending in acquirer´s country, the lower the
level of conforming tax avoidance.
In order to triangulate our results, a factor analysis was performed. It is based on a
principal component analysis, in which the three tax avoidance measures were
incorporated into a one single factor. Table 13 presents the results obtained in this
analysis. The results suggest that D_afterdeal_loss, D_afterdeal_domest and
D_afterdeal_indust_loss seem to be negative and statistically significant when all
measures are combined, which is consistent with our initial findings. Nevertheless, the
coefficient for D_afterdeal_indust does not appear to be statistically significant. The
effect of this variable is dissipated, when the three tax measures are combined into one
single factor.
55 European Commission set out investment in R&D as one of their 5 priorities to increase Europe´s
competitiveness (See Straathof et al., 2014).