Católica – Lisbon School of Business & Economics
Dissertation Research
Using Augmented Reality to Enhance
the Shopping Mall Experience
Candidate:
Filipe Lampreia Anes Estevens da Silva
Advisor:
Abstract
Title: Using Augmented Reality to Enhance the Shopping Mall Experience Author: Filipe Lampreia Anes Estevens da Silva
The objective of the present study is to understand if consumers would use an Augmented Reality application on their smartphones while visiting a shopping mall. This application would have several features that would boost the shopping mall experience.
In order to access the acceptance of this technological hypothesis an online survey was conducted to extract empirical data from a reliable sample.
This empirical data is analysed and characterized with some descriptive statistics, as well as cross-tabulations between some variables. This analysis allows a better characterization of this sample, and the formation of preliminary conclusions fundamental to the final conclusion.
The results shows that most of the individuals in this sample are willing to use the features of the proposed technological hypotheses and, thus, would use the Augmented Reality application on their smartphones when visiting a shopping mall. Keywords: Augmented Reality, Shopping Mall, Shopping Center, Smartphones, Application, Promotion, Entertainment.
Resumo
Título: Using Augmented Reality to Enhance the Shopping Mall Experience Autor: Filipe Lampreia Anes Estevens da Silva
O objectivo do presente estudo é perceber se os consumidores usariam uma aplicação com Realidade Aumentada nos seus smartphones durante uma visita a um centro comercial.
Esta aplicação teria várias funcionalidades que melhorariam a experiência que é uma visita a um centro comercial.
De modo a avaliar a aceitação desta proposta tecnológica foi feito um questionário online a uma amostra fidedigna de onde se retiraram dados empíricos.
Estes dados foram analisados e caracterizados com recurso a algumas estatísticas descritivas e também ao cruzamento de algumas variáveis. Esta análise permitiu uma melhor caracterização da amostra, e a formação de conclusões preliminares fundamentais para a conclusão final.
Os resultados mostraram que a maioria dos indivíduos desta amostra estão dispostos a usar as funcionalidades desta proposta tecnológica e, deste modo, usariam a aplicação com Realidade Aumentada nos seus smartphones durante uma visita a um centro comercial.
Palavras-chave: Realidade Aumentada, Centro Comercial, Smartphones, Aplicação, Promoção, Entretenimento.
Acknowledgments
It would be impossible to write this dissertation without the guidance, patience, encouragement, and knowledge of my advisor Professor Paulo Cardoso do Amaral. I’m really thankful to him and glad that I chose his dissertation seminar to write my dissertation.
Moreover, I would also like to thank to my colleague and friend Vitor that helped me several times throughout the writing process with guidance, wise advices, and fruitful brainstorming sessions.
Equally, I show my appreciation to my friend Gabi that was a tireless proofreader. I also want to thank to my friends for their brotherly-love, their inspiration, and all the careless and relaxed moments of good fun. Particularly, I would like to say Thank You to Diogo and his family for their hospitality and great friendship.
Finally, I’m really grateful to my parents that made this master’s degree possible like many other stages of my life.
Table of Contents
Abstract ... ii
Resumo ... iii
Acknowledgments ... iv
Table of Contents ... v
1. Introduction ... 1
2. Literature Review ... 3
2.1 Chapter Introduction ... 3 2.2 Augmented Reality ... 32.2.1 Augmented Reality Definition ... 3
2.2.2 Augmented Reality displays and positioning ... 4
2.2.3 Mobile Augmented Reality Uses ... 5
2.3 Shopping Malls ... 10
2.3.1 Entertainment and promotional activities at Shopping Malls ... 10
2.4 Consumer E-Shopping Acceptance Model ... 11
2.4.1 Technology Acceptance Model (TAM) ... 11
2.4.2 The Consumer E-Shopping Acceptance Model ... 12
2.5 Chapter Conclusion ... 12
3. Technological Hypothesis, Research Methodology and Data
Collection ... 13
3.1 Chapter Introduction ... 13
3.2 Technological Hypothesis ... 13
3.2.1 The Reasons Behind This Technological Hypothesis ... 13
3.2.2 The Technological Hypothesis and How It Works ... 14
3.3 Research Methodology ... 16
3.3.1 Research Model ... 16
3.3.2 Research Question and its Hypotheses ... 18
3.4 Data Collection ... 20
3.4.1 Variables ... 20
3.5 Data Analysis Method ... 22
3.6 Chapter Conclusion ... 23
4. Results’ Analysis and Discussion ... 25
4.1 Chapter Introduction ... 25
4.2 Results’ Analysis ... 25
4.2.1 Data Characterization and Profile of the Sample ... 25
4.2.2 Independent Variables Representativeness ... 28
4.2.3 Control Variables Cross-Tabulations ... 29
4.3 Results’ Discussion ... 32 4.4 Chapter Conclusion ... 34
5. Conclusion ... 35
5.1 Main Conclusions ... 35 5.2 Study Limitations ... 37 5.3 Future Research ... 376. References... 38
6.1 References ... 387. Appendixes... 42
Appendix 1: H&M Fall/Winter 2010 campaign ... 42
Appendix 2: Esquire Magazine February Cover Girl ... 42
Appendix 3: 2013 Ford Escape Promotion Campaign ... 43
Appendix 4: Sony Pictures Home Entertainment Promotion of The Smurfs Movie DVD and Blu-Ray Release ... 43
Appendix 5: Nike Air Max Exclusive Edition Promotion at Finish Line Stores ... 43
Appendix 6: Examples of Aurasma Images with Markers to Activate AR Campaigns ... 44
Appendix 7: Survey Questions ... 45
Appendix 8: Respondents Profile Statistics Table ... 48
Appendix 9: Descriptive Statistics Table: Independent Variables & Motivational Control Variables ... 48
Appendix 10: Independent Variables Representativeness Table ... 49
Appendix 11: Crosstabs 1 – SM Customer Control Variable Charts ... 49
Appendix 12: Crosstabs 2 – AR Awareness Control Variable Charts ... 50
Appendix 13: Crosstabs 3 – Smartphone Owner Control Variable Charts ... 51
1. Introduction
The purpose of this dissertation is to understand to what extent are people willing to use their smartphones inside a Shopping Mall (SM) in order to have access to exclusive and general promotions, discounts, or other kind of prizes, on the adherent stores, such as clothing stores, retail stores, restaurants, coffee shops, cinema, etc.; an application with Augmented Reality (AR) would enable this feature and others like general information about the SM, its stores, products, and services; entertaining gaming experiences; guiding and touring; and virtual displays of products, services, and others.
This dissertation tries to comprehend if the market is ready to accept the merger of the different concepts of Augmented Reality, Smartphones, and a different kind of Product/Services Promotion in Shopping Malls.
Nowadays, almost everyone owns a smartphone or is thinking about acquiring one, this kind of device is taking over basic feature phones in most of the developed countries (Giles, 2011). Moreover, an IMS Research study (2011) expects that in 2011 will be sold 420 million smartphones, representing this number 28% of the handset market. The same study believes that by 2016, smartphones sales will reach half of the handset market passing thus the 1 billion milestone.
As time goes by, the smartphones also become smarter with new and more advanced components; like Central Processing Units, high-resolution camera and display, MEMS sensors such as accelerometer, GPS and solid-state compass; those components altogether enable technologies like AR (Pence, 2011), which allows users to interact with virtual objects positioned in the real world (Azuma et al., 2001). AR allows its users to connect the real world with the virtual world, through layers that place objects, images and other animations in the real scenario (Azuma et al., 2001).
The full potential of AR is enormous and yet to be fully discovered (Carmigniani et al., 2010), however, this dissertation is focused only on how it can be used by managers to promote a certain product or service within the confined space of a SM. One of the reasons why this dissertation topic was chose is because it is fascinating how shopping malls attract people, being this the shopping mall property managers ‘ and tenants’ major concern and challenge (Ooi and Sim, 2007).
It is known that both shopping streets and shopping malls need to have a good retail tenant mix and a good atmosphere to attract consumers (Teller, 2008), moreover, when looking for a shopping mall consumers take into account attributes like comfort, diversity, mall essence, convenience, luxury, and entertainment (Rajagopal, 2009). So, it is important to understand what would happen if we could join the concepts of Augmented Reality on Smartphones, Shopping Malls, and Product Promotion. To do that and because it is impossible to look at all the possible scenarios and possibilities, we must consider the following assumptions: the SM property management and the tenants are all willing to embrace the possibilities that AR can bring to their businesses (1), cooperating with each other (2) or on their own (3). It will be also assumed that the customers use smartphones and are aware of their capabilities (4); furthermore, as Rajagopal (2009) wrote in his article, entertainment is one of the attributes that consumers look for in a shopping mall and AR can be considered one way of it (5).
Consequently, the research question that this dissertation tries to answer is the following:
R.Q.: Are the consumers willing to use their smartphones to get access to promotions, other prizes, and general information in a shopping mall?
Concerning the structure, this dissertation has four main chapters. In the first one,
Literature Review, all the concepts that are relevant for the purpose of this
dissertation are analysed and explored. In the second chapter, Technological
Hypothesis, Research Methodology and Data Collection, the technological
hypothesis of this dissertation it is presented and explained, the research question is exposed and the subsequent hypotheses as well. It is also described how these hypotheses are tested and how the data is collected and analysed. In the last two chapters, Analysis’ and Results’ Discussion, and Conclusion, the results are discussed and conclusions are drawn.
2. Literature Review
2.1 Chapter Introduction
To do this dissertation it is important to analyse and review previous literature on Augmented Reality and some Shopping Mall and Retail dynamics: how retailers do their marketing, and also the importance of the entertainment factor while shopping in these areas to consumers. Therefore, this chapter summarises related works in these areas in order to better comprehend and clarify the elementary notions explored on this dissertation.
2.2 Augmented Reality
Throughout this section research done by others on Augmented Reality will be presented. It will be explained what AR is, what can be done with it, and what is actually being done.
2.2.1 Augmented Reality Definition
According to Azuma et al. (2001), AR can be simply described as a system that complements the real world with computer-created objects that seem to coexist with those on the real world. They also mention that an AR system has three basic properties: (1) it combines real and virtual objects in a real environment; (2) it is interactive in real time; and (3) it aligns real and virtual objects with each other. It is also important to mention that this definition is not exclusive to any particular AR capable hardware, nor it is limited to the sense of sight, once AR can and possibly will apply to all the others. Lastly, removing real objects or overlaying them with virtual ones – techniques known as diminished reality – is also considered AR.
Sharing a similar definition, Milgram and Kishino (1994) described, years before, AR as being part of a “Virtuality Continuum” (Figure 1) that connects two distinct
Figure 1 – Virtuality Continuum (Milgram and Kishino, 1994)
environments: totally real environment and totally virtual environment. To the space between these distinct points, they call it mixed reality and that is where AR can be found, a system where the real environment is augmented by virtual means, i.e. computer generated objects or other layers. Unlike Augmented Virtuality or Virtual Environments where the virtuality replaces the real world, in Augmented Reality the user can see the Real Environment with virtual objects making part of it or overlaying it (Azuma, 1997).
2.2.2 Augmented Reality displays and positioning
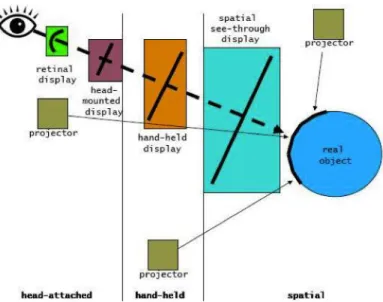
Some years ago, AR was considered to be useless and too expensive mainly due to its bulky hardware requirements (Pausch et al, 1997) as for instance the heavy backpack with a Head-Mounted Display (HMD). However, with the recent development of handheld technologies with video see-through display, AR devices such as smartphones became more affordable and available to the general public (Schmalstieg and Wagner, 2007). Thus, for its purpose, this dissertation will only focus on handheld devices with video see-through display (HDVSD). Nevertheless, it is important to mention that exist others ways to display AR and also to position it towards the user (Figure 2). Concerning the way that AR is displayed there are three
approaches:
(1) The video-see through display, which adding to the fact that is considered the less expensive, and easiest way to display AR, it has also other advantages as the
Figure 2 – Visual display techniques and positioning (Krevelen and Poelman, 2010)
fact that displays a digitised image, therefore, it is easier to edit the displayed image, i.e. change/remove objects from reality, adjust the brightness, and contrast of virtual objects according to reality stream;
(2) Optical see-through display, which leaves the real world as it is, and places virtual layers through transparent mirrors and lenses, an example of this kind of display can be the helmets used by air force pilots that superimpose vector graphics and other flight & navigation information above their view of the real world.
More limited than the other approaches, once it can only be used indoor, (3) is the one where the AR is projected in the real objects.
Regarding its position between the user and the real world AR displays can be separated in three categories:
(1) Handheld devices with video/optical see-through displays or projectors, which are considered the easiest way to introduce AR to the mass market once they have the lowest production costs and are more user-friendly;
(2) Head-worn displays that are attached to users’ head (HMD like helmets or virtual retinal display, for example);
Finally, (3) spatial displays that are placed statically in the environment, examples of this kind of display can be the spatial see-through display and projectors. (Azuma, 1997; Krevelen and Poelman, 2010)
2.2.3 Mobile Augmented Reality Uses
This section will cover how AR is being used in some areas that can be interesting for the purpose of this dissertation or are somehow related to it. Thus, it will mainly focus on examples of AR’s applications in HDVSD.
2.2.3.1 Navigation and Path-Finding
In 2006, Nartz et al. tested prototypes of video see-through PDAs and mobile phones in cars and with pedestrians. The results were good and the prototypes proved to be useful to guide the users till their destinations with virtual follow-me cars. Nartz et al. also proposed that in a near future these devices with AR navigation systems would have extra features as for example highlighting points of interest (gas station with fuel prices, garage, etc.) nearby, what actually happens (Reynolds et al., 2010), as well as applications like Augmented Driving that inform the driver of his current
velocity, if he is being overtaken by another car or even if he changes lanes by mistake1.
2.2.3.2 Landscape Labelling and Touring
In what concerns to “world reference” AR is today commonly used with smartphone applications that help users when they are walking around a city. These applications augment the reality with information labels about possible points of interest such as restaurants, cinemas, cultural curiosities, nearby bus stops, etc. These applications not only provide information about those possible points of interest but also allow its users to access other users’ reviews (Reynolds et al., 2010).
In early years, other authors studied the use of AR in cultural places, however, not with HDVSD but with other mobile devices. Höllerer et al. (1999), used AR to create an on-campus documentary, this documentary augmented the reality with flags and labels that the user could interact with if he was interested in what was being pointed out and thus read its content with historical information. In Olympia, Greece, Vlahakis et al. (2002) also tested the use of AR with the ArcheoGuide project that not only augmented the reality with historical information about the monuments but also allowed its users to see the destroyed temples where they once used to be. A similar system was also used in Pompeii, Italy, with virtual characters showcasing what happened as it was described on the site frescoes and history books (Papagiannakis et al., 2008).
2.2.3.3 Entertainment and Games
Most video games are constrained inside the computer, console, or hand-held device. All the action is focused on the screen where the virtual game is and on the other side is the player far from that reality, the user interaction is small, and even with technological breakthroughs like the system used by Nintendo Wii the interaction is still small and constrained by its remotes’ buttons.
On the on the other hand, AR enabled an all new gaming experience. The use of AR in games allowed the interaction between the real world and virtual objects: virtual objects and sounds are superimposed in the reality, and real objects are used thus they can control the virtual ones and vice-versa. (Oda et al., 2008)
2.2.3.4 Augmented Reality and promotion
Despite the fact that users can consider complex the use of AR to visualize advertising, researchers and marketers have acknowledged that more involvement and more interactivity boosts the learning experience, thus, AR opens a new communication channel between consumers and marketers working for interested companies. This communication can be done, for example, using one of the following examples: 3-D image representing the desired product or advertised brand, allowing this way the consumer to better know the product; interactive textual information guiding the consumers to products’ or services’ location; location-based product-awareness games; guiding-avatars to direct the consumer through his visit in a shopping area and inform him about current discounts or other offers; etc. (Chehimi et al., 2007).
2.2.3.4.1 Examples of well-known brands that are using Augmented Reality to promote their products/services
Taking in consideration the fact that AR is a novelty and scientific articles regarding its use to promote products and services are scarce or yet inexistent, collecting information regarding this matter is a difficult process. Therefore, and acknowledging the risk that is to rely on information from a source such as the Internet, only the information present on GoldRun’s and Aurasma’s websites2 (both applications for
smartphones that enable its users to take photos of virtual objects placed on the reality and share it on social networks) where they explain in detail the campaigns that they did for other brands with their AR application, and in Red Urban’s (creative technology led agency) website3 was considered relevant and reliable.
H&M
In the fall of 2010, GoldRun had its debut with the promotion of H&M Fall/Winter collection of 2010.
The application prototype allowed its users to take photos of themselves with clothes and other apparels placed in the AR (Appendix 1). After this, they could share it on their Facebook’s page and win 10% discount and an entry in daily lottery of a US$200 gift card.
Airwalk
Inspired by the success of GoldRun’s campaigns with other brands, Young & Roubicam contacted GoldRun in the winter of 2010 to help them on the creation of the first-ever virtual pop-up store to help Airwalk’s Jim relaunch, a shoe previously launched in the beginning of the 90s for surfer and skater kids.
For this promotion, GoldRun placed virtual shoes in neighborhoods where people that fit the targeted segment go out - Washington Square Park, New York City and Venice Beach, Los Angeles. In only one day, Airwalk’s online store was able to sell 600 pairs of the limited edition shoes. This same campaign generated almost 30 thousands posts on social networks and netted $5.000.000 of earned media.
Esquire
In the beginning of 2011, Esquire Magazine with the help of GoldRun placed around 700 Barnes & Nobles magazine corridors virtual images of its February cover girl Brooklyn Decker. This way, the fans took photos with the virtual Brooklyn Decker and shared it on their social networks (Appendix 2), at the same time, Esquire got free promotion of its February issue and media attention.
NBC and Bloomingdale’s
In October of 2011, the American Television Network NBC and the American department store Bloomingdale’s, with the help of GoldRun’s application, collaborated to promote the season premieres of the fall new NBC TV shows.
During three weeks, the fans and shoppers had the chance to take photos with TV show characters that were placed in the AR of Bloomingdale’s stores and share them in social networks. After this, they could win a place as an extra in an NBC TV show or must likely gift cards.
Ford
In November of 2011, the American multinational automaker Ford launched a campaign to promote the new 2013 Ford Escape.
Using GoldRun’s application, Ford launched a treasure hunt during three days in Los Angeles where the participants had to collect different AR objects each day unlocking this way the chance to win daily prizes and enter in a final lottery for a vacation (Appendix 3). Some days later, the brand expanded this initiative to the all country.
Sony Pictures Home Entertainment and The Smurfs Movie
Also in November of 2011, Sony Pictures Home Entertainment hired GoldRun to promote the release of The Smurfs Movie on DVD and Blu-Ray.
With a campaign that lasted two months and was present in 12 different countries, Sony Pictures displayed AR Smurfs to fans pose with and take photos (Appendix 4). Following the photo, the fans were granted with special access to buy The Smurfs Movie box set.
Nike and Finish Line
Similarly to what Airwalk did, Nike along with Finish Line (an American athletic retailer) launched a campaign to promote the exclusive edition of the Nike Air Max sneakers.
Using the GoldRun application the consumers would capture the image of the virtual Nike shoes that were superimposed outside Finish Line mall stores (Appendix 5), and get the chance to win their favorite pair of sneakers. A different shoe was placed in each day of the campaign and the consumers could come back every time they wanted to increase their chances of winning.
To better understand the work done by Aurasma and Red Urban, two videos from two campaigns were also considered, Dunhil and Volkswagen 2012 Beetle, respectively. Both videos are hosted on the brands’ official YouTube channel.
Not using GPS-linked virtual objects in real-world places like GoldRun does, Aurasma did several marketing campaigns for brands like Porshe, Sony, Tottenham Hotspur Football Club, Elle Magazine (Poland), Mazda, Dunhil, Volkswagen, Panasonic, BBC TV Show Top Gear, Marks & Spencer, and other brands. In these campaigns, the user would download Aurasma’s application to his smartphone, after that he would point his smartphone, with the Aurasma’s application running, to an image (Aura) that would come to life in his smartphone (Appendix 6).
Also worth mentioning is the impressive campaign that Red Urban did to promote the launch of the new Volkswagen Beetle.
Similarly to Aurasma’s technology, the application created by Red Urban also worked with markers in billboards or images. The users would download it to their smartphones and point it, after that the virtual new Beetle would start running around the real world.
2.3 Shopping Malls
This section will cover existing literature on Shopping Malls (SM). It will focus particularly on how SM management attracts people and most importantly what brings customers to SM rather than other commercial areas.
Comparing to the traditional high street retail locations, everything in a SM is highly planned, starting with its location; to what tenants will have the opportunity to open a store there, and where will that store be located. For these reasons, the SM is managed and marketed as a whole, having thus strong marketing campaigns to differentiate itself from common retail locations and other SM (Kirkup and Rafiq, 1999).
The acknowledgement that people visit SM seeking entertainment, and many of them just going there for that reason, (i.e. people shop for hedonic and utilitarian reasons) opened a new window of opportunities and concerns where promotional activities are fundamental for managers to differentiate their SM from others and also to market their SM in an effective way to attract consumers (Bloch et al, 1994; Babin et al, 1994). Attributes like comfort, diversity, mall essence, convenience and luxury are also important to attract customers (Rajagopal, 2009).
2.3.1 Entertainment and promotional activities at Shopping Malls
Many authors agreed on the fact that entertainment is a priority to bring customers to SM, and also to deal with issues like growing competition on a crowded competitive market, and traditional SM that look all the same (Rajagopal, 2009). According to Sit et al. (2003), entertainment should be, therefore, an important marketing tool that SM managers must keep in mind to draw more customers.
In 2003, Parsons did a study where he tried to understand what kind of promotional activities increase the key performance indexes used by SM managers: sales and visits. In this study he classified the promotion activities used in SM in two groups: entertainment-based activities and price-based activities. The first ones are used to allure the hedonic-shopper: product displays, fashion shows, school/community displays, are some examples. The latter ones are used to appeal to both the hedonic and utilitarian shopper and usually come in one of the next forms: mall-wide sales; discount once a certain purchase value is reached; with-purchase; and gift-voucher once a certain purchase value is reached. In all the cases, these promotions are provided by the tenant(s) with the SM management promoting and endorsing the event.
Parsons (2003) came down to the following conclusions: sales are by far the main appealing activity that SM managers can use to increase purchases and traffic (visits); general entertainment is very good in boosting the traffic, however, it does not do much when it comes to increase spending; gift-with-purchase does exactly the opposite, encourages purchases, though it does not do much to attract consumers. He concluded then, that a good and worthy marketing promotion could be the combination of general entertainment with price-based promotions, in his particular study to combine a gift-with-purchase campaign with general entertainment to pull customers in. There is not much literature regarding the efficiency of price-based promotions on SM, nevertheless, scientific articles on general retail corroborate Parson’s (2003) findings suggesting that such events indeed increase visits (Folkes and Wheat, 1995; Smith and Sinha, 2000) and sales (Kendrick, 1998). Wakefield and Baker (1998) also agree on the fact that entertainment-based activities should contribute to the increase of visits.
2.4 Consumer E-Shopping Acceptance Model
On this section an E-Shopping Acceptance Model proposed by Ha and Stoel (2009) will be analysed, that goes further than the Technology Acceptance Model adding other important variables to consumers’ decision making process.
2.4.1 Technology Acceptance Model (TAM)
According to Davis et al. (1989), the two most important factors that users need to perceive in a new technology that will determine its success, and consequently their intention to use it or not, were usefulness and ease of ease.
The first factor, perceived usefulness, is the degree to which the user considers that the technology will boost his performance performing some task. The second factor, perceived ease of use, is the degree to which the user considers that using the technology will be free of effort.
In their study, Ha and Stoel (2009) proposed that other factors, as for example usefulness & performance, enjoyment, and trust might influence a user’s perspective about using, or not, a technology more than ease of use.
Therefore, the original TAM was considered limited to situations that involved a bigger user interaction, such as e-shopping.
2.4.2 The Consumer E-Shopping Acceptance Model
Ha and Stoel (2009), concluded their study suggesting a model where enjoyment, trust, and ease of use are critical factors. Though, the initial advantages of e-shopping are mainly utilitarian due to its convenience, competitive-pricing, and greater access to information; hedonic advantages are also very important – i.e. self-gratification, social experiences, and enjoyment it self – and can change one’s opinion about e-shopping, hence, one’s propensity to look for enjoyment through entertaining, and fun experiences while shopping online, might effect his/her adoption of the internet to shop for products (Ha and Stoel, 2009). As mentioned before, Ha and Stoel (2009) also suggested that consumers’ trust on e-retailers, and Internet itself is a vital factor that affects their beliefs on safety. If consumers trust, their feelings of uncertainty and fear will be reduced, and they will must likely embrace online shopping.
Nevertheless, these factors have e-shopping quality (usefulness) as antecedent factor, that concerns to all customer perceptions of the excellence, and effectiveness of an e-store in general, quality of website features, etc. Thus, this factor, e-shopping quality, comprises four other sub-factors: website design, customer service, privacy/security, and atmosphere/experience. Positive perceptions on these four sub-factors will influence, positively, the critical sub-factors that succeed them (Ha and Stoel, 2009).
2.5 Chapter Conclusion
Throughout this chapter, the literature needed for the purpose of this dissertation was reviewed.
In what concerns to Augmented Reality it is clear that is a technology with numerous strategic uses, and many yet to be discovered. Now, more than ever, it is the time to use it, and take advantage of its features once it became so mainstream through the smartphones availability to the general public.
Regarding shopping malls, all of them want to differentiate from each other, and bring more spending customers to their aisles. The literature reviewed shows that entertainment-based activities boosts the traffic, on the other hand, price-based promotions increase customers spending.
The next chapter introduces the technological hypothesis that connects these two points, along with the research methodology to study it.
3.
Technological
Hypothesis,
Research
Methodology and Data Collection
3.1 Chapter Introduction
The never-ending capabilities of AR together with the ubiquity of smartphones that turn AR mainstream, lead to several new market opportunities (Pence, 2011).
Therefore, and recognizing what might be a new market opportunity for applications’ developers, shopping malls property managers, and tenants this dissertation proposes a technological hypothesis where the AR capabilities are explored in a Shopping Mall environment to do promotion, and to inform customers.
In the beginning of this chapter, the technological hypothesis is explained: why this hypothesis, what is and how it works.
In the last part of this chapter it is explained the methodology used to address the research question: why it makes sense to adapt a Consumer E-shopping Acceptance Model to this dissertation and from there extract the necessary hypotheses to address the research question; from these hypotheses are created dependent and independent variables that are supported with an online survey. The chapter ends with a brief explanation of how will the data collected in the survey be analysed.
3.2 Technological Hypothesis
This section aims to present thoroughly the technological hypothesis of this research, why it is important to study it and its functionality.
3.2.1 The Reasons Behind This Technological Hypothesis
This idea comes from the acknowledgement of the success that some brands had when they used AR to promote their products and services.
As mentioned in the literature review chapter, these campaigns generated a lot of noise around these brands: Internet blogs, press, posts on social networks, etc. In the end, they got free exposure and media attention that would bring more
Moreover, AR is nowadays available to everybody through people’s smartphones equipped with camera, compass and all the other necessary components and capabilities, as for instance Internet.
Along with these facts comes the other reality also covered in the literature review chapter, that is: people go to SM not only to shop but also to spend time having fun, being the entertainment factor an important dragger of visits. Additionally, price-based promotional activities increase the spending.
These notions together originated the technological hypothesis that is proposed in this dissertation.
3.2.2 The Technological Hypothesis and How It Works
Currently, cell phones are more advanced than ever. Being now equipped with fast processors and other components, cell phones (smartphones) are now able to run complex operating systems. These operating systems, likewise those in computers, allow its users to install and execute applications. These applications allow its creators or the companies behind it to get real-time information about its users, enabling this way some degree of personalization if that is what the company is looking for (Cristofaro et al, 2011).
This technological hypothesis proposes an application managed by the SM management in collaboration with the tenants that would be aimed to enhance the link between the customers, and the SM & its tenants.
The application would have several features using the smartphone AR capabilities: touring and guiding through the SM, general information about the SM and its stores, pop-up information about current promotional activities superimposed above the stores while the customer is passing by, and gaming possibilities.
The customer would walk inside the SM and be informed about the application. After the download, the customer would have to register in the SM platform and create a profile, allowing this way the SM to have information about him and his preferences. After the registration, the customer would login in the application and have access to its features. The information and content displayed by the application would become more and more personalized with the consumer interactions, providing that the consumer allows the SM management to record his interactions.
3.2.2.1 Technological Hypothesis’ Features
The main objective of this technological hypothesis it is to increase the traffic in SM, and to increase the spending. As reviewed in the last chapter that is done with promotional activities that make the shopping mall experience more enjoyable and attractive: price-based and entertainment-based.
Consequently, this technological hypothesis proposes an AR application with the following features:
Products/Services Displays: unlike what happens nowadays in SM where aisles and squares are occupied with product displays, this technological hypothesis offers the SM, the tenants, and other companies advertising in SM, a new way to showcase their products and other offers. Products, services and other advertising material would now be displayed in the AR and the visitors would see it while they are using the application on their smartphone; according to the personalized settings on the application, the user would see everything or just what was relevant for him taking into account his preferences.
Information: with this technological proposal, the stores and other important locations in the SM would be geographically marked in the AR, thus, if the application user pointed his smartphone to a specific store/location he would get detailed information on his smartphone screen. This information would include general-information regarding that particular store, contacts, website link, current promotions available, etc. Without having to point his smartphone to the marked locations, information regarding price-based promotions would pop-up being thus the visitor notified while passing by. Once again, according to the personalized settings the user would only be notified of what he wanted.
Gaming: this application would offer its users AR games. Taking advantage of the big available space in the SM and the AR capabilities of his smartphone, with this application he would be able to explore the SM and have fun while doing it. In the games the user would interact and spend time playing in the AR. Using these features, stores would also promote AR games, if they wanted, like treasure hunting for example. The consumers would have to enrol in a game where they would have to find leads or a set of virtual objects placed in the AR that after would be replaced in the respective store for a price-based promotion or gift.
specific kind of store (clothing stores, electronic & home appliances stores, etc). This application would also allow its user to save his favourites locations/stores in the SM to find them easily in future visits; likewise, it would allow the user to save the location of his car on the parking lot.
3.3 Research Methodology
The approach utilized on this dissertation to answer the research question is built upon a research model.
This model is an adaptation of the Consumer E-Shopping Acceptance Model suggested by Ha and Stoel (2009) and reviewed on the literature review chapter. The model is modified and adapted to fit to the augmented reality and shopping mall context. This procedure allowed the extrapolation of the relevant dimensions to the purpose of this study, that is, to analyze consumers’ willingness to accept this technological hypothesis and understand the reasons that may lead to its success or failure.
Each one of these dimensions is linked to a particular factor/belief that affects consumer decision towards the technological hypothesis allowing, thus, to understand the mentioned reasons behind its acceptance or failure.
For each dimension of the model, one or more hypotheses are proposed in order to get the information needed to validate the research question.
To acquire the needed information, an online survey is conducted. Its questions are prepared accordingly to the dimensions of the research model. Furthermore, the extracted data from the survey is interpreted, studied, and used to validate the hypotheses.
After the hypotheses validation, this study is concluded and the research question is answered.
3.3.1 Research Model
As mentioned before, this dissertation uses an adaptation of the Consumer E-Shopping Acceptance Model created by Ha and Stoel (2009).
The need for the adaptation arises because the studied model was developed to apply to online shopping whereas the current technological hypothesis of this dissertation involves the use of a new technology, augmented reality, through
smartphones in a new context, that is, to promote products and services in shopping malls.
The adjustment of the studied model starts with the redefinition of the factor e-shopping quality, on the model this factor measures the usefulness of the e-e-shopping website and comprises four factors that will determine the acceptance of that e-shopping website.
In the research model for this dissertation, it makes sense to call it AR application quality, because it is used to evaluate the factors that will influence the SM customer’s decision to adopt or not this application and SM experience.
If the consumers have a positive perception on this factor it will influence, positively, their perceptions on the subsequent factors (Amusement, Trust, and Easy of Use) and consequently embrace the technological hypothesis.
This AR application quality factor concerns to all customer perceptions towards the application: application aesthetics, user friendliness, quality and context of the information provided, degree of personalization of the information offered, privacy, experience while using applications’ features, etc.
This factor, likewise in Ha and Stoel’s model (2009), it is divided in four dimensions (sub-factors) that allow a better evaluation: Application Design, Relationship with Customer, Privacy/Security, and Experience.
Application Design evaluates the importance that the customers give to the application appearance itself, to the way that information is disposed, to the ease of accessibility to application’s features, to the application features, and to the quality of the AR content superimposed in the SM. This dimension has as variables App. Guiding Features, App. Information Features, App. Aesthetics, and Graphic Quality. Relationship with Customer concerns to how the customer perceives the quality of the information received on the application; to the degree of personalization anticipating his needs and likes. This dimension has as variables Communication Channel, Profile Personalization, and Interactions Record Personalization.
Privacy/Security refers to the feeling of safety perceived by customers while using the application, and therefore to their willingness to share personal data or allow the record of interactions. More conservative customers receive less personalized content on their application. For this dimension the variable is security.
3.3.2 Research Question and its Hypotheses
Will the consumers accept and adhere to initiatives where they have to use their smartphones to get access to promotions, other prizes, and general information in a shopping mall?
To answer this research question it is necessary to analyse a combination of information. For the purpose of this study, it is important to understand: if consumers enjoy the SM shopping experience; if consumers will use their smartphones to use the offered AR application to access SM and stores information and/or to get price-based promotions; if customers appreciate personalized content and promotions; and if customers are afraid of giving personal information upon their registration as application users, being the privacy factor a factor of decision to either use or not the application.
In order to answer this research, and get this information the following hypotheses need to be clarified:
H1: Consumers are willing to use the AR capabilities of their smartphones to guide themselves in the Shopping Malls, and to look for specific SM information.
This hypothesis tests if the consumers use their smartphone capabilities to guide themselves in the SM, finding this way the stores that they are looking for, that they usually visit or that fit better with their customer profile. Therefore, it tests at what extent are some application’s features crucial to the adopting decision, this hypothesis is related with Application Design dimension.
H2: Consumers are willing to use the AR application if they like its appearance and how content is displayed.
This hypothesis tests if the consumers take into consideration the aesthetics of the application and the quality of the AR displays. It analyses if the users care about the application’s looks and how good are the virtual displays placed in the real world; therefore, it also relates with the Application Design dimension.
H3: Consumers are willing to use the AR application on their smartphones to access the promotions.
It is important to understand if the customers are persuaded to use the AR SM application to access the available price-based promotions. Price-based promotions are not only a way to increase customers spending but also a communication
channel between stores and its clients that enhances their relationship, thus, this hypothesis relates with the Relationship with Customer dimension.
H4: Consumers prefer to use the AR application and give more value to the experience if the information and promotions displayed are personalized. This hypothesis tests if the consumers prefer to receive personalized content rather then generalized. The technological hypothesis of this dissertation proposes an application that delivers information and contents to its users according to their profile and past interactions record. As the quality of the information received is an important issue when it comes to the decision of adopting the AR SM application, the degree of personalization can be very important to its users, consequently, this hypothesis relates with the Relationship with Customer dimension.
H5: Consumers are willing to use the AR application if they feel their information is secure.
Consumers will use the AR application if they feel that their personal information and shopping record is safe, that is, their personal privacy is not being violated; otherwise, either they do opt to not use it all or they use without the personalization capabilities. This hypothesis relates to the Privacy/Security dimension.
H6: The AR initiatives are perceived as new way of shopping mall entertainment.
This hypothesis analyses if consumers enjoy using the AR application to get information, to participate in promotions and to see products displays rather than through the traditional means. This last hypothesis tests if customers appreciate this new way of shopping in SM, so, it relates with the Experience dimension.
Summarizing, these hypotheses were created using the modified acceptance model, and therefore they relate with it in following way:
Hypotheses 1 and 2 relate to the Application Design dimension.
Hypotheses 3 and 4 relate to the Relationship with Customer dimension. Hypothesis 5 relates to the Privacy/Security dimension.
3.4 Data Collection
To validate the hypotheses that were created with the research model’s dimensions an online survey4 was conducted in January 2012. To do it, the online survey software used was QuestionPro5.
This survey was available for a period of 72 hours to 1100 people that were invited to participate through Facebook.
From those, a total of 418 accessed it. From these 418 people: 303 (72%) started the survey but only 272 (65%) finished it.
Consequently, the number of observations considered relevant for the analysis was 272 people: 110 are male (40,44%), 162 are female (37%), and 85 of them are aged in the 21-23 age interval (31,35%)6.
To interpret the collected data from the online survey a statistical analysis was done.
3.4.1 Variables
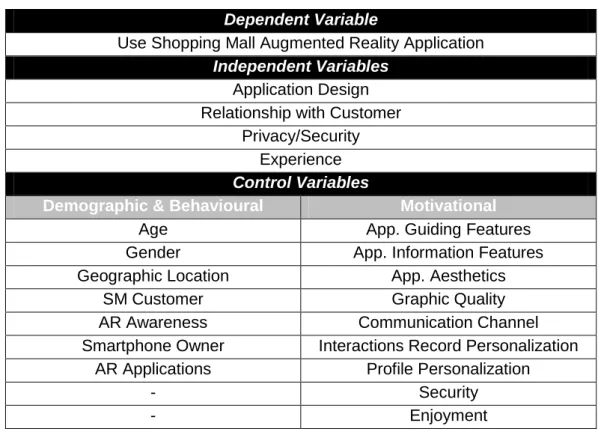
Below, on the Table 1 is a summary of the variables used on this analysis. The online survey allowed to collect the necessary data for each considered variable.
Table 1 – Variables used in the analysis Dependent Variable
Use Shopping Mall Augmented Reality Application Independent Variables
Application Design Relationship with Customer
Privacy/Security Experience Control Variables
Demographic & Behavioural Motivational
Age App. Guiding Features
Gender App. Information Features
Geographic Location App. Aesthetics
SM Customer Graphic Quality
AR Awareness Communication Channel
Smartphone Owner Interactions Record Personalization AR Applications Profile Personalization
- Security
- Enjoyment
4
Appendix 7: Survey Questions
5 QuestionPro – Online Research Made Easy™ website: www.quesitonpro.com 6
Dependent Variable
The depent variable Use Shopping Mall Augmented Reality Application measures the willingness of the respondents to use an application to enhance their shopping mall experience.
Independent Variables7
Application Design – This variable identifies the users that care about the application
and its content appearance. It also identifies the users that are prone to use its features. This variable is tested by questions Q8, Q9, Q10, and Q11 of the survey.
Relationship with Customer – This variable identifies the customers that would like to
receive detailed information about price-based promotions on their smartphones. Moreover, it also identifies the customers that prefer personalized content. This variable is tested by questions Q12, Q13, and Q14 of the survey.
Privacy/Security – This variable identifies the customers that would not use the
application if they feel that it was not secure. This variable is tested by question Q15 of the survey.
Experience – This variable identifies the customers that would appreciate to use an
AR application on a SM and have access to the features described on the Technological Hypotheses section of this chapter. This variable is tested by question Q16 of the survey.
Control Variables
There are two groups of Control Variables, the group of Demographic & Behavioural variables and the group of Motivational variables.
The group of Demographic & Behavioural variables contains the following variables:
Age (<18=1, 18-20=2, 21-23=3, 24-26=4, 27-30=5, 31-35=6, 36-40=7, 41-50=8,
51-60=9, >60=10); Gender (Male=1, Female=2); Geographic Location (North of Portugal=1, Center of Portugal=2, South of Portugal=3, Insular Portugal=4, Other Country=5); SM Customer (Never=1, 1=2, 2=3, 3=4, 4=5, More than 4=6); AR
Awareness (Yes=1, No=2); Smartphone Owner (Smartphone=1, Feature phone=2); AR Applications (Yes=1, No=2).
App. Guiding Features (Wander around till you figure it out.=1, Ask someone for
directions.=2, Use your smartphone to figure it out on your own quickly.=3); App.
Information Features (Ask someone for that information.=1, Use your smartphone to
get accurate information.=2); App. Aesthetics (You would give it a try and use if it was useful.=1, You would uninstall it right way and look for a better application.=2);
Graphic Quality (Probably forget about it.=1, Remember it and probably get
interested on what is being advertised.=2, Remember it, comment with friends, and probably get interested on what is being advertised.=3); Communication Channel (Walk around looking for a promotion.=1, Run an AR application on your smartphone to look for general promotions near you and also have access to promotions exclusive to application's users.=2); Interactions Record Personalization (A website that shows me everything.=1; A website that shows me selected content considering my past interactions.=2); Profile Personalization (Give less information (you trust in this website/application) about yourself and get generalized information.=1; Give detailed information (you trust in this website/application) about yourself and get personalized information.=2); Security (Use it, anyway.=1, You don’t provide that data and continue using it with some constraints.=2, Don’t use it.=3); Enjoyment (It’d be pointless.=1, It’d be a new enjoyable way of shopping.=2).
3.5 Data Analysis Method
In order to have a consistent and reliable sample only the respondents with mobile phones that completed the whole survey were considered in the analyses. Therefore, only data from 272 respondents was analysed.
This data was then analyzed in three stages:
Firstly, the data was characterized taking only into account the answers given in the survey and characterized by showing the control variables’ results in terms of percentages. This characterization allowed the creation of the profile of the sample. Secondly, the data was segmented according to the given answers in order to determine the representativeness of the independent variables in the sample. To do so, the survey questions were separated according to the independent variables to which were related. Later, they were summed and weighted with the total of answers. Thus, the percentage of positive responses for each independent variable was calculated.
Finally, it was important to understand if some Demographic & Behavioural control variables could influence the Motivational control variables and therefore influence
some independent variables. To complete this final analysis statistical software8 was used, in order to find possible relations between those variables.
Crosstabs 1 – SM Customer Control Variable: This Demographic & Behavioural variable, obtained from question Q4, was crossed with the Motivational variables
App. Guiding Features, Communication Channel, and Enjoyment that were extracted
from the questions Q8, Q12, and Q16. The intention was to understand if it there was any relation between the respondent being a SM customer and his attitude towards the idea proposed on these questions.
Crosstabs 2 – AR Awareness Control Variable: This Demographic & Behavioural variable, obtained from question Q6, was crossed with the Motivational variables
App. Guiding Features, App. Information Features, Communication Channel, and Enjoyment that were extracted from the questions Q8, Q9, Q12, and Q16. The
intention was to understand if it there was any relation between the respondent being aware of AR before the survey and his attitude towards the idea proposed on these questions.
Crosstabs 3 – Smartphone Owner Control Variable: This Demographic &
Behavioural variable, obtained from question Q7, was crossed with the Motivational
variables App. Guiding Features, App. Information Features, Communication
Channel, and Enjoyment that were extracted from the questions Q8, Q9, Q12, and
Q16. The intention was to understand if it there was any relation between the respondent being a smartphone owner and his attitude towards the idea proposed on these questions.
Crosstabs 4 – AR Applications Control Variable: This Demographic &
Behavioural variable, obtained from question Q7.1, was crossed with the Motivational
variables App. Guiding Features, App. Information Features, Communication
Channel, and Enjoyment that were extracted from the questions Q8, Q9, Q12, and
Q16. The intention was to understand if it there was any relation between the respondent being a smartphone owner with AR applications installed and his attitude towards the idea proposed on these questions.
3.6 Chapter Conclusion
This chapter covered the technological hypothesis behind this dissertation, and also the method used to explore and research this idea.
The next chapter covers the analysis and the discussion of the survey’s results. These results allowed the elaboration of preliminary conclusions that facilitate the purpose of this dissertation, i.e. to answer the research question.
4. Results’ Analysis and Discussion
4.1 Chapter Introduction
In the current chapter the results from the survey are interpreted. From these interpretations preliminary conclusions raise.
After the results interpretation, these preliminary conclusions are then discussed and crossed with the hypotheses posed on the previous chapter to understand if the data extracted from the survey can support them and, thus, address the research question.
4.2 Results’ Analysis
In this section the data is analysed in three stages. First, the data is characterized only taking into account the answers given in the survey and the results are showed in terms of percentages, hence, allowing the creation of the profile of the sample. Then, the data is segmented making each Motivational Control Variable match with its correspondent Independent Variable. This way it is calculated the representativeness of each Independent Variable and overall representativeness. Finally, some Demographic & Behavioural control variables are crossed with a few
Motivational control variables in order to understand if the former can somehow
influence the latter.
4.2.1 Data Characterization and Profile of the Sample
From this sample of 272 respondents is possible to acknowledge:
Age (Question Q1 of the survey) – Most of the individuals are aged in the 18-26 interval:
o <20 corresponds to 1,10% o 18-20 corresponds to 16,54%, o 21-23 corresponds to 31,25%, o 24-26 corresponds to 27,21%;
o 23,9% have more than 26 and correspond to other intervals;
Geographic Location (Question Q3 of the survey): o 6,99% are located in the North of Portugal, o 49,26% are located in the Center of Portugal, o 33,09% are located in the South of Portugal; o 1,47% are located in the Insular Portugal, o 9,19% are located in other country;
SM Customer (Question Q4 of the survey) – Most of the respondents usually visit SM:
o 29,04% visit more than 4 times per month, o 69,48% visit 1 to 4 times per month, o 1,47% never visit;
Number of Mobile phones (Question Q5 of the survey): o 64,7% have 1 mobile phone,
o 35,3% have more than 1;
AR Awareness (Question Q6 of the survey):
o 57,72% of the respondents had never heard of Augmented Reality before this survey;
Smartphone Owner (Question Q7 of the survey): o 68,01% have smartphones;
AR Applications (Question Q7.1 of the survey) – From the 68,01% that own smartphones (185 respondents):
o 34,05%9
have AR applications installed on their smartphones;
App. Guiding Features (Question Q8 of the survey) – If lost or looking for a store in a SM:
o 41,54% would ask someone for directions,
o 38,60% would use their smartphones to figure it out on their own, o 19,85% would wander around till it would figure it out on their own;
App. Information Features (Question Q9 of the survey):
o 52,21% would use their smartphones to get a particular information, o 47,79% would ask someone.
App. Aesthetics (Question Q10 of the survey):
o 54,04% would use an application with bad appearance if after a try-out it was useful;
o 45,96% would uninstall it immediately and look for a better application;
9
Graphic Quality (Question Q11 of the survey) – After seeing an advertising outdoor that they like:
o 58,09% would remember it, comment with friends, and probably get interested on what is being advertised,
o 28,68% would remember it, and probably get interested on what is being advertised,
o 13,24% would probably forget about it;
Communication Channel (Question Q12 of the survey):
o 55,88% would run an AR application to look for price-based promotions, and have access to exclusive ones,
o 44,12% would walk around looking for promotions;
Interactions Record Personalization (Question Q13 of the survey):
o 61,03% would prefer an e-shopping website that shows them selected content taking into account past interactions,
o 38,97% would prefer an e-shopping that shows them everything;
Profile Personalization (Question Q14 of the survey):
o 58,09% upon registration would prefer to give less information to a trusted website/application and receive newsletters with general information,
o 41,91% upon registration would prefer to give more information to a trusted website/application and receive newsletters with personalized information.
Security (Question Q15 of the survey) – When registering in a website/application that requires some personal data to provide personalized contents, if they do not feel secure or if they feel that there is some lack of privacy:
o 60,66% would not provide that data and use the website/application subject to constraints,
o 34,93% would not use it at all, o 4,41% would use it, anyway;
Enjoyment (Question Q16 of the survey):
o 89,34% would enjoy to use an AR application (with features similar to the ones on the technology hypothesis) to use while visiting a SM, o 10,66% think that it would be pointless.
4.2.2 Independent Variables Representativeness
The independent variables representativeness symbolizes the acceptance of the concept behind a particular independent variable. Each independent variable is associated with one or more motivational control variables that are tested with a question each. Every question has one or more answers that are considered positive, that is, they show a positive attitude towards the idea behind. This representativeness is calculated doing the weighted average of the positive answers. The independent variable Application Design is deduced from four Motivational Control Variables: App. Guiding Features, App. Information Features, App.
Aesthetics, and Graphic Quality. For these motivational variables, the answers that
supported the technological hypotheses of this dissertation and, therefore, the most positive are “Use your smartphone to figure it out on your own quickly.=3”, “Use your smartphone to get accurate information.=2”, “You would uninstall it right way and look for a better application.=2”, and “Remember it, comment with friends, and probably get interested on what is being advertised.=3”, respectively. The question that accessed the variable App. Guiding Features got 105 positive answers; App.
Information Features got 142 positive answers; App. Aesthetics got 125 positive
answers, and Graphic Quality got 158 positive answers. Consequently, the representativeness of the variable Application Design is 49%10, which means that the individuals on this sample are divided, and it seems that most do not have a favorable attitude desired for the acceptance of this proposal on what concerns to this independent variable.
Regarding the independent variable Relationship with Customer, the associated Motivational Control Variables are: Communication Channel, Interactions Record
Personalization, and Profile Personalization. The most positive answers for these
variables are “Run an AR application on your smartphone to look for general promotions near you and also have access to promotions exclusive to application's users.=2”, “A website that shows me selected content considering my past interactions.=2”, and “Give detailed information (you trust in this website/application) about yourself and get personalized information.=2”, correspondingly. The number of positive responses for Communication Channel was 152, 166 for Interactions Record
Personalization, and 114 for Profile Personalization. Hence, the representativeness
of the variable Relationship with Customer is 53%, what means that the majority of
10
the enquired individuals have the required attitude for the acceptance of this proposal on what concerns to this independent variable.
The independent variable Privacy/Security has only one Motivational Control Variable associated that is Security. For this variable it is considered that “You don’t provide that data and continue using it with some constraints.=2” and “Don’t use it.=3” support the technological hypothesis of this dissertation and, therefore, are both positive answers. Thus, the number of positive answers is 260 (165 and 95, respectively) and the representativeness of this independent variable is 96%, meaning that almost all respondents have the required attitude for the acceptance of this proposal on what concerns to this independent variable.
Lastly, the independent variable Experience is inferred from the Motivational Control Variable Enjoyment. For this variable the most positive answer is “It’d be a new enjoyable way of shopping.=2” and it got 243 positive answers, leading this way to a representativeness of the Experience variable of 89%, thus, almost all the respondents have the necessary attitude for the acceptance of this proposal on what concerns to this independent variable.
Therefore, these independent variables have an overall representativeness of 72%, that is, the average of the four independent variables’ representativeness. This means that this sample has the required mind-set to accept the technological hypothesis behind the independent variables. It is also worth to mention that the average of the most positive answers, without weighting them accordingly to their associated Motivational Control Variables, is 60%. This second value corroborates the conclusions found before, i.e., this sample has the desired disposition for this technological hypothesis11. Then, it is possible to take the first preliminary conclusion (1), that is, this sample is willing to use an AR application while shopping in a SM.
4.2.3 Control Variables Cross-Tabulations
To conclude the results’ analysis four Demographic & Behavioural Control Variables were crossed with other Motivational Control Variables. The idea is to understand if
Demographic & Behavioural differences can significantly influence the respondents’
position towards the technological hypothesis proposed on some particular questions.