Universidade de Aveiro
2010
Departamento de Electrónica,
Telecomunicações e Informática (DETI)
Fernando Jorge
Lopes Parente
Efeitos cruzados em serviços sobre PON
Cross effects in services over PON
Dissertação apresentada à Universidade de Aveiro para cumprimento dos requisitos necessários à obtenção do grau de Mestre em Engenharia Electrónica e Telecomunicações, realizada sob a orientação científica do Prof. Doutor António Teixeira e do Prof. Doutor José Ferreira da Rocha, ambos do Departamento de Electrónica, Telecomunicações e Informática e do Instituto de Telecomunicações da Universidade de Aveiro.
Dedico este trabalho aos meus pais, ao meu irmão e a todos os meus amigos por todo o seu incansável e incondicional apoio e por me guiarem sempre na direcção correcta.
o júri
Presidente Prof. Doutor Paulo Miguel Nepomuceno Pereira Monteiro Prof. Associado da Universidade de Aveiro
Vogal Doutora Natasa Pavlovic
Investigadora Sénior na Nokia Siemens Networks
Orientador Prof. Doutor António Luís Teixeira Prof. Associado da Universidade de Aveiro
Co-Orienador Prof. Doutor José Rodrigues Ferreira da Rocha Prof. Catedrático da Universidade de Aveiro
agradecimentos Esta tese marca o culminar de 5 anos de trabalho na Universidade de Aveiro. Durante estes fantásticos anos, muitas foram as pessoas que me marcaram, incentivaram e ajudaram a desenvolver técnica e pessoalmente e às quais não poderia deixar de agradecer.
Quero agradecer aos meus orientadores, Prof. Dr. António Teixeira e Prof. Dr. José Ferreira da Rocha pelo apoio, orientação e troca de conhecimentos, que me ajudaram a ultrapassar as dificuldades e melhorar o meu trabalho.
Aos meus colegas de trabalho, aos projectos QREN FCT e PTin “GPON in a box”, FCT “TOMAR-PON” e ao projecto Europeu do FP7 SARDANA.
Com muito orgulho por toda a experiencia de vida que me proporcionou, gostaria de deixar o meu especial agradecimento à Universidade de Aveiro, em particular ao Departamento de Electrónica, Telecomunicações e Informática e ao Instituto de Telecomunicações.
Aos elementos da equipa de Futsal Feminino, da Comissão Pedagógica e da Comissão de Faina do Curso Mestrado Integrado em Engenharia Electrónica e Telecomunicações dos anos lectivos 08/09 e 09/10 por todos os momentos de trabalho, entreajuda e diversão que me fizeram crescer enquanto pessoa.
A todos os meus amigos pelo acompanhamento e apoio constantes, por todas as noites de sono perdidas a estudar e por todos os momentos de alegria que me proporcionaram. Aos meus colegas de casa destes meus anos passados em Aveiro, Ângelo Almeida, Miguel Martins, e João Cardoso, e à minha namorada Andreia Pacheco, a eles um muito obrigado pela sua paciência, compreensão e encorajamento.
Por fim, quero agradecer a toda a minha família, em particular aos meus pais, irmão, e avó pela confiança depositada nas minhas capacidades ao longo da vida.
acknowledgment This thesis is the last step of five years working at the University of Aveiro. Throughout these fantastic years, there were many people who left a trace of themselves in my personality, encouraged and helped me improving myself, both technically and personally, and to whom I really had to thank.
I want to thank my advisors, Prof. Dr. António Teixeira and Prof. Dr. José Ferreira da Rocha for their support, guidance and exchange of knowledge, which helped me to overcome difficulties and improve my work.
To my work colleagues and to the projects QREN FCT e PTin “GPON in a box”, FCT “TOMAR-PON” ant to the European project FP7 SARDANA.
With great pride for all the life experience that was given to me, my special thanks to the University of Aveiro, in particular to the Department of Electronics, Telecommunications and Informatics and Telecommunications Institute.
I thank the female futsal team, Educational Commission and the “Comissão de Faina” of the degree Masters in Electronic, Telecommunications and Informatics in the academic years of 08/09 and 09/10 for all the moments of work, mutual support and fun that made me grow as person.
I thank all my friends for their constant support and monitoring, for every night of lost sleep studying and all the moments of happiness that provided me.
I thank my Aveiro’s past years housemates, Ângelo Almeida, Miguel Martins, and João Cardoso, and my girlfriend Andreia Pacheco. I want to thank them very much for their patience, understanding and encouragement.
At last, but not at least, I thank all my family, especially my parents, brother and grandmother for their belief in my abilities throughout life.
palavras-chave resumo
Efeitos não lineares, efeitos cruzados, Raman, modulação de fase cruzada, vídeo overlay, G-PON.
Este trabalho focou-se no estudo dos efeitos cruzados em sistemas de comunicação ópticos passivos. Para isso foram abordados de uma forma genérica os factores cruzados mais relevantes que ocorrem em fibras comuns. Estes foram analisados na perspectiva das aplicações que temos em mãos, que correspondem a redes de acesso baseadas em G-PON e com convivência de canais de vídeo. A característica dos sinais, especificamente a potência do sinal de vídeo evidencia-se como a mais potencial causa de efeitos cruzados, dados os níveis elevados de potência que podem ser transmitidos. Ainda, os efeitos cruzados que parecem os mais relevantes, dada a sua característica de largura de banda elevada, são o Raman e a modulação de fase cruzada e como tal vão ser descritos com mais profundidade. Os resultados apresentados tentam sempre mostrar os efeitos em ambos os sinais e tentam-se obter os resultados para diversos cenários possíveis, os quais, sempre que possível, respeitam as normas respectivas relativas a esses sinais. Em alguns casos, e para demonstrar a validade do processo, são expandidos em termos dos vectores passíveis de controlo mais comuns: a potência, o comprimento de onda e o formato de modulação. Com um formato de modulação avançado pretende-se estudar o potencial da introdução deste tipo de sinais no sistema como soluções viáveis para NGPON2.
keywords
abstract
Nonlinear effects, Cross effects, Raman, cross phase modulation, video overlay, G-PON.
This work aimed at the study of cross effects in passive access optical communication systems. With that purpose the more relevant cross factors that occur in common fibers were approached. These were analyzed in the perspective of the most recent applications, corresponding to the access networks based on G-PON and with coexistence of video channels. The characteristic of the signals, specifically the power of video signals is seen as the most potential cause of cross effects, since the power levels that are allowed to be transmitted can be rather high. Moreover, from the identified cross effects, the ones that seem to be the most relevant, due to their high bandwidth characteristics, are the Raman and the Cross Phase Modulation and for that reason they will be described deeper depth. The results presented always show the effects in both sources and the targeted results try to observe a variety of possible scenarios, which whenever as possible, respect the related standards. However, for a broader vision, in some cases, the vectors that can be commonly controlled: the power, the wavelength, and the modulation format; are expanded. By studying one advanced modulation format for the digital data it is intended to study their potential for NGPON2.
Table of Contents
Table of Contents ... i
List of Figures ... iii
List of Acronyms ... vii
Chapter 1. Introduction ... 1
1.1. Context ... 1
1.2. Motivation ... 3
1.3. Structure and Objectives ... 4
1.4. Main Contributions ... 5
Chapter 2. Non-Linear Effects... 6
2.1. Introduction ... 6
2.2. Self-Phase Modulation (SPM) ... 6
2.3. Cross-Phase Modulation (XPM) ... 8
2.4. Four-Wave Mixing (FWM) ... 11
2.4.1 Techniques to reduce FWM crosstalk... 13
2.4.1.1 Reduction of FWM crosstalk by changing the fiber dispersion coefficient and by elimination of one of the channels ... 14
2.4.1.2 Reduction of FWM crosstalk using unequal channel spacing ... 19
2.5 Stimulated Raman Scattering (SRS) ... 24
2.6. Conclusions ... 31
Chapter 3. Modulation Formats ... 32
3.1. Introduction ... 32
3.2. Intensity Modulated signals ... 33
3.2.1 Non-Return-to-zero (NRZ) ... 33
3.2.2 Return-to-zero (RZ) ... 34
3.3 Coherent Signals ... 35
3.3.1 Amplitude Shift Keying (ASK) ... 36
3.3.2 Frequency shift keying (FSK) ... 36
3.3.3 Phase shift keying (PSK) ... 38
3.4 Differential phase modulation formats ... 40
3.4.1 Differential Binary Phase Shift Keying (DBPSK) ... 40
3.4.2 Differential Quadrature Phase Shift Keying (DQPSK) ... 41
3.5 Video Overlay Signals in Passive Optical Networks ... 42
3.6. Conclusions ... 48
Chapter 4. Simulation and results ... 49
4.1. Introduction ... 49
4.2. Interaction between Video and NRZ data channel ... 49
4.3. Interaction between Video and DQPSK data signal ... 60
4.4. Conclusions ... 66
Chapter 5. Conclusions and future work ... 67
5.1. Conclusions ... 67
5.2. Future work ... 68
References ... 70
List of Figures
Figure 2.2.1 – Temporal variation of frequency shift caused by SPM in a Gaussian
Pulse...…....8
Figure 2.3.1 – VPI Systems setup to study XPM effect………....…………9 Figure 2.3.2 – Optical Spectrum of the weak pulse with (black and dashed) and without
(blue and solid) XPM effect………...…………10
Figure 2.4.1 – Pulses generated by FWM...…...13 Figure 2.4.1.1 – VPI Systems Setup: 4 x10 Gbit/s WDM transmission over Dispersion
Shifted Fiber (DSF)………...……….14
Figure 2.4.1.2 – Output optical spectrums: In the left side the case of four-wave
propagation is showed and in the right side the case of channel 2 turned off can be seen...15
Figure 2.4.1.3 – Eye diagrams: in the left side is the case of four-wave propagation; in the
right side is the case of channel 2 turned off………...…….16
Figure 2.4.1.4 – Optical Spectrums: : In the left side the case of four-wave propagation is
showed and in the right side the case of channel 2 turned off can be seen...17
Figure 2.4.1.5– Eye diagrams: left side) the case of four-wave propagation; right side) the
case of channel 2 turned off...…...18
Figure 2.4.1.6 – FWM signal power in function of fibre length and channel spacing for
different values of dispersion [10] ………...…….……….19
Figure 2.4.1.7 – Setup to study the reduction of FWM effect using unequal channel
spacing……….………...…………20
Figure 2.4.1.8 – Channel plans for normal and unequal channel spacing...…....21 Figure 2.4.1.9 – BER vs. Average Channel Power………....………….21 Figure 2.4.1.10 – Probability of error of the third channel versus launched power per
channel. The continuous line shows the theoretical result for unequal channel spacing. The dashed line is obtained from the theory with a 30% reduction of efficiency and the small dots connected with a line are the simulation results for equal channel spacing……….………...…………22
Figure 2.5.1 – Raman-gain spectrum for silica fibers at a pump wavelength of
1μm………...……….25
Figure 2.5.2 – Setup to study the SRS………...…………26
Figure 2.5.3 – Raman power transfer to the case of pump power higher than Stokes power...…...26
Figure 2.5.4 – Raman power transfer in the case where the pump power equals signal power……….………...……….….27
Figure 2.5.5 – Setup to study Raman Effect in a 100 channels system...…....28
Figure 2.5.6 – Optical Spectrum at input of the link...…...29
Figure 2.5.7 – Optical Spectrum at output of the link………....…….29
Figure 2.5.8 – Eye diagrams: In the left side channel 1; in the middle 50 and 51 channels; in the right side channel 100………...………29
Figure 2.5.9 – Maximum power per channel versus number of channels which ensures SRS degradation below 1 dB for all channels………...……….30
Figure 3.2.1.1 – Block diagram of NRZ transmitter...…....34
Figure 3.2.2.1 – Bock diagram of a RZ transmitter………....….35
Figure 3.3.1.1 – Evolution of with the signal x(t) ………....….36
Figure 3.3.2.1 – Modulated FSK signal………...37
Figure 3.3.3.1 – Waveform of a BPSK signal………...38
Figure 3.3.3.2 – Signal’s constellations: case of phase distribution given by (3.3.3.5) (on the left); and given by (3.3.3.6) (on the right) ………...………39
Figure 3.4.1.1 – Signal constellation of binary on-off keying (left), and binary phase shift keying (right) ……….………...40
Figure 3.4.2.1 – Structure of a DQPSK system [16]...…...41
Figure 3.5.1 – Wavelength allocation with broadcast video...…...42
Figure 3.5.2 – Video overlay system configuration………....…………43
Figure 3.5.3 – Transmission system of a VSB signal...…....43
Figure 3.5.4 – Spectrum evolution of the signal...…...44
Figure 3.5.5 – Raman Crosstalk Ratio versus Modulation frequency [20] ………....……45
Figure 3.5.6 – Raman Crosstalk at 55 MHz versus fiber length for four different wavelength separations [22] ……….………...46
Figure 3.5.8 – CNR of NTSC channel 2 as function of fiber length (based on: [21])....…47
Figure 3.5.9 – CNR of NTSC channel 2 as function of launched power of data signal (based on: [21]) ...…...47
Figure 4.2.1 – Setup to estimate CNR of the video signal...…....50
Figure 4.2.2 – Setup to estimate BER of a data signal………....…50
Figure 4.2.3 – Video Signal CNR versus fiber length: case of separated transmission……….………...………51
Figure 4.2.4 – Bit Error Rate versus fiber length………....………51
Figure 4.2.5 – Setup of the system to video and NRZ transmission...…....52
Figure 4.2.6 – CNR for the interaction case of Video signal with NRZ data signal: the blue line is to 16ps/nm/km of dispersion; the red line is to 10ps/nm/km of dispersion……….………...………53
Figure 4.2.7 – BER of data signal versus fiber length: in blue the case of data signal separated from video; in red the case of video and data travelling in the same fiber……….………....….54
Figure 4.2.8 – BER versus input data power at 130km...…...55
Figure 4.2.9 – CNR versus input data at 30km………...55
Figure 4.2.10 – CNR of video signal versus signal separation………...…56
Figure 4.2.11 – BER of data signal versus channel separation...…...57
Figure 4.2.12 – CNR versus fiber Length………...58
Figure 4.2.13 – BER of data signal versus fiber length to the cases: of data at 1620nm (blue line) and of data at 1490nm (red line) ...…...58
Figure 4.2.14 – CNR video signal versus Signal Separation………...59
Figure 4.2.15 – BER data signal versus Signal Separation………....…….59
Figure 4.3.1 – Setup of the system to estimate BER of the DQPSK signal………....……60
Figure 4.3.2 – Setup of the system to BER and CNR estimation of a DQPSK and a video signal respectively……….………...………61
Figure 4.3.3 – CNR of video signal versus Fiber Length………....……61
Figure 4.3.4 – BER of the data signal versus fiber length to the case of no video is transmitted (blue line) and to the case of video transmission crossing with signal (red line) ……….………...……62
Figure 4.3.6 – BER of the data channel versus Channel separation………....……63 Figure 4.3.7 – CNR versus fiber length to the case of data at 1620nm...…...64 Figure 4.3.8 – BER versus fiber length: red line) data at 1620nm; blue line) data at
1490nm……….………...64
Figure 4.3.9 – CNR versus wavelength separation for the case of data at 1620nm…....…65 Figure 4.3.10 – BER versus wavelength separation to the case of data at 1620nm…...65
List of Acronyms
AM Amplitude Modulation
AM-VSB SCM Amplitude Modulation Vestigial Sideband Subcarrier-Multiplexed APON Asynchronous Passive Optical Network
ASK Amplitude Shift Keying
BER Bit Error Rate
BPSK Binary Phase Shift Keying
CATV Cable Television
CNR Carrier to Noise Ratio
CO Central Office
CSRZ-OOK Carrier-Suppressed Return-to-Zero On-Off-Keying
CW Continuous Wave
DCF Dispersion Compensating Fiber
DPSK Differential Phase Shift Keying
DQPSK Differential Quadrature Phase Shift Keying
DSF Dispersion Shifted Fibre
EDFA Erbium Doped Fibre Amplifier
FSK Frequency Shift Keying
FTTH Fibre-To-The-Home
FWM Four-Wave-Mixing
GPON Gigabit Passive Optical Network
HD-TV High Definition Television
IM Intensity Modulation
MZM Mach Zehnder Modulator
NGPON New Generation Passive Optical Network
NRZ Non-Return-to-Zero
NRZ-DPSK Non-Return-to-Zero Differential Phase Shift Keying
NRZ-OOK Non-Return-to-Zero-On-Off-Keying
NTSC National Television System Committee
OOK On-Off-Keying
OSNR Optical Signal-to-Noise Ratio
PON Passive Optical Network
PSK Phase Shift Keying
QPSK Quadrature Phase Shift Keying
RF Radio Frequency
RIN Relative Intensity Noise
RZ Return-to-Zero
RZ-DPSK Return-to-Zero Differential Phase Shift Keying
RZ-OOK Return-to-Zero-On-Off-Keying
SPM Self Phase Modulation
SRS Stimulated Raman Scattering
SSB Single Sideband
VSB Vestigial Sideband
WDM Wavelength Division Multiplexer
“The greater the difficulty, the greater the glory”
Chapter 1. Introduction
1.1. Context
Even since the beginning of times, human kind has shown a need to communicate and pass information from one place to another. Communication systems had evolved along the times in order to better accomplish the task. That was enabled through the increase the data rate, to the improvement of the transmission fidelity.
In 1838 when Samuel F.B. Morse invented the telegraph, the communications entered in a new era, the electrical communications era. The first commercial telegraph using wire cables was implemented in 1844 and it was spread through the world in the following years. Wire cable was the only medium for electrical communication until Heinrich Hertz discover the long-wavelength electromagnetic radiation in 1887. The first implementation of this was the radio demonstration by Guglielmo Marconi in 1895.
In Electrical Systems, data is usually transferred over the communication channel by superimposing the information signal onto a sinusoidal varying electromagnetic wave which is known as carrier. The amount of information that can be transmitted is directly related with the frequency range over which the carrier wave operates, increasing the carrier frequency the available transmission bandwidth will be increased also.
With the advent of the laser in 1960, great interest in communicating at optical frequencies was created. With optical frequencies on the order of 5e14 Hz, laser has a theoretical information capacity which is approximately equal to 10 million TV channels.
For transmission at optical region two classes of transmission media can be used: an atmospheric channel or a guided-wave channel. In 60s a number of experiments using atmospheric optical channels were made, but its high costs of developing all the necessary components and installation, the limitations of the atmospheric channel imposed by rain, fog, snow, and dust make this communication system economically unattractive. At the same time, investigations into optical fibers were made. The extremely large losses (more than 1000dB/km) observed in the first optical fibers, was proved to be caused by the impurities in the fiber when in 1970, Kapron, Kleck, and Maurer fabricated a silica fiber having a 20dB/km attenuation. At this attenuation, repeaters spacing for optical fiber links become comparable to those of cooper systems.
The combination with the semiconductor technology, which provided the necessary light sources and photodetectors, enhanced the development of optical fiber systems growth. These systems had some inherent advantages over conventional copper systems, such as: low transmission loss and wide bandwidth, small size and weight, immunity to electromagnetic interference, electrical isolation, signal security and abundance in raw material.
Since the moment where the fiber losses were reduced to a low level, in 1970, in less than two decades, more than 10 million kilometers of fiber had been installed all over the world. The first links in 1977 operated at 800nm using GaAs-based optical sources, silicon photodetectors, and multimode fibers. A change from 800nm to 1300nm in the operation wavelength and from multimode to single mode fibers occurred in 1984 allowing to increase repeaterless transmission distance, the bandwidth, and to reduce the losses. Links at 1550nm were the next evolutionary step. These systems provide the lowest attenuation, but have much larger dispersion than the 1300nm links. Since the dispersion can be controlled by recurring to special fibers like DSF and DCF, links at 1550nm attracted much attention for high-capacity and long-haul links. With these evolutions and with the advent of the optical amplifiers was possible to increase even more the transmission distance and the bandwidth of the optical fiber systems.
With the evolution of the optical systems, optical transmission standards have also evolved significantly, and nowadays Passive Optical Networks (PONs) assume an important role in optical communications. A PON is a point-to-multipoint fiber network in which optical splitters are used to enable a single fiber to serve multiple clients and takes advantage of wavelength division multiplexing (WDM), using one wavelength for downstream traffic and another for upstream on a single fiber.
One of PON standards is GPON (Gigabit PON) [1], this standard uses 1490nm wavelength and typically a bit rate of 2.488Gb/s for downstream traffic, 1310nm wavelength and 1.244Gb/s for upstream traffic and 1555nm for video overlay. The work presented in this dissertation intends to study the cross effects that appears from the video and data transmission in the downstream path.
1.2. Motivation
GPON is being commercialized in several countries in the world. In some of them the penetration is already very high, like North Korea, Sweden, Japan, and United Arab Emirates. In Portugal, the government in cooperation with several operators is promoting the expansion of this technology through all the territory, making possible the access to a large portion of the population. The bandwidth provided by GPON equipments will be enough to the most part of the urban cases, however, the appearance of new services like HD-TV or WEB 2.0 will require in a near future, an increased the network performance.
When PON is deployed with the 1555nm [2] wavelength for video overlay, one of the issues that the operator may encounters is related to the non-linear effects. The video signal is transferred with much higher power than the data signal, and this could lead to the appearance of some cross effects that will affect the performance of data signal. To this configuration two signals are transmitted through the same fiber in downstream path. The signals may interact with each other in a non-linear way and, undesired effects will appear such as cross-phase modulation, stimulated Raman scattering, and four-wave-mixing.
These undesired effects will cause degradation in the signals being responsible by some degradation in the system performance.
With the need of increase bandwidth and performance of the systems in the actual scenario, these effects cannot be ignored and its study becomes fundamental to the definition of the parameters and choice of the components.
1.3. Structure and Objectives
This document is divided in five chapters, and the final objective is to study the cross effects between the data and the video channels in some scenarios, one of them the PON scenario.
In this first chapter the context of this work is presented with the motivation, main proposed objectives and the structure of the studies.
The second chapter describes the main nonlinear effects in optical fibers, and a survey on methods to minimize their effects in the system performance.
In the third chapter we present a brief description of the most usual modulation formats, like the intensity modulated, coherent and differential signals. In this chapter the video overlay signal is also presented in terms of its modulation format and how it is affected by non-linear effects like Stimulated Raman Scattering.
In chapter 4, by means of simulation, the simultaneous transmissions of video and data signals are studied. The video signal is composed by NTSC channels transmitted in the video distribution band (according to G.983.3). For the data, some parameters will be changed, like the modulation format used, the power of the channel, the channel separation between video and data, the transmission band. To evaluate the video channel, Carrier-to-noise (CNR) measurements will be used. To evaluate data, the Bit-Error-Rate (BER) will be estimated.
In the final chapter, the conclusions drawn from the work presented in this dissertation and suggestions for future work will be made.
1.4. Main Contributions
In the author’s opinion, the main contributions of this work may be summarized as follows:
Identification of the main sources of X-talk in PONs
Given the existing standards, the main potential x-talk signals were identified The X-talk between video and data channels was studied
The limitations in propagation for video and data signals when sharing in the same PON were identified and quantified.
One advanced modulation format, potential for NGPON2, was studied and its impact on and from the video channel characterized by means of simulation.
Chapter 2. Non-Linear Effects
2.1. Introduction
Non-linear effects have an important role in the propagation of the signals in optical fibers. Neglecting them or not efficiently compensating them can lead to uncontrolled signal degradation, which can result in increasing the BER and make difficult reception of data. In this chapter some of the non-linear effects will be exposed, they are: Cross-Phase Modulation (XPM); Self-Phase Modulation (SPM); Four-Wave-Mixing (FWM) and Stimulated Raman Scattering (SRS).
2.2. Self-Phase Modulation (SPM)
The Self-Phase Modulation is related with the change of phase in the electromagnetic field in a fiber caused by its own amplitude and by the fiber refraction coefficient. This phenomenon can be explained better looking at the expression that determines the evolution of electromagnetic field along a fiber [3]:
And to the expression of refraction index:
(2.2.2) This index includes a non-linear component that cannot be ignored. Using the expression of (2.2.1) in (2.2.2), (2.2.3) can be obtained, which represents the phase variation with the propagating field:
(2.2.3)
In (2.2.3) is possible to identify the non-linear phase component of the stemming from the refraction index, is given by:
(2.2.4) Where,
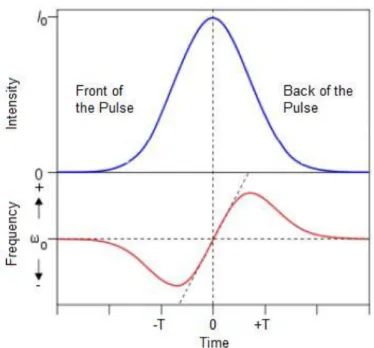
(2.2.5) As a result of this change of phase, new frequencies in the electromagnetic field will appear, causing spectrum enlargement. In the figure 2.2.1 can be seen the shift in the frequency caused by one Gaussian pulse. The front of the pulse will suffer a negative chirp causing a decrease on its frequencies while the back of the pulse will suffer a positive chirp causing an increase on its frequencies.
The effect caused by this chirp will depend on the dispersion regime of the wavelength range where the pulse propagates. If the dispersion regime is normal, β > 0, the higher frequencies tend to travel slowly and the lower frequencies tend to travel faster, causing enlargement of the pulse. If the dispersion regime isn’t normal, β < 0, the opposite is verified and a compression of the pulse occurs.
Figure 2.2.1 – Temporal variation of frequency shift caused by SPM in a Gaussian Pulse
2.3. Cross-Phase Modulation (XPM)
If two or more signals travels through the fiber at the same time, they will interact leading to non-linear effects such has Cross-Phase Modulation (XPM) or Four-Wave-Mixing (FWM).
Cross-Phase Modulation (XPM) is always accompanied by self-phase modulation (SPM) because both occur due to the dependence of the refractive index with the intensity of electromagnetic field in the fiber. XPM occurs because the effective refractive index seen by an optical beam in a nonlinear medium depends not only on the intensity of that beam but also on the intensity of other co-propagating beams with different wavelength, direction and/or polarization.
For better understanding of this phenomenon, the simultaneous co-propagation of two signals with polarization along the xx axis is considered, and the resulting electromagnetic field is given by the expression (2.3.1) [3]:
(2.3.1) Where c.c. means complex conjugate.
The nonlinear phase shift can be written as in (2.3.1)
(2.3.2) The first term of the expression (2.3.2) is due to the self-phase modulation and the second term is due to the cross-phase modulation. In that expression can be seen also that when two signals with equal intensity and polarization travel through the fiber, XPM effect is twice more strong that the effect of SPM.
XPM as SPM leads to enlargement of the spectrum, but such enlargement can be asymmetric. If the signals co-propagating in the fiber have not the same power, looking at the expression (2.3.2) is easy to understand that the XPM effect will not be noted in both the signals in the same way.
To get some insight in the behaviour of XPM effect a simulation using the VPI Systems software was made [4]. The setup in study was the following:
Figure 2.3.1 – VPI Systems setup to study XPM effect
In this setup, one weak pulse (2mW of peak power) and one strong pulse (20mW of peak power) will be transmitted. These two pulses will be multiplexed and then
pulses, and these pulses will be analyzed separately by signal analyzers. In a first step the XPM and the SPM parameters are turned off in the fibre, and the results will be saved in a file. In a second step, these parameters are enabled and the results previously saved will pass through a demux to separate the pulses and then analyzed together with the new results in the signal analyzers.
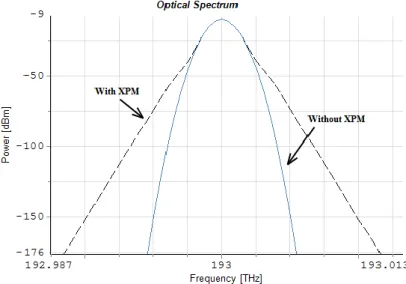
In the simulation, a pulse walks through another pulse in a different WDM channel interacting because both affect the refractive index of the fibre, as described. The optical spectrum of the weak pulse before and after the collision will be shown in the next figure:
Figure 2.3.2 – Optical Spectrum of the weak pulse with (black and dashed) and without (blue and solid) XPM effect
As the strong pulse is 10 times stronger than the weak signal, its effect will be noted clearly in the weak signal because of the XPM effect. In figure 2.3.2 can be seen that the presence of XPM causes broadening on the weaker signal.
2.4. Four-Wave Mixing (FWM)
The four-wave-mixing is a phenomenon that stems from the nonlinear response of bound electrons of a material to an applied optical field. More specifically, the polarization induced in the medium is non linear in the applied field but contains nonlinear terms whose magnitude is governed by the nonlinear susceptibilities.
The polarization term can be given as [3] :
(2.4.1) From (2.4.1) the term in more focus must be the 3rd order susceptibility that is responsible for the four-wave-mixing, and so can be written:
(2.4.2) Consider four waves oscillating at frequencies ω₁, ω₂, ω₃, ω₄ and linearly polarized along the same axis x. The total electric field can be written as:
(2.4.3) With:
(2.4.4) The four waves are assumed to propagate in the same direction.
Using the expression (2.4.3) in (2.4.2) comes:
(2.4.5) And can be found that Pj (j= 1 to 4) consists of a large number of terms
(2.4.6) Where θ₊ and θ₋ are defined as:
(2.4.7)
(2.4.8) The first four terms containing E₄ in the expression (2.4.6) are responsible for the SPM and XPM effects. The remaining terms result from FWM. Significant FWM occurs only if phase mismatch is almost null.
In the expression (2.4.6) the term containing θ₊ corresponds to the case in which three photons transfers their energy to a single photon at frequency ω₄ = ω₁ + ω₂ + ω₃. The term containing θ₋ in the same expression correspond to the case in which two photons at frequencies ω₁ and ω₂ are annihilated with simultaneous creation of two photons at frequencies ω₃ and ω₄ such that:
(2.4.9) The phase matching requirement for this process to occur is:
(2.4.10) It is relatively easy to satisfy ∆k = 0 in the specific case ω₁ = ω₂. This manifests as a strong pump wave at ω₁ that creates two sidebands located symmetrically at frequencies ω₃ and ω₄ with a frequency shift given by:
(2.4.11) Where is assumed that ω₄ > ω₃.
The number of FWM products generated by N waves is given by [5] [23]:
(2.4.12) In the figure 2.2.3.1 can be seen the FWM products generated in the case of four waves propagating in the fibre. Following the expression (2.4.12), these four-waves lead to the appearance of M = ½ (4³ - 4²) = 24pulses.
Figure 2.4.1 – Pulses generated by FWM
2.4.1 Techniques to reduce FWM crosstalk
The attractiveness of light wave communications is the ability of silica-optical fibres to carry large amounts of information over long distances. To utilize the available bandwidth, numerous channels at different wavelengths can be multiplexed on the same fibre (WDM systems) [6]. In such all-optical systems the effects of chromatic dispersion and nonlinearities accumulate during light propagation, imposing limits on the achievable performance. The use of dispersion-shifted fibres (DSF) can reduce the chromatic dispersion at 1550nm, but its use will enhance the efficiency of four-wave mixing products generation, reducing the phase mismatch that depends of fibre dispersion [7] [8].
chosen must be cost effective, accurate, easy to apply, and robust enough to account for a large number of constraints, such as total allowable power and channel spacing [9].
FWM efficiency depends on phase mismatch, which depends on channel separation and fibre dispersion coefficient [10], and so the next studies are focused on this.
First, a reduction of FWM crosstalk based on fibre dispersion coefficient is going be made, and then a reduction based on a system with unequal spaced channels.
2.4.1.1 Reduction of FWM crosstalk by changing the fiber
dispersion coefficient and by elimination of one of the
channels
To study this technique, some simulation was made, using the next setup based on VPI Systems software:
Figure 2.4.1.1 – VPI Systems Setup: 4 x10 Gbit/s WDM transmission over Dispersion Shifted Fiber (DSF)
In this setup, four NRZ signals with equal average power are multiplexed and then transmitted through 50 loops of a DSF fibre with 1 km of length and 0.2 dB/km of attenuation. A signal analyzer is used to observe the output optical spectrum. The fibre
output passes through a demux 1x8, being its outputs used to observe the eye diagrams of the NRZ signals and the FWM products.
In the above simulation, two cases were studied, first to the case of a low dispersion fibre of D=0.2ps/nm/km and then increasing the dispersion of the fibre to D=2.0ps/nm/km. To both cases another two schemes were analysed:
Four pulses propagating;
Three pulses propagating, turning off channel 2.
In the next two figures can be seen the Optical Spectrums and the eye diagrams to the case of D = 0.2ps/nm/km:
Figure 2.4.1.2 – Output optical spectrums: In the left side the case of four-wave propagation is showed and in the right side the case of channel 2 turned off can be seen.
Figure 2.4.1.3 – Eye diagrams: in the left side is the case of four-wave propagation; in the right side is the case of channel 2 turned off.
Case of four pulses propagating:
In the figure 2.4.1.2 at the left side the emergence of the FWM products is clearly seen and the approximation between the optical power of these products and the data channels is verified. In the eye diagrams, in this case (figure 2.4.1.3 – left side) can be seen the presence of some distortion caused by the crosstalk. Some FWM products will appear in the same wavelength than the signal pulses causing signal degradation affecting the eye diagrams.
Case of propagation with channel 2 turned off:
In this case, the effect of the channels 1, 3 and 4 on the channel 2 wavelength can be observed in the output optical spectrum with the appearance of a FWM product at this wavelength. The eye diagrams of the three channels propagated are cleaner and that
can be explained by the absence of the channel two, that did not influence the other channels now reducing the number of FWM products generated. The different separation of the signals can also be helpful to the lower signal degradation by shifting the FWM products from the wavelengths of the signals to out of there [7] [8] [11]. The performance increase of the system in this case can be also observed by looking at the power of the FWM products created. The power of these channels are low now than in the previous case.
Case of D = 2.0ps/nm/km:
Figure 2.4.1.4 – Optical Spectrums: : In the left side the case of four-wave propagation is showed and in the right side the case of channel 2 turned off can be seen.
Figure 2.4.1.5– Eye diagrams: left side) the case of four-wave propagation; right side) the case of channel 2 turned off.
From the above figures can be seen that in the case of D = 2.0ps/nm/km the effect of FWM is lower than in the case of the 0.2ps/nm/km. In this case, in the optical spectrum can be seen a lower optical power of FWM products compared with the case of lower dispersion in the fibre. In the eye diagrams of figure 2.4.1.5 lower noise can be observed also. That could be explained locking at the expression of FWM signal power that is given by:
(2.4.1.1) Where η is the efficiency of the mixing that is given by the expression (2.4.1.2):
The efficiency depends on the dispersion through ∆β as the next expression shows:
(2.4.1.3) From the above expression can be seen that the dispersion and the channel spacing are the higher contributors to the FWM products appearance. So, if the dispersion is small, ∆β≈0, so η≈1 and the FWM can have a huge impact in the performance of the system. In Figure 2.4.1.6 the FWM signal power evolution with the fibre length and the channel spacing can be observed:
Figure 2.4.1.6 – FWM signal power in function of fibre length and channel spacing for different values of dispersion [10]
2.4.1.2 Reduction of FWM crosstalk using unequal channel
spacing
To reduce FWM crosstalk in WDM systems, a technique based on unequal-spaced channel allocation can be used. The use of this technique has the main objective of prevent the FWM products from fall at the channel frequencies. If the frequency separation of any two channels of a WDM system is different from that of any other pair of channels, no FWM waves will be generated at any of the channels, thereby suppressing FWM crosstalk [7],[8]. Although the unequal-spaced channel allocation techniques greatly
less than that of conventional equal-spaced WDM systems when the operating optical bandwidth and the minimum channels spacing of both kinds of systems are the same [12].
To a better understanding of this technique a study was made, using the simulation setup of Figure 2.4.1.7:
Figure 2.4.1.7 – Setup to study the reduction of FWM effect using unequal channel spacing In the above system 8 NRZ signals will be transmitted with equal and unequal channel spacing. These signals will be multiplexed and then pass through a swept attenuator. An increasing attenuation is applied to each block, being useful for producing BER versus Received Optical Power plots. The output of the swept attenuator will be sent to a DSF fiber of 150km and then amplified. The channel four will be used for BER estimation, filtered before the OOK receiver by an optical filter centered at the required frequency.
In the next figures the channel plans and the results of BER vs. Average Channel Power are shown:
Figure 2.4.1.8 – Channel plans for normal and unequal channel spacing
Figure 2.4.1.9 – BER vs. Average Channel Power
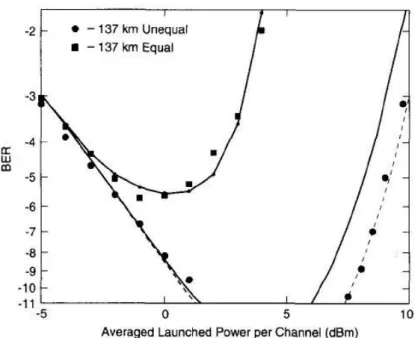
In [7] a WDM system with eight channels was studied when these channels are transmitted over 137 km of DSF. And the next figure can be observed to a better understanding of the above results:
Figure 2.4.1.10 – Probability of error of the third channel versus launched power per channel. The continuous line shows the theoretical result for unequal channel spacing. The dashed line is obtained
from the theory with a 30% reduction of efficiency and the small dots connected with a line are the simulation results for equal channel spacing
From Figure 2.4.1.10 it can be seen that the simulation and the expected results are close to each other. For low power levels both wavelength distributions (equal and unequal) have approximated results therefore pointing to the low impact of the FWM. When the launched power increases, the equal spaced channels system is dramatically affected by the FWM and performance is degraded, BER lower than 1E-6 is not achieved. The unequal channel spaced system, however does not suffers from FWM interference. Its BER keeps decreasing. 1E-9 is achieved for -1.5dBm in the figure 2.4.1.9 and for 0dBm in the figure 2.4.1.10 [7]. In figure 2.4.1.9 the increase of BER caused by other nonlinear effects cannot be observed, but in 2.4.1.10 it can. The BER is lower than 1E-9 for values of input power per channel between around 0dBm and +7dBm allowing a wide range of operation.
This technique allows fibre input power to be increased by as much as 7dB over the conventional equal channel allocation system. This allows a decrease on the receiver sensitivity. Alternatively the higher input power allowed by unequal channel spacing can be exploited by increasing system length for the same bit rate that was used in equal channel spacing [7].
Although the FWM crosstalk minimization this technique has the disadvantage of bandwidth expansion, that increases with the number of WDM channels. The total bandwidth required to unequal channel spaced systems is presented in the next expression:
(2.4.1.4) Where N is the number of channels, and n is the minimum channel separation in number of slots.
In the next table can be analysed the different bandwidth expansion factors to different cases in WDM systems with 4, 8 or 10 channels and chose the channel spacing to achieve a desired expansion:
Figure 2.4.1.11 – Examples of optimum unequal channel spacing [7]
In the above table Nun is the total number of slots for unequal channel spacing, Neq is the number of slots for equal channel spacing, and Bun/Beq is the bandwidth expansion ratio.
In the table can be seen that to a small number of channels a small n can be chosen and the bandwidth expansion factor will not be highly affected, but for a large number of channels the value of n must be as large as possible to avoid a large bandwidth expansion.
2.5 Stimulated Raman Scattering (SRS)
Stimulated Raman Scattering (SRS) is an important process that can turn optical fibres into optical amplifiers or Raman Lasers. This process can also limit the performance of multichannel systems, transferring the energy from a channel to the neighbour channels.
In any molecular medium, SRS can transfer a part of power from one optical field to another field, whose the frequency is downshifted by an amount determined by the vibrational modes of the medium. Basically, the incident light works as a pump and the incident photon loses its energy creating another photon with lower energy. The excess energy is absorbed by the medium under the form of molecular vibrations.
If in a fibre a signal with frequency ωs and a pump with frequency ωp where ωs < ωp, the energy will be transferred from the pump to the signal along the fibre length. The difference Ω = ωp – ωs is called Stokes translation. The initial increase of the Stokes wave is described by [3]:
(2.5.1)
The first term of the right side is the Raman coefficient and depends on the composition of the fibre core and can vary significantly with the use of different dopants. On the figure 2.5.1 can be seen the Raman coefficient for silica fibre as a function of frequency shift at a pump wavelength of 1μm.
Figure 2.5.1 – Raman-gain spectrum for silica fibers at a pump wavelength of 1μm.
The most important aspect of the Raman gain in optical fibres is that, it extends over a large band of frequencies (close to 40THz) with a peak located close to 13THz. This behaviour is due to the noncrystalline nature of silica glass, and so the fibres can work as large band amplifiers.
The factor of the optical gain is proportional to the intensity of the pump, as the next expression shows:
(2.5.2)
In a fiber with length L, the gain obtain is given by expression (2.5.3):
(2.5.3)
The Raman threshold is defined as the input pump power at which the Stokes power becomes equal to the output pump power:
(2.5.4)
To a better understanding of Stimulated Raman Scattering (SRS) some simulations using VPI Systems software were made. Firstly, the objective was to observe
wave with higher power than the Stokes wave was first studied, and next the case of pump and Stokes wave with the same power. The setup used is shown in the figure 2.5.2:
Figure 2.5.2 – Setup to study the SRS
In the above setup, two continuous waves separated by 12THz are multiplexed and transmitted along 100 loops of 1km fibre. The signals are then filtered and the power levels of each signal will be measured and compared.
In the next figure is shown the case in which, pump power is 1W and Stokes power is 1mW:
Figure 2.5.3 – Raman power transfer to the case of pump power higher than Stokes power In next figure is shown the case in which pump power is 1mW and Stokes power is 1mW:
Figure 2.5.4 – Raman power transfer in the case where the pump power equals signal power In Raman process, the stimulation occurs when the pump power exceeds a certain power level known as threshold power [12]. The threshold condition can be approximated by:
(2.5.5)
With Aeff being the effective area of the fibre, the gR the Raman gain, and Leff the effective length that can be written as:
(2.5.6)
In the above system, Aeff = 80e-12 and Leff = 21.48km. The channel separation is 12THz and so from figure 2.5.1 the Raman gain as a value of about 0.8e-13 m/W. From this values, a threshold power of about Pth = 745mW.
In that system, the first case studied with pump power of 1W the threshold power is achieved and so the Raman scattering is present that can be seen in the figure 2.5.3. In the case of pump power equal to stokes power at 1mW the threshold is not achieved and so, no Raman scattering is present causing almost no power transfer between the pump and the stokes waves.
In optical communication systems the channel powers are typically below 10mW and so SRS in not a limiting factor for single-channel lightwave systems. However it can affect the performance of WDM systems considerably [12]. In WDM systems numerous wavelengths are injected in to the fibre and the signals at longer wavelengths will be amplified by the shorter wavelength signals. This will lead to system degradation at lower powers than in the single-channel case [6].
In the second simulation using VPI Systems software, a system with 100 channels was simulated. All the channels have the same input power of 1mW. These channels are multiplexed and transmitted along a 50km DSF and then amplified. The effect of higher frequency channels in the lower frequency channels will be analyzed comparing the power of the channels and the eye diagrams of channels 1, 50, 51 and 100. The setup can be seen in the figure 2.5.5.
Figure 2.5.5 – Setup to study Raman Effect in a 100 channels system
The optical spectrums at input and output links is shown in figures 2.5.6 and 2.5.7:
Figure 2.5.6 – Optical Spectrum at input of the link
Figure 2.5.7 – Optical Spectrum at output of the link
In the next figure the eye diagrams of channel 1, 50, 51 and 100 are shown:
Figure 2.5.8 – Eye diagrams: In the left side channel 1; in the middle 50 and 51 channels; in the right side channel 100
From the eye diagrams is possible to see that the channel 100 shows a more closed eye diagram than the remaining. In this system is possible to notice the appearance of SRS effect, which makes the higher frequency channels work as pump to the lower frequency channels transferring some of its energy to that channels. The channels with highest frequencies transfer energy to the middle frequency channels and to the lowest frequency channels, while the middle frequency channels transfer to the lowest channels, this channels only receives energy from the others and do not transfer none. That explains the aspect of the output link spectrum, whose power of the channels decrease as the frequency increases.
In the next figure the maximum power allowable per channel versus the number of channels can be observed in a system with λ = 1.55μm, α = 0.2dB/km, A = 5e-7 cm² Leff=22km and ∆f = 10 GHz:
Figure 2.5.9 – Maximum power per channel versus number of channels which ensures SRS degradation below 1 dB for all channels
For systems with several channels the power limit decreases as 1/N because the Raman gain profile is extremely broad and the powers in all N channels contribute to SRS process. As more channels are added, the occupied optical bandwidth increases and the interchannel interactions become more significant and the maximum power per channel decreases as 1/N² [6].
From the figure 2.5.9 can be seen that to a 100 channels system, the maximum power per channel to the power transfer not occurs is lower than 1mW. The system in study as 1mW per channel and so, some power transfer is seen in figure 2.5.7.
2.6. Conclusions
All the nonlinear effects can be generally categorized as either scattering effects, or effects related to the intensity dependence of the refractive index (Kerr effects). The scattering effects are divided in: stimulated Raman scattering and stimulated Brillouin scattering. The Kerr effects are divided in: Self Phase modulation (SPM), Cross Phase Modulation (XPM), modulation instability, solution formation and four-wave-mixing (FWM). The nonlinear effects increase with the power travelling along the fiber.
The most relevant nonlinear effects to this work are the Cross Phase Modulation and the stimulated Raman scattering. One of the most relevant aspects of Raman scattering is that it extends over a large band of frequencies (approximately 40THz), affecting channels even if they are largely separated.
In a way to analyze some limitations of future technologies like WDM systems, four-wave-mixing was studied, and some ways to minimize its effects were presented. Increase the dispersion of the fiber or use unequal channel spacing in the transmission, proved to be two efficient systems to minimize FWM.
Chapter 3. Modulation Formats
3.1. Introduction
To increase the capacity of optical communication systems, we can increase bandwidth, the number of WDM channels or decrease the channel spacing. But this will bring some limitations caused by the nonlinear effects because more power will travel in the fiber and more channels will interact. Nonlinear effects like self-phase modulation (SPM), cross-phase modulation (XPM), four-wave mixing (FWM), and stimulated Raman scattering (SRS) will appear and to overcome this problems appropriate modulation formats can be used. In an optical communication system the ways to transmit information by an optical signal can be divided in: Intensity Modulation, coherent modulation and differential modulation. In the Intensity modulation the optical signal is codified in two levels of intensity depending if the bit value is a zero or a one. In the case of coherent modulation the signal is transmitted by changing the frequency, the amplitude or the phase of the carrier. The differential modulation is based on phase modulation and use differential encoding of the information. In this chapter we will present a brief analysis of these three different modulated signals. The video overlay signals will be explored also.
3.2. Intensity Modulated signals
In an optical communication system one of the main issues is how to convert an electrical signal into an optical signal. To do that, we can modulate directly the transmission laser or use an external modulator.
A possibility to modulate the signal is to use the intensity modulation (IM). That method is very simple, to represent the logical levels “1” or “0”, is just needed to send the signal with high or low strength respectively. The intensity of the logical level “0” does not have to be exactly zero, but the intensity of level “1” must be considerably greater than this intensity. Within the intensity modulated signals two kinds of modulation formats can be found: the return-zero (RZ) and the non-return-to-zero (NRZ).
3.2.1 Non-Return-to-zero (NRZ)
The simplest optical modulation format is the NRZ or often called as non-return-to-zero on-off-keying (NRZ-OOK). In this format the bit occupies the entire temporal slot, so in the case of a sequence of logical 1s, the power of the optical signal does not fall to state zero, and in the case of a sequence of zeros the signal maintains the power low along all sequence.
This modulation format has been the dominant format for optical communication systems. There are several reasons for its use in optical communications. The first one is that, compared with RZ signals NRZ requires a low electrical bandwidth for the transmitters and receivers. The second is that, compared with phase shift keying (PSK) it is less sensitive to laser phase noise. At last it has the simplest configuration for the transmitter and receiver. [13]
The block diagram of a NRZ transmitter is shown in figure 3.2.1.1, where optical signal is modulated with an external modulator which converts the electrical signal into an optical signal at the same data rate. The detection of NRZ signal is made by a
simple photodiode, which converts optical power into electric current. Considering the constant advancements in optical communications, NRZ format may not be the best choice for future high capacity optical networking systems. However, due its simplicity, and historic dominance, this format would be a good reference for the purpose of comparison. [14]
Figure 3.2.1.1 – Block diagram of NRZ transmitter
3.2.2 Return-to-zero (RZ)
In return-to-zero modulation format often called return-to-zero on-off-keying (RZ-OOK) , the bit level “1” does not occupy the entire temporal slot, and the bit power returns to zero before the end of each temporal slot. RZ transmitters can be implemented by the electronic generation of waveforms RZ, and these waves will modulate an optical carrier. Another implementation can be done by generating a NRZ optical signal with an external intensity modulator described above and then the output signal is modulated by a synchronized pulse train with the same data rate as the electrical signal using another intensity modulator as can be seen in the figure 3.2.2.1 [14].
Figure 3.2.2.1 – Bock diagram of a RZ transmitter
3.3 Coherent Signals
In order to improve the limitations present in the base-band signals (this signals cannot be transmitted directly to the most transmission channels because its characteristics are not the ideal to some frequencies ranges) some techniques were defined by increasing the frequencies of these channels, making them match the ideal range of frequencies of the transmission channel. The digital transmission systems, using modulation techniques with carriers, consist on changes the characteristics of a sinusoidal wave along the time.
For simplicity, the electric field of the transmitted signal is considered as a plane wave with the form:
(3.3.1) Where is the amplitude of the optical signal field, is the optical signal carrier frequency, and is the phase of the optical signal. To send information, amplitude, frequency, or phase of optical carrier can be modulated. Thus, one of the following three modulation techniques can be implemented: Amplitude shift keying (ASK), Frequency shift keying (FSK) and Phase shift keying (PSK).
3.3.1 Amplitude Shift Keying (ASK)
In this case the transmission is made by changing the amplitude of the carrier maintaining the phase and the frequency of the channels constant. The signal after modulation can be seen as:
(3.3.1.1)
Where is the signal after modulation, A is the amplitude of the signal, is the modulating signal, and is the carrier. In the next figure can be seen an example of the signal to a generic bit sequence of “0” and “1”:
Figure 3.3.1.1 – Evolution of with the signal x(t)
When the signal x(t) as the value “0” no signal appears in the output, when it has the value “1” the output is given by the carrier signal multiplied by the amplitude of the signal A.
3.3.2 Frequency shift keying (FSK)
In this modulation format the information is sent in the frequency, maintaining the phase and amplitude of the signal constants. To the different bit values, different frequencies are associated as can be seen next:
If = 1:
(3.3.2.1) If = 0:
(3.3.2.2) Assuming that = - and that = + where is the frequency shift, the expressions (3.3.2.1) and (3.3.2.2) will be given as:
(3.3.2.3) Where the “+” is for the case when bit value is “0” and “−” for the case when its value is “1”. Basically this signal can be seen as the addition of two ASK signals with different frequencies. One of them appearing when the bit value is “0” the other one when the bit value is “1”. The FSK signal after the modulation can be seen in the next figure:
Figure 3.3.2.1 – Modulated FSK signal
This modulation technique has the following characteristics: Noise tolerance;
The signal amplitude is constant, so its decision level does not have to be adjusted if variation in the received signal occurs;
3.3.3 Phase shift keying (PSK)
In this case is the phase that will change with the modulating signal, maintaining the amplitude and the frequency constants. In this type of signals, two variations can be found: Binary phase shift keying (BPSK) and Quadrature phase shift keying (QPSK). To a BPSK signal the carrier can be given by:
If = 1:
(3.3.3.1) If = 0:
(3.3.3.2) The next figure shows the waveform of a BPSK signal:
Figure 3.3.3.1 – Waveform of a BPSK signal
The quadrature phase shift keying is a multi-phase system based on PSK. In this system two consecutive binary pulses are combined and the four binary pairs are used
to create a sinusoidal wave of high frequency with four phases. The carrier can be given by the next expression:
= , i= 1,2,3,4 and 0≤ t ≤ 2T (3.3.3.3)
The above expression can also be written as:
, i= 1,2,3,4 and 0≤ t ≤ 2T (3.3.3.4) And can assume the values of:
(3.3.3.5) Or
(3.3.3.6) Sometimes is usual to represent the signals in a form called constellation, where in the horizontal axis is represented the terms in phase ( ) and in the vertical axis the terms in quadrature ( ). The constellations of the signal considering the different phase distributions are given by:
Figure 3.3.3.2 – Signal’s constellations: case of phase distribution given by (3.3.3.5) (on the left); and given by (3.3.3.6) (on the right)
3.4 Differential phase modulation formats
3.4.1 Differential Binary Phase Shift Keying (DBPSK)
Differential binary phase shift keying encodes information on the binary phase change between adjacent bits: a 0 is represented by no phase change, while a 1 is represented by a π phase change. DPSK can be implemented in NRZ or RZ format. In NRZ-DPSK the optical power fills completely the slot of a bit, but in the case of RZ-DPSK that does not occur and only a part of the slot is occupied. The main advantage in the use of DPSK instead of OOK comes from sensitivity improvement that can reach the value of 3dB in the limit of high signal-to-noise ratio [15]. That can be easily understood looking at figure 3.4.1.1. In that figure can be seen that the symbol spacing for DPSK is increased by a factor of √2 compared OOK to a fixed average power. The energy for each symbol is given by the square of its distance to the origin, and so the average power per symbol is in both cases x²/2. This increase of distance between symbols makes DPSK accept a √2 higher deviation of optical noise than OOK to the same BER, which will cause a 3-dB reduction in the OSNR required. This lower requirement of OSNR could be used to increase the transmission distance, reduce optical power requirements, or relax component specifications. [16]
Figure 3.4.1.1 – Signal constellation of binary on-off keying (left), and binary phase shift keying (right). Another benefit of DPSK is that, using balanced detection, it offers large tolerance to power fluctuations in the receiver decision circuit, because the decision threshold does not depend on the input power. DPSK is more robust to narrow-band optical filtering than OOK. DPSK is also more resilient than OOK to some nonlinear
effects because: the optical power is more evenly distributed for DPSK (power is present in every bit slot), which will reduce the bit-pattern-dependent nonlinear effects; other reason is that optical peak power is 3dB lower for DPSK to the same average power [16]. In the transmission, the data signal is first differentially encoded at the transmitter, which avoids error propagation that may occur by differential decoding at the receiver. To perform optical phase modulation a straight-linewidth phase modulator or a Mach-Zehnder Modulator can be used. [15]
3.4.2 Differential Quadrature Phase Shift Keying (DQPSK)
DQPSK is the one of the true multilevel modulation format (more than one bit per symbol) that has received more attention in optical communications lately. It transmits the four phase shifts {0, +π/2, -π/2, π} at a symbol rate of half the aggregate bitrate. A DQPSK transmitter is most conveniently implemented by two parallel MZMs operated as phase modulators. In the figure 3.4.2.1 can be seen the corresponding transmitter setup, consisting on a laser source operating continuously, a splitter to divide the light in two paths of equal intensity, two parallel MZMs operated as phase modulators, an optical π/2 phase shifter in one of the paths, and finally a combiner to produce a single output signal [15] .
In the above figure the symbol constellations of both paths are showed as well as the modulator output. The receiver system can be also observed, in this system, the DQPSK signal is first divided in two equal parts, and parallel balanced receivers with differently biased delay interferometers is used to simultaneously demodulate the two binary data streams contained in the DQPSK signal.
3.5 Video Overlay Signals in Passive Optical
Networks
One of the main issues in APON deployment is the cost, because FTTH is always more expensive than the metallic networks. One way to overcome this issue is to increase the service revenues, and to do that more services and capacity of the PON is needed. Broadcast video service can bring revenue to this technology. A simple way to provide this service is separate the video signal from the data signal. WDM was selected to insert this third signal into the PON, and the factors that lead to this choice were: it is possible to use EDFAs for video amplification; allows a guard-band between the “basic band” and “enhancement band”; can use the common lasers and filters; and it leaves enough enhancement spectrum. The new wavelength allocation with this service can be seen in the next figure [2]:
Figure 3.5.1 – Wavelength allocation with broadcast video


![Figure 2.4.1.6 – FWM signal power in function of fibre length and channel spacing for different values of dispersion [10]](https://thumb-eu.123doks.com/thumbv2/123dok_br/16020151.1104201/43.892.145.776.473.663/figure-signal-function-length-channel-spacing-different-dispersion.webp)