www.ann-geophys.net/27/1035/2009/
© Author(s) 2009. This work is distributed under the Creative Commons Attribution 3.0 License.
Annales
Geophysicae
Statistical visualization of the Earth’s magnetotail based on Geotail
data and the implied substorm model
S. Machida1, Y. Miyashita2, A. Ieda3, M. Nos´e4, D. Nagata1, K. Liou5, T. Obara6, A. Nishida2, Y. Saito2, and T. Mukai7
1Department of Geophysics, Graduate School of Science, Kyoto University, Kyoto, Japan 2Institute of Space and Astronautical Science/JAXA, Kanagawa, Japan
3Solar Terrestrial Environment Laboratory, Nagoya University, Aichi, Japan 4World Data Center for Geomagnetism, Kyoto University, Kyoto, Japan 5The Johns Hopkins University, Applied Physics Laboratory, MD, USA 6Aerospace Research and Development Directorate/JAXA, Ibaraki, Japan 7Japan Aerospace Exploration Agency (JAXA), Tokyo, Japan
Received: 16 April 2008 – Revised: 18 November 2008 – Accepted: 17 December 2008 – Published: 2 March 2009
Abstract.We investigated the temporal and spatial develop-ment of the near-Earth magnetotail during substorms based on multi-dimensional superposed-epoch analysis of Geotail data. The start time of the auroral break-up (t=0) of each substorm was determined from auroral data obtained by the Polar and IMAGE spacecraft. The key parameters derived from the plasma, magnetic-field, and electric-field data from Geotail were sorted by their meridionalX(GSM)–Z(proxy) coordinates.
The results show that the Poynting flux toward the plasma-sheet center starts at least 10 min before the substorm onset, and is further enhanced atX∼−12RE (Earth radii) around 4 min before the onset. Simultaneously, large-amplitude fluc-tuations occurred, and earthward flows in the central plasma sheet betweenX∼−11RE andX∼−19RE and a duskward flow around X=−10RE were enhanced. The total pres-sure starts to decrease aroundX=−16RE about 4 min be-fore the onset of the substorm. After the substorm onset, a notable dipolarization is observed and tailward flows com-mence, characterised by southward magnetic fields in the form of a plasmoid.
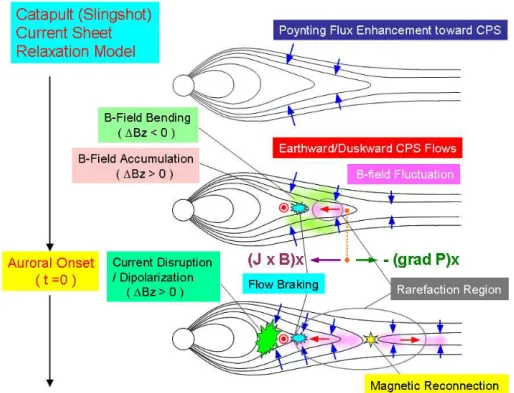
We confirm various observable-parameter variations based on or predicted by the relevant substorm models; however, none of these can explain our results perfectly. Therefore, we propose a catapult (slingshot) current-sheet relaxation model, in which an earthward convective flow produced by catapult current-sheet relaxation and a converted duskward flow near
Correspondence to:S. Machida ([email protected])
the Earth are enhanced through flow braking around 4 min before the substorm onset. These flows induce a ballooning instability or other instabilities, causing the observed current disruption. The formation of the magnetic neutral line is a natural consequence of the present model, because the relax-ation of a highly stretched catapult current-sheet produces a very thin current at its tailward edge being surrounded by in-tense earthward and tailward magnetic fields which were for-merly the off-equatorial lobe magnetic fields. This location is the boundary between a highly stressed catapult current sheet and a Harris-type current sheet characterized by little stress. In addition, the flows induced around the boundary toward the current-sheet center may enhance the formation of the magnetic neutral line and the efficiency of magnetic recon-nection. After magnetic reconnection is induced, it plays a significant role in driving the substorm.
Keywords. Magnetospheric physics (Magnetotail; Storms and substorms) – Space plasma physics (Nonlinear phenom-ena)
1 Introduction
Numerous studies have sought to understand substorms (e.g. Akasofu, 1964; Russell and McPherron, 1973; Nishida, 1978); however, no consensus has been reached regarding the initial triggering mechanism.
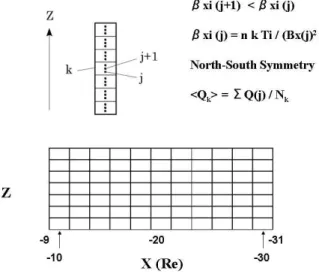
Fig. 1.Schematic illustration of the analysis method.
southward, the dayside reconnection is enhanced and the growth phase starts. The transport of magnetic flux into the tail lobe intensifies the cross-tail current and causes plasma-sheet thinning during this phase. The expansion phase is in-duced by the formation of the NENL, and subsequent earth-ward flows due to magnetic reconnection transport the north-ward magnetic field lines, causing dipolarization and an in-jection of energized particles into the inner magnetosphere. In the downtail region, the fast tailward flows consist of a plasmoid. The NENL resides in the near-Earth tail until the recovery phase starts. The plasma sheet is thickened in ac-cordance with the neutral line’s retreat to the downtail region in the recovery phase (Hones, 1976; Baker et al., 1996).
On the other hand, the current-disruption model (Chao et al., 1977; Lui et al., 1990; Lui, 1996) predicts that the dis-ruption of the cross-tail current begins at a distance of∼8RE (Earth radii) in the pre-midnight magnetosphere and the cur-rent starts to flow into the ionosphere, thus initiating the sub-storm. The disruption of the current can account for particle injection and energizing by convection surges of the inner magnetosphere. A rarefaction wave is launched from the current-disruption region, accompanying the plasma-sheet thinning and southward dipping of the magnetic field in the mid-tail region. Magnetic reconnection starts when this rar-efaction wave propagates down toX∼−20RE and induces the formation of the magnetic neutral line.
In a similar scenario to this latter model, a ballooning-instability model has been proposed, in which a ballooning instability (Roux et al., 1991; Miura et al., 1989; Cheng and Lui, 1998) is responsible for the explosive conversion of magnetic-field energy into the kinetic energy of the parti-cles. The excited surface waves propagate westward with the drifting ions. This disturbed region in the equatorial magne-tosphere can be mapped to the ionosphere as a form of the westward-traveling surge.
In a model that we tentatively call the plasma-sheet diver-gence model, a reduction of plasma convection is predicted, which follows a growth-phase period of enhanced convec-tion, and causes a divergence of plasma-sheet particles driven by diamagnetic drift and leading to a flux-tube content reduc-tion. This region is expected to be the current-disruption re-gion, and the substorm is triggered by the reduction in plasma convection (Lyons et al., 2003).
Another relevant substorm model is the thermal catastro-phe model (Smith et al., 1986), in which Alfv´enic turbu-lent waves propagate toward the central plasma sheet (CPS). Their subsequent conversion into kinetic Alfv´en waves and absorption of the wave energy by particles induces catas-trophic changes in the plasma-sheet conditions, resulting in substorms. In another possible model, a Kelvin–Helmholtz instability grows between the tailward magnetosheath and earthward flows in the plasma-sheet boundary layer (PSBL) on the flank of the magnetotail, contributing to the onset of the substorm. This model is called the boundary-layer model (Rostoker and Eastman, 1987).
In the magnetosphere-ionosphere (M-I) coupling model (Kan et al., 1988), the substorm is triggered by upward field-aligned current enhancements due to M-I coupling in the midnight sector near the poleward boundary of a high-conductance belt associated with diffuse auroral precipita-tion. The necessary conditions in this model are that the polar-cap potential must exceed a certain value (about 70 kV) and the convection-reversal region must overlap with the poleward gradient of the diffuse auroral conductance in the ionosphere in the midnight sector. The substorm subsides when one of these two necessary conditions is no longer sat-isfied.
To assess the validity of these models, we performed a statistical study using Geotail data, one of the best available datasets to date for the study of the magnetotail in the region covering−10>X(RE)>−30.
2 Method of analysis
The Geotail data employed in this study include ion-velocity-moment data from the Low Energy Particle instrument (LEP) (Mukai et al., 1994), magnetic-field data from the Magnetic Field instrument (MGF) (Kokubun et al., 1994), and electric-field data from the Electric Field Detector (EFD) (Tsuruda et al., 1994), all with a time resolution of 12 s. To determine the onset time of substorms with auroral break-up, we used the data from the Ultraviolet Imager (UVI) (Torr et al., 1995) and the Far Ultraviolet Imager (FUV) (Mende et al., 2000) on the Polar and IMAGE spacecraft, respectively.
We selected events detected when Geotail was located in the region−9>X(RE)>−31 and −3<Y(RE)<8, in GSM (Geocentric Solar Magnetospheric) coordinates, and dis-tributed them evenly into columns between −10RE and
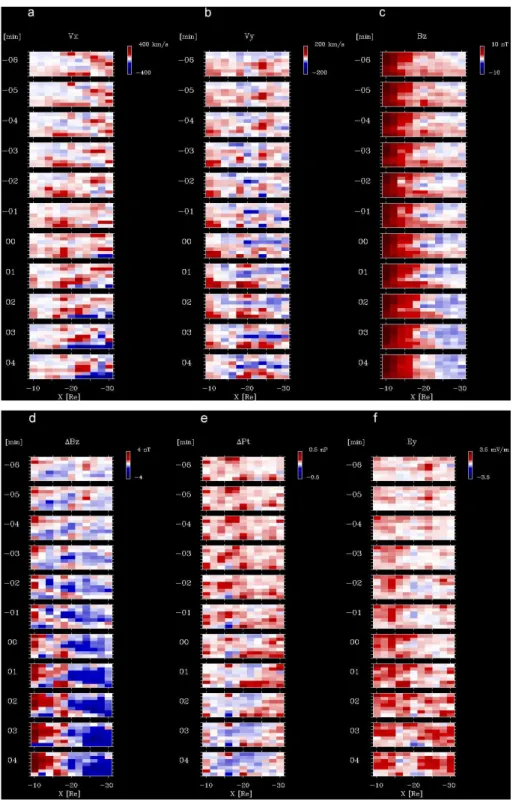
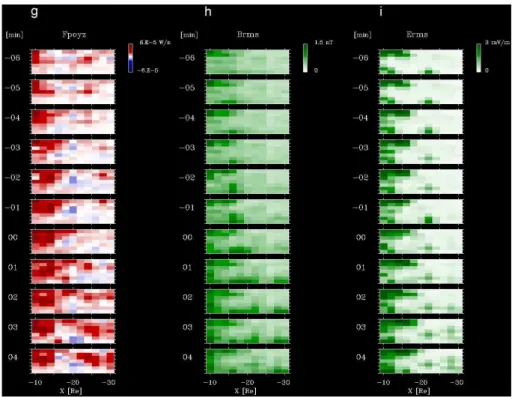
Fig. 2. Results of the analysis: (a)earthward flow velocity (Vx), (b) duskward flow velocity (Vy), (c)northward magnetic field (Bz), (d)deviation of the northward magnetic field (1Bz), (e)deviation of the total pressure (1Pt),(f) duskward electric field (Ey),(g)DC Poynting flux toward plasma-sheet center (Fpoyz),(h)rms value of the magnetic field (Brms),(i)rms value of the electric field (Erms).
of events assigned to the different columns are 30, 28, 16, 12, 14, 13, 16, 16, 25, 22, and 42, from the earthward to the tailward direction; i.e., fromX=−9RE to−31RE. Thus,
Fig. 2.Continued.
datasets were used to infer the spatial structure in specific 2 min intervals.
In each column, we sorted the data assuming that events with higher values of the parameterβix=nkTi/(Bx2/2µ0)were located nearer the plasma-sheet center, wheren,Ti,Bx,k, andµ0are the ion number density and temperature, theX component of the magnetic field, Boltzmann’s constant, and the magnetic permeability of free space, respectively. Next, we separated the data into seven bins aligned along the GSM Z direction for each column. We then obtained the aver-age values for various parameters to determine the spatial structure in different time intervals. We assumed north–south symmetry and combined the data in the northern and south-ern magnetotails, regardless of the sign ofBx.
In an ordinary superposed-epoch analysis, a given param-eter is plotted as a function of time, starting from a specific common event att=0. In contrast, we show variations for a given parameter in the two-dimensionalX(GSM)–Z(proxy) plane as a function of time. One parameter is shown as a function of three parameters:X(GSM),Z(proxy), andt. For this reason, we refer to our method as a multi-dimensional superposed-epoch analysis.
An advantage of our method compared with those that take βix as the ordinate is that it provides information regarding the scale length (thickness) in theZdirection, since the prob-ability of encountering a particular structure is approximately proportional to its thickness.
3 Results
We performed a series of superposed-epoch analyses using Geotail data to determine which model can explain the ac-tual substorms that occur in the real world. Our previous studies (Machida et al., 1999; Miyashita et al., 1999, 2000, 2003) mainly focused on substorm structural changes in the X-Y plane (i.e. the equatorial projection of the near-Earth magnetotail). Recently, a further study was performed by Miyashita et al. (2009) following this concept. In this study, we obtained variations in the meridional X-Z plane based on multi-dimensional superposed-epoch analysis (Machida et al., 2000), and found further detailed variations that com-plement our previous results.
after the onset of the substorm. The velocity of the earth-ward flow reduces inside ofX∼−13RE. This corresponds to flow braking (Shiokawa et al., 1997) caused by the en-counter of the fast flow with the high-pressure region on the near-Earth side; the plasma starts to flow around the dawn and dusk sides at this location, as will be shown below.
A notable tailward flow in the downtail at X=−20RE starts at t=0, consistent with a recent tailward-flow study (Ieda et al., 2008). This tailward flow grows into a well-developed plasmoid (Birn and Hesse, 1991; Machida et al., 1994; Ieda et al., 1998) in the downtail region.
The NENL is located aroundX=−20RE, the exact posi-tion of which may differ somewhat from event to event. As a result, the earthward flows can be observed atX=−20RE when the NENL is formed in the tailward ofX=−20RE, and the tailward flows can be observed when the NENL is formed in the earthward of X=−20RE. Therefore the latitudinal structure appearing inVxplot of Fig. 2a has to be considered carefully. Namely, the simultaneous appearance of tailward flows in the plasma sheet center and earthward flows in the higher latitude at aroundX=−22RE after t=1 min is not a real picture of single substorm event. We think that this re-flects that the values ofβix for the tailward flows are higher than those for the earthward flows.
The earthward flows occurring before the substorm onset are anticipated by the NENL model; however, the tailward flows develop aftert=0, which is in conflict with the pre-dictions from the NENL model. Instead, tailward flows are expected to develop a few minutes earlier than the substorm onset, at the same time as the earthward flows.
Also, the location of earthward CPS flows advances earth-ward before the onset, and it retreats tailearth-ward after the onset. This character has not been predicted by any existing model of substorm.
Figure 2b shows the duskward flow velocity,Vy. In this study, we restricted the region in the dawn–to–dusk direc-tion to −3<Y(RE)<8. Therefore, duskward flows
domi-nate the dawnward flows in the region −9>X(RE)>−13
(see Fig. 2b), consistent with the result obtained by Pater-son et al. (1998). This flow is enhanced att=−3 min and
quenched att=4 min. It seems that this duskward flow is an extension of the earthward flow in the CPS, turning its flow vector duskward by means of a flow-braking process. These flows appear to be closely related to the substorm onset. Be-fore the onset, relatively intense duskward flows can also be found on the earthward and plasma-sheet sides of the PSBL flows in the region−21>X(RE)>−27.
Intense duskward flows are also present around X=−18RE from t=−6 min. After t=1 min, this region expands tailward, and the duskward flow in the current sheet connects to both the earthward and tailward components of the NENL. Dawnward flows also appear on the lobeside of the downtail atX∼−17RE. This can be a cold-ion drift, and is found near the separatrix of the magnetic reconnection
topology (e.g. Nakabayashi and Machida, 1997; Fujimoto and Machida, 2007).
The variation of the northward magnetic field, Bz, is shown Fig. 2c. The value ofBz is large in the near-Earth region due to the contribution from the Earth’s dipole field. The other notable feature is thatBzbecomes negative in the off-equatorial region atX<−17RE; the region of negative Bzexpands over time. To quantify the variation inBz, we ob-tained1Bz, i.e. the deviation of the northward magnetic-field component from the average value in the time interval from t=−12 to t=−10 min, 1Bz=<Bz(t–1 to t+1 min)>−<Bz (−12 to−10 min)>. The result is shown in Fig. 2d. A
no-table characteristic of this panel is that the region represented in red, which corresponds to an increase in the northward magnetic field, first appears on the lobeside atX=−10RE, and this variation expands toward the plasma-sheet center as well as in the tailward direction as time progresses. The in-crease inBzwell beforet=0 on the earthward side is thought to be due to the accumulation of magnetic-field lines con-vected from the lobeside, and the increase around and after t=0 is related to dipolarization (Nagai, 1982). Other groups ofBzincreases are associated with earthward CPS flows be-tweenX=−13RE andX=−20RE (Shue et al., 2008). At the same time, regions characterized by negative1Bzvalues, showing a southward increase in the magnetic field, are also present, exhibiting two traces extending from the lower-left to the upper-right direction in the region betweenX=−11RE andX=−21RE and fromX=−25RE toX=−31RE. The location of the upper-right edge of the former expands to-ward the plasma-sheet center and merges with the latter at t=−3 min. The southward increase in the magnetic field fur-ther develops over time in the region tailward ofX=−20RE. This region correlates with the initial plasmoid position and its surrounding regions. Those variations are compatible with the predictions of the NENL (Hones, 1976; Baker et al., 1996) and the current-disruption models (Chao et al., 1977; Lui et al., 1990; Lui, 1996).
Figure 2e shows the deviation of the total pressure (i.e. the sum of the plasma and magnetic pressures) from the average value from t=−12 to −10 min, 1Pt=<Pt (t– 1 to t+1 min)>−<Pt (−12 to −10 min)>. The total pressure enhancement first appears in the lobe region at
−15>X(RE)>−19 and in the CPS at−20>X(RE)>−28.
The variation in the duskward electric field,Ey, is shown in Fig. 2f. Some enhancement of this parameter can be found in the upper-left corner (i.e. in the earthward lobe at X∼−10RE) and in the region around X=−24RE at t=−6 min. The former variation is further enhanced at X∼−12REatt=−4 min, and the enhancement expands tail-ward and also to the plasma-sheet center, while the latter variation seems to be quenched once just before the substorm onset. Notable enhancements appear tailward ofX∼−20RE just after the onset, which is thought to be the result of mag-netic reconnection. However, based on the NENL model (Hones, 1976; Baker et al., 1996), we expect an enhancement of the duskward electric field before the substorm onset, pos-sibly att=−4 min atX∼−20RE. This characteristic is not necessarily evident in our data.
If we compare Fig. 2f with Fig. 2a, we find that the re-gion of the duskward electric field att=−6 min at high lat-itudes nearX=−23RE is located just below the PSBL flow from the DNL. The exact mechanism remains unclear, but observations suggest that the plasma is convected toward the plasma-sheet center. At the same time, the plasma lo-cated earthward of that position drifts upward (away from the plasma-sheet center), where we find a weak dawnward elec-tric field fromt=−3 min tot=−1 min, corresponding to this
drift. In the region betweenX=−9RE and−15RE, we also find a strong duskward electric field, which may be related to both the penetration of the Poynting flux from the lobeside and the dipolarization. Aftert=0, the duskward electric field is widely enhanced downtail ofX=−20RE, which is related to magnetic reconnection. Interestingly, the duskward elec-tric field aroundX=−20REis not enhanced, even aftert=0, when magnetic reconnection starts and the NENL is formed around this region.
Figure 2g shows the Poynting flux of the direct-current (DC) component, using 1/12 Hz cut-off frequency electric and magnetic fields toward the plasma-sheet center,Fpoyz, the direction of which is vertically downward in each panel. There is a clear enhancement of this parameter around X∼−10REatt=−6 min, from which the region of enhanced Fpoyz propagates tailward. A notable enhancement around X=−12RE at t=−4 min was also found, related to the in-tensification ofEy. A comparison of Fig. 2g with Fig. 2d reveals that the1Bz<0 region is located on the CPS side and downtail of the enhanced-Fpoyz region. The negative variation inBz is caused by magnetic-field bending toward the plasma-sheet center associated with the enhancement of the DC Poynting flux or, equivalently, plasma convection toward the plasma-sheet center. This signature is also an-ticipated as a variation associated with plasma-sheet thin-ning (Akasofu, 1977; Lui et al., 1977), which is predicted by both the NENL (Hones, 1976; Baker et al., 1996) and current-disruption models (Chao et al., 1977; Lui et al., 1990; Lui, 1996). The Poynting-flux enhancement is, in a sense, analogous to the necessary conditions for the thermal-catastrophe model (Smith et al., 1986); Alfv´enic
alternating-current waves are assumed in that model, but the DC com-ponent is plotted in Fig. 2g. The enhancement ofFpoyzafter t=0 in theX<−20RE region is caused by magnetic recon-nection.
Figure 2h showsBrms, the root-mean-square (rms) value of the magnetic-field deviation from the average value us-ing 1/16 s samplus-ing once every 12 s. This parameter shows the magnetic-field intensity of low-frequency electromag-netic waves in the 0.17 to 8 Hz range. At t=−6 min, this
parameter is enhanced in two distinct regions in the near-Earth zone, at−10>X(RE)>−16. One of these regions is
located on the lobeside and the other near the plasma-sheet center. Intense wave activity on the lobeside is related to the enhanced Poynting flux toward the plasma-sheet center. On the other hand, the enhanced Poynting flux in the correspond-ing region located near the CPS is related to thermal fluctua-tions in the high-beta plasma sheet and also to the excitation of unstable waves associated with either an intensification of the cross-tail current or a high-speed flow. The largeBrms re-gion near the plasma-sheet center is centered atX∼−16RE att=−4 min. This active region extends toX=−21RE at t=0 and extends further down toX=−31REatt=1 min. Be-yondX=−21RE, large electromagnetic fluctuations are only found in the CPS region, likely associated with the tailward flow of the plasmoid. Thus, the region characterised by large electromagnetic fluctuations extends from the earthward side to the downtail region as time progresses. Although the lo-cation of the intense waves is different from the original pro-posal, the wave-turbulence character resembles the situation predicted by the current-disruption model (Lui et al., 2006).
A similar rms value of the electric-field variations from the average value with 1/32 s sampling for every 12 s, Erms, is shown in Fig. 2i. Again, this parameter repre-sents the electric-field intensity of the low-frequency waves. There exist four distinct regions of strong wave intensity: the near-Earth lobe at −9>X(RE)>−18, the near-Earth plasma-sheet center at−9>X(RE)>−15, the region around X∼−22RE, and the plasma sheet at −25>X(RE)>−31. The third region is close to the location where the NENL is formed. Further, the waves found in the fourth region are less intense and enhanced after the onset, and they seem to be related to the tailward flows produced by magnetic recon-nection.
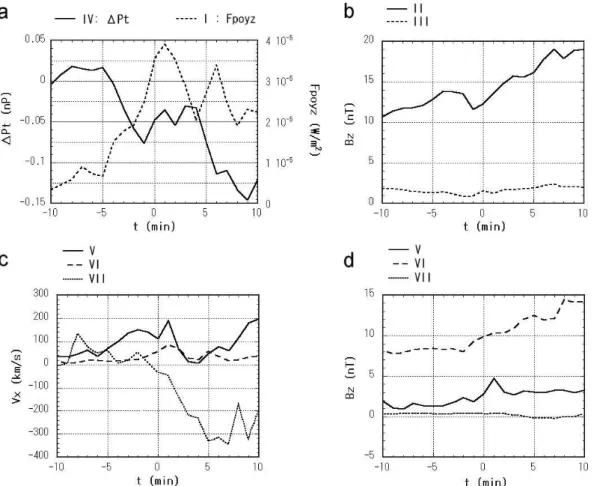
Fig. 3.Time variations of the relevant parameters:(a)1Ptin region IV andFpoyzin region I,(b)Bzin regions II and III,(c)Vxin regions V, VI, and VII,(d)Bzin regions V, VI, and VII.
(Tsyganenko and Fairfield, 2004).
There is already an increase in Poynting flux toward the plasma-sheet center at t=−10 min, but it is enhanced at t=−4 min. In contrast, the total pressure, Pt, starts to de-crease att=−4 min, although there is a slight increase from
t=−1 min to 5 min. Both curves show an approximate
anti-correlation with each other.
Figure 3b shows the time variations of the north-ward magnetic-field component, Bz, in region II (−9>X(RE)>−11; 4<Z/1Z<7) and region III (−13>X(RE)>−21; 2<Z/1Z<6) of Fig. 4. As it is associated with the enhancement of Fpoyz, Bz increases due to the accumulation of the magnetic fields in region II throughout the time interval shown in Fig. 3b, except around t=−1 min where a decrease is seen. On the other hand, the
decrease due to magnetic-field bending can be found at the beginning, and continues untilt=−1 min, from which time
Bzincreases in region III.
The temporal variations in earthward flow velocity, Vx, in regions V (−15>X(RE)>−19; 0<Z/1Z<2), VI (−9>X(RE)>−11; 0<Z/1Z<4), and VII
(−21>X(RE)>−29; 0<Z/1Z<1) are shown in Fig. 3c.
Fig. 4.Definition of the selected regions shown in Fig. 3.
There exists an enhancement of the earthward flows in region V from aroundt=−5 min, with a peak of 190 km s−1 att=1 min; they then quench for short time intervals until they start recovering from t=4 min. The earthward flows in region VI seem to be enhanced att=2 min, with a peak of 80 km s−1att=2 min. The variation inV
x in region VII indicates a slow earthward flow untilt=−1 min, upon which
Fig. 5.Conceptual illustration of the catapult (slingshot) current-sheet relaxation model.
The variations inBz in the same regions (i.e. V, VI, and VII) are shown in Fig. 3d. The gradual increase of Bz in region V seems to start att=−4 min, with a spiky peak at t=1 min. A rapid increase inBz, most likely related to dipo-larization, is seen in the curve of region VI. In contrast, the value ofBz in region VII starts to decrease att=2 min and it becomes negative (i.e. the magnetic-field direction turns southward for a short time from 4 min to 7 min after the sub-storm onset), after which it recovers. We believe that the tailward flow starting att=−1 min is created by magnetic
re-connection, and that it accompanies the southward magnetic field (Bz<0), but the magnitude ofBz is minus several nT, the effect of which is smeared out by large positive-Bzfields associated with the pre-existing plasma sheet, until the region is predominantly occupied by tailward flows due to magnetic reconnection.
The boundary inside and outside of which the duskward and earthward plasma flows dominate is located around X=−13RE. As explained above, we relate this boundary to flow braking. It is also possible that these flows are related to the flows that play a significant role in the plasma-sheet di-vergence model. The total pressure decrease, which is simi-lar to the flux-tube content reduction predicted by that model, first occurs atX∼−16RE in our data. This location seems to be slightly tailward compared with the location expected based on the plasma-sheet divergence model, which predicts that the reduction in plasma convection and subsequent flux-tube content reduction occur in the current-disruption region, generally considered to be atX∼−8RE.
We used the time when auroral break-up occurred as a time mark in applying our multi-dimensional superposed-epoch analysis. Evidently, auroral break-up is directly related to en-hancements of the M-I coupling. Both our study and the M-I coupling model (Kan et al., 1988) share this notable variation in the aurora at the time of the substorm onset; however, if enhancements of the M-I coupling indeed trigger substorms, other distinct variations (e.g. the dipolarization or magnetic reconnection) must be delayed relative to the time of auro-ral break-up. Such a signature is different from our result, in which those three variations occur almost simultaneously.
4 Discussion
We confirmed the evidence or events predicted by each of the substorm models considered. By scrutinizing our results, we found that an enhancement of the Poynting flux toward the plasma-sheet center starts at least 10 min before the sub-storm onset; it is further enhanced atX∼−12REabout 4 min before the onset. Simultaneously, large-amplitude magnetic fluctuations occurred, while earthward flows in the CPS be-tweenX∼−11RE andX∼−19RE and the duskward flow aroundX=−10RE were enhanced. The total pressure starts to decrease aroundX=−16RE att=−4 min.
The enhancement inFpoyz, the earthward flowVx in the CPS, the duskward flowVyin the near-Earth region and the magnetic fluctuationBrms, and the decrease ofPt all seem to start att∼−4 min. Therefore, it is difficult to reach a
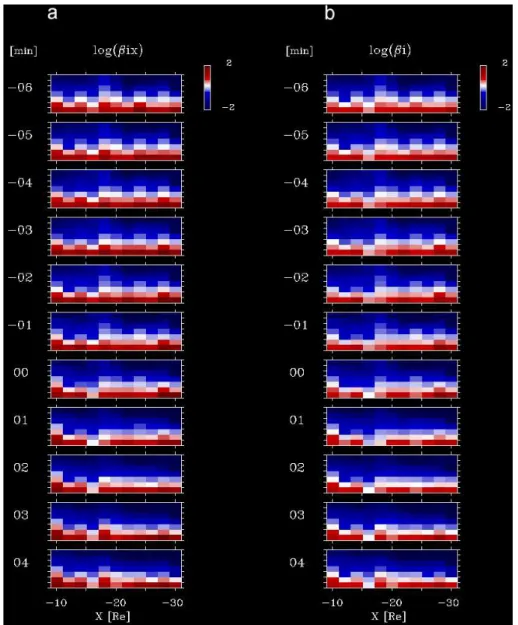
Fig. A1.Result of the analysis applied to the parameters(a)βixand(b)βi.
these are the variations found to start before dipolarization and magnetic reconnection occur. In addition, as can be seen in the panels showingBz and1Bz, the dipolarization, and the northward increase ofBz associated with the earthward convective flow are separate processes (Shue et al., 2008). Meanwhile, the variations inEy,Fpoyz, andBrmspropagate from the earthward to the tailward side, and magnetic recon-nection starts when these variations reachX∼−20RE.
The region around X∼−20RE is the transition region from the highly stretched, highly stressed dipole field (a cat-apult/slingshot current sheet) to the anti-parallel Harris-type magnetic field (Harris, 1962), characterized by less stress. If the cross-tail current in the catapult current sheet is strength-ened by the enhancement in the Poynting flux toward the plasma-sheet center, the catapult current sheet moves
earth-ward due to the domination of the earthearth-wardJ×Bforce over
the tailward pressure-gradient force.
Around the edge of the stretched dipole field, the flux tubes of the catapult current sheet and the surrounding flux tubes on the lobeside move relative to each other (Fig. 5). As a result, the surrounding flux tubes move toward the plasma-sheet center to fill the rarefied region forming a very thin current-sheet located at the center of intense earthward and tailward magnetic fields which were formerly the off-equatorial lobe magnetic fields. It is entirely possible that this boundary de-velops into the magnetic neutral line and that magnetic re-connection starts as a consequence.
catapult current-sheet relaxation process precedes the earth-ward and tailearth-ward flows associated with magnetic recon-nection. Therefore, the relaxation of the highly stretched dipole field line is a key to understanding the substorm on-set. For this reason, we call this scheme the catapult (sling-shot) current-sheet relaxation model. Accordingly, it is nec-essary to consider a different reconnection model that starts with the Harris solution and also identifies the mechanism to merge magnetic fields at the magnetic neutral line. Anoma-lous resistivity is certainly possible as an extension of large magnetic-field fluctuations. We must also study the role played by electron inertia or electron-pressure stress.
The region covered by the catapult current sheet actually connects the current-disruption region aroundX=−8REand the magnetic neutral line aroundX=−20RE. Both locations provide significant boundary conditions in considering the behavior of the catapult current sheet. At the inner boundary, the earthward flow and the magnetic-flux transport from the catapult current sheet affects the plasma stability, and they are responsible for the development of the current disrup-tion. In turn, the current disruption and the total pressure decrease affect the behavior of the catapult current sheet. At the outer boundary, this flow triggers magnetic reconnection, which also produces an earthward flow. In addition, flow braking aroundX∼−13REand the conversion of the plasma flow into the duskward direction are key processes related to the transfer of the momentum and energy across that region, causing current disruption and dipolarization. These are also key processes in understanding the stability of the catapult current sheet. The initial total pressure decrease seems to be closely related to the convective earthward flows.
After starting magnetic reconnection aroundt=0, this pro-cess plays a significant role by separating the magnetosphere into two parts: an inner region where current disruption, par-ticle acceleration, and M-I coupling are highly activated, and an outer region where a slow shock (Saito et al., 1995) and plasmoid (Machida et al., 1994; Ieda et al., 1998) are formed and particle acceleration takes place.
Appendix A
For clarification and to enable us to explore the relation-ship between the parameters displayed and the values of βix=nkTi/(Bx2/2µ0) and βi=nkTi/((Bx2+By2+Bz2)/2µ0), we show the results of our analysis applied to βix and βi in Fig. A1. We confirm that the data with higherβix orβi val-ues are located closer to the plasma-sheet center (midplane), and that the structures inβixandβiare almost the same, ex-cept in the region around the midplane, where the values of Bx,By, andBz are small and their ratio is variable, while Bxis large and dominates in the lobe region, resulting in the same pattern in theβix andβi plots. We also confirm that the distribution in theXdirection is relatively uniform, re-flecting the basic structure of the magnetotail, although there
are some random variations in that direction in both theβix andβiplots.
Acknowledgements. We wish to thank S. Kokubun and T. Nagai for the Geotail MGF magnetic-field data, K. Tsuruda and H. Hayakawa for the Geotail EFD electric-field data, G. K. Parks for the Polar UVI auroral-imager data, and S. B. Mende and H. U. Frey for the IMAGE FUV auroral-imager data. We thank T. Araki, Y. Kamide, D. Fairfield, M. Fujimoto, and the members of the World Data Cen-ter for Geomagnetism, and the Solar-Planetary Electromagnetism Laboratory at Kyoto University for helpful comments and discus-sions.
Topical Editor I. A. Daglis thanks two anonymous referees for their help in evaluating this paper.
References
Akasofu, S.-I.: The development of the auroral substorm, Planet. Space Sci., 12, 273–282, 1964.
Akasofu, S.-I.: Physics of Magnetospheric Substorms, D. Reidel, Dordrecht-Holland, 1977.
Angelopoulos, V., Baumjohann, W., Kennel, C. F., Coroniti, F. V., Kivelson, M. G., Pellat, R., Walker, R. J., Luhr, H., and Paschmann, G.: Bursty bulk flows in the inner central plasma sheet, J. Geophys. Res., 97, 4027–4039, 1992.
Baker, D. N., Pulkkinen, T. I., Angelopoulos, V., Baumjohann, W., and McPherron, R. L.: Neutral line model of substorms: Past results and present view, J. Geophys. Res. 101, 12975–13010, 1996.
Baumjohann, W., Paschmann, G., and Luhr, H.: Characteristics of high-speed ion flows in the plasma sheet, J. Geophys. Res., 95, 3801–3809, 1990.
Birn, J. and Hesse, M.: Substorm features in MHD simulations of magnetotail dynamics, in: Magnetospheric Substorms, Geo-phys. Monogra. Ser., vol. 64, edited by: Kan, J. R., Potemra, T. A., Kokubun, S., and Iijima, T., p177, AGU, Washington, D.C., 1991.
Chao, J. K., Kan, J. R., Lui, A. T. Y., and Akasofu, S.-I.: A model for thinning of the plasma sheet, Planet Space Sci., 25, 703–710, 1977.
Cheng, C. Z. and Lui, A. T. Y.: Kinetic ballooning instabil-ity for substorm onset and current disruption observed by AMPTE/CCE, Geophys. Res. Lett., 25, 4091–4094, 1998. Fujimoto, K. and Machida, S.: A generation mechanism of
electro-static waves and subsequent electron heating in the plasma sheet-lobe boundary region during magnetic reconnection, J. Geophys. Res., 111, A09216, doi:10.1029/2005JA011542, 2006.
Harris, E. G.: On a plasma sheath separating regions of oppositely directed magnetic field, Il Nuovo Cimento 23, 115–121, 1962. Hones Jr., E. W.: The magnetotail: Its generation and
dissipa-tion, in: Physics of Solar Planetary Environments, edited by: Williams, D. J., AGU, Washington, D.C., 559, 1976.
Ieda, A., Machida, S., Mukai, T., Saito, Y., Yamamoto, T., Nishida, A. Terasawa, T., and Kokubun, S.: Statistical analysis of the plas-moid evolution with Geotail observations, J. Geophys. Res., 103, 4453–4465, 1998.
asso-ciation between magnetotail reconnection and auroral breakup based on Geotail and Polar observations, J. Geophys. Res., 113, A08207, doi:10.1029/2008JA013127, 2008.
Kan, J. R., Zhu, L., and Akasofu, S.-I.: A theory of substorms: Onset and subsidence, J. Geophys. Res., 93, 5624–5640, 1988. Kokubun, S., Yamamoto, T., Acuna, M. H., Hayashi, K., Shiokawa,
K., and Kawano, H.: The Geotail magnetic field experiment, J. Geomagn. Geoelectr., 46, 7–21, 1994.
Lui, A. T. Y.: Current disruption in the Earth’s magnetosphere: Observations and models, J. Geophys. Res., 101, 13067–13088, 1996.
Lui, A. T. Y., Meng, C.-I., and Akasofu, S.-I.: Search for the mag-netic neutral line in the near-earth plasma sheet 2. Systematic study of IMP 6 magnetic field observations, J. Geophys. Res., 82, 1547–1565, 1977.
Lui, A. T. Y., Mankofsky, A., Chang, C.-L., Papadopoulos, K., and Wu, C. S.: A current disruption mechanism in the neutral sheet: A possible trigger for substorm expansions, Geophys. Res. Lett., 17, 745–748, 1990.
Lui, A. T. Y., Zheng, Y., Zhang, Y., Livi, S., R`eme, H., Dunlop, M. W., Gustafsson, G., Mende, S. B., Mouikis, C., and Kistler, L. M.: Cluster observation of plasma flow reversal in the magneto-tail during a substorm, Ann. Geophys., 24, 2005–2013, 2006, http://www.ann-geophys.net/24/2005/2006/.
Lyons L. R., Wang, C.-P., and Nagai, T.: Substorm onset by plasma sheet divergence, J. Geophys. Res., 108, 1427, doi:10.1029/2003JA010178, 2003.
Machida, S., Mukai, T., Saito, Y., Obara, T., Yamamoto, T., Nishida, A., Hirahara, M., Terasawa, T., and Kokubun, S.: GEOTAIL low energy particle and magnetic field observations of a plasmoid at
XGSM∼−142 Re, Geophys. Res. Lett., 21, 2995–2998, 1994. Machida, S., Miyashita, Y., Ieda, A., Nishida, A., Mukai, T., Saito,
Y., and Kokubun, S.: GEOTAIL observations of flow velocity and north-south magnetic field variations in the near and mid-distant tail associated with substorm onsets, Geophys. Res. Lett., 26, 635–638, 1999.
Machida, S., Ieda, A., Mukai, T., Saito, Y., and Nishida, A.: Sta-tistical visualization of the Earth’s magnetotail during substorms by means of multidimensional superposed epoch analysis with Geotail data, J. Geophys. Res. 105, 25291–25304, 2000. Mende, S. B., Heetderks, H., Frey, H. U., Stock, J. M., Lampton,
M., Geller, S. P., Abiad, R., Siegmund, O. H. W., Habraken, S., Renotte, E., Jamar, C., Rochus, P., Gerard, J. C., Sigler, R., and Lauche, H.: Far ultraviolet imaging from the IMAGE spacecraft. 3. Spectral imaging of Lyman-alpha and OI 135.6 nm, Space Sci. Rev., 91, 287–318, 2000.
Miura, A., Ohtani, S., and Tamao, T.: Ballooning instability and structure of diamagnetic hydromagnetic waves in a model mag-netosphere, J. Geophys. Res., 94, 15231–15242, 1989.
Miyashita, Y., Machida, S., Nishida, A., Mukai, T., Saito, Y., and Kokubun, S.: GEOTAIL observations of total pressure and elec-tric field variations in the near and mid-distant tail associated with substorm onsets, Geophys. Res. Lett. 26, 639–642, 1999. Miyashita, Y., Machida, S., Mukai, T., Saito, Y., Tsuruda, K.,
Hayakawa, H., and Sutcliffe, P. R.: A statistical study of varia-tions in the near and middistant magnetotail associated with sub-storm onsets: GEOTAIL observations, J. Geophys. Res., 105, 15913–15930, 2000.
Miyashita, Y., Machida, S., Liou, K., Mukai, T., Saito, Y.,
Hayakawa, H., Meng, C.-I., and Parks, G. K.: Evolution of the magnetotail associated with substorm auroral breakups, J. Geo-phys. Res., 108, 1353, doi:10.1029/2003JA009939, 2003. Miyashita, Y., Machida, S., Kamide, Y., Liou, K., Fujimoto, M.,
Saito, M. H., Ieda, A., Nagata, D., Ressell, C. T., Christon, S. P., Nose, M., Singer, H. J., Frey,, H. U., Shinohara, I., Mukai, T., Saito, Y., and Hayakawa, H.: A state-of-the-art picture of substorm-associated evolution of the near-Earth magnetotail ob-tained from superposed epoch analysis, J. Geophys. Res., 114, A01211, doi:10.1029/2008JA013225, 2009..
Mukai, T., Machida, S., Saito, Y., Hirahara, M., Terasawa, T., Kaya, N., Obara, T., Ejiri, M., and Nishida, A.: The Low Energy Parti-cle (LEP) experiment onboard the Geotail satellite, J. Geomagn. Geoelectr. 46, 669–692, 1994.
Nagai, T.: Observed magnetic substorm signatures at synchronous altitude, J. Geophys. Res., 87, 4405–4417, 1982.
Nagai, T., Fujimoto, M., Saito, Y., Machida, S., Terasawa, T., Naka-mura, R., Yamamoto, T., Mukai, T., Nishida, A., and Kokubun S.: Structure and dynamics of magnetic reconnection for sub-storm onsets with Geotail observations, J. Geophys. Res., 103, 4419–4440, 1998.
Nakabayashi, J. and Machida, S.: Electromagnetic hybrid-code simulation of magnetic reconnection: velocity distribution func-tions of accelerated ions, Geophys. Res. Lett., 24, 1339–1342, 1997.
Nishida, A.: Geomagnetic Diagnosis of the Magnetosphere, Springer, Heidelberg, 1978.
Paterson, W., Frank, L., Kokubun, S., and Yamamoto, T.: Geotail survey of ion flow in the plasma sheet: Observations between 10 and 50 RE, J. Geophys Res., 103, 11811–11825, 1998.
Pu, Z. Y., Kang, K. B., Korth, A., Fu, S. Y., Zong, Q. G., Chen, Z. X., Hong, M. H., Lui, Z. X., Mouikis, C. G., Friedel, R. W. H., and Pulkkinen, T.: Ballooning instability in the presence of a plasma flow: A synthesis of tail reconnection and current dis-ruption models for the initiation of substorms, J. Geophys. Res., 104, 10235–10248, 1999.
Rostoker, G. and Eastman, T.: A boundary layer model for magne-tospheric substorms, J. Geophys. Res., 92, 12187–12201, 1987. Roux, A., Perraut, S., Robert, P., Morane, A., Pedersen, A., Korth,
A., Kremser, G., Aparicio, B., Rodgers, D., and Pellinen, R.: Plasma sheet instability related to the westward traveling surge, J. Geophys. Res., 96, 17679–17714, 1991.
Russell, C. T. and McPherron, R. L.: The magnetotail and sub-storms, Space Sci. Rev., 15, 205–266, 1973.
Shiokawa, K., Baumjohann, W., and Haerendel, G.: Braking of high-speed flows in the near-Earth tail, Geophys. Res. Lett., 24, 1179–1182, 1997.
Shue, J.-H., Ieda, A., Lui, A. T. Y., Parks, G. K., Mukai, T., and Ohtani, S.: Two classes of earthward fast flows in the plasma sheet, J. Geophys. Res., 113, A02205, doi:10.1029/2007JA012456, 2008.
Saito, Y., Mukai, T., Terasawa, T., Nishida, A., Machida, S., Hira-hara, M., Maezawa, K., Kokubun, S., and Yamamoto, T.: Slow-mode shocks in the magnetotail, J. Geophys. Res., 100, 23567– 23581, 1995.
GEOS 9 observations of magnetic field dipolarization and bursty bulk flows in the near-tail, Geophys. Res. Lett., 24, 971–974, 1997.
Smith, R. A., Goertz, C. K., and Grossmann, W.: Thermal catastro-phe in the plasma sheet boundary layer, Geophys. Res. Lett., 13, 1380–1383, 1986.
Taguchi, S., Slavin, J., Kiyohara, M., Nose, M., Reeves, G., and Lepping, R.: Temporal relationship between midtail traveling compression regions and substorm onset: Evidence for near-Earth neutral line formation in the late growth phase, J. Geophys. Res., 103, 26607–26612, 1998.
Torr, M. R., Torr, D. G., Zukic, M., Johnson, R. B., Ajello, J., Banks, P., Clark, K., Cole, K., Parks, G., Tsurutani, B., and Spann, J.: A far-ultraviolet imager for international solar-terrestrial physics mission, Space Sci. Rev. 71, 329–383, 1995. Tsuruda, K., Hayakawa, H., Nakamura, M., Okada, T., Matsuoka,
A., Mozer, F. S., and Schmidt R.: Electric field measurements on the GEOTAIL satellite, J. Geomagn. Geoelectr., 46, 639–711, 1994.