Milan Bradić, Ljiljana Kosar, Bojana Kalenjuk* Received: February 2013 | Accepted: May 2013
Abstract
This paper considers the problem of satisfaction of business guests with hotel brands in North Ameri-ca. In analysis we used the guests responses (scores) given for 12 different elements of hotel product. In order to arrive at more accurate results, monitored hotel chains are grouped into price tiers. The aim of this paper is to indicate what facilities and services the North American business guests appreciate most. Industry trends and results may be beneficial to all hoteliers, especially in business tourism seg-ment.
Keywords: hospitality industry, hotel chains, business guests, customer satisfaction, service quality
Introduction
The first hotel chains formed in the mid 20th century, and since then there is a continuous competition between them. In territorial and quantitative development they used different strategies - ethnocentrism (focus on domestic market), polycentrism (territorial expansion by establishing branches abroad, with an aspiration for the preservation of national charac-teristics of the company), regiocentrism (greater ambitions in territorial growth, but with-in the region or contwith-inent) and geocentrism (overcomwith-ing national, regional and with- inter-con-tinental barriers, ie. a business strategy that aims to competitiveness in the global market).
The level of satisfaction with the selected hotel product is the key factor upon which the next selection of the product is made (Đeri et al, 2007). The struggle for every consumer is reflected in the new spatial solutions and services, aggressive marketing approach, price pol-icy, etc. However, most of these are not originally the solutions of hotel chains. It is known from earlier that hotel brands almost never create a new, but take proven concepts. These concepts are the work of small enterprising hoteliers, who do not have the strength to resist the influence of big corporations (Ransley and Hadyn, 2004). This situation is not so good for entrepreneurs, but it’s beneficial for the guests, because of the more diverse offer.
Customer satisfaction is essential to corporate survival. Several studies have found that five times as much time, money and other resources is spent to attract a new customer than
Business Guests Satisfaction in the Hotel Industry:
A Case Study of North American Hotel Chains
it is necessary to keep the existing (Naumann, 1995). This creates the challenge of maintain-ing a high level of service, awareness of customer expectations and improve the services and products (Naumann, 1999).
Knowing the expectations and demands of customers is essential because it provides an understanding of how the customer defines quality services and products, and on the other hand, it facilitates the development of user satisfaction questionnaire (Hayes, 1997). Previous research on data collected by hotel chains suggests that the image of the hotel and customer satisfaction with the performance of household, reception, food and drink facilities, as well as prices are positively correlated with customer loyalty. The performance of hotel house-keeping department, however, is determined to be most important for customers of hotel
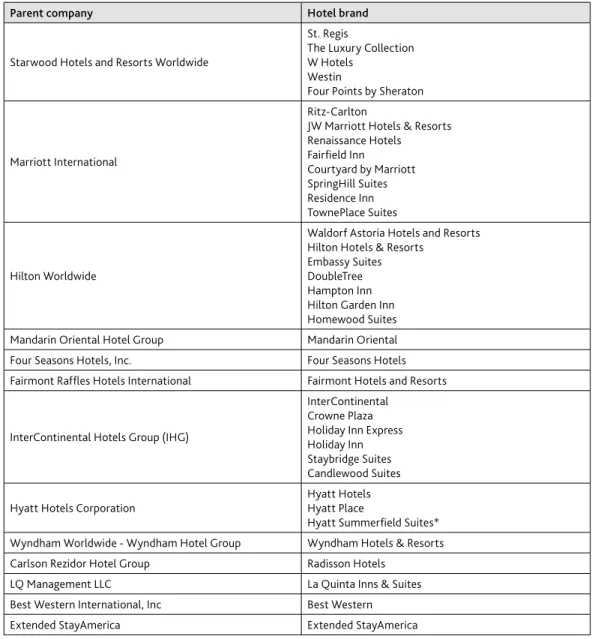
Table 1. Top rated hotel brends in survey and their parent companies
Parent company Hotel brand
Starwood Hotels and Resorts Worldwide
St. Regis
The Luxury Collection W Hotels
Westin
Four Points by Sheraton
Marriott International
Ritz-Carlton
JW Marriott Hotels & Resorts Renaissance Hotels Fairfield Inn
Courtyard by Marriott SpringHill Suites Residence Inn TownePlace Suites
Hilton Worldwide
Waldorf Astoria Hotels and Resorts Hilton Hotels & Resorts
Embassy Suites DoubleTree Hampton Inn Hilton Garden Inn Homewood Suites Mandarin Oriental Hotel Group Mandarin Oriental Four Seasons Hotels, Inc. Four Seasons Hotels Fairmont Raffles Hotels International Fairmont Hotels and Resorts
InterContinental Hotels Group (IHG)
InterContinental Crowne Plaza Holiday Inn Express Holiday Inn Staybridge Suites Candlewood Suites
Hyatt Hotels Corporation
Hyatt Hotels Hyatt Place
Hyatt Summerfield Suites* Wyndham Worldwide - Wyndham Hotel Group Wyndham Hotels & Resorts Carlson Rezidor Hotel Group Radisson Hotels
LQ Management LLC La Quinta Inns & Suites Best Western International, Inc Best Western Extended StayAmerica Extended StayAmerica
Source: Hotels 325-2012.
chains (Kandampully & Suhartanto, 2008). In other surveys, for evaliating the satisfac-tion of hotel guests researchers used different variables: price, service quality, cleanliness of rooms, security, employee skills, cleanliness of public areas, pleasant staff, reception speed, the noise level in the rooms, image of hotel, etc. (Haemoon, 1999, Saleh, 1991, Mey et al, 2006, Dragićević, et al., 2010, Blešić, et al., 2011, Dunjić, et al., 2012). Any improvement, increase in competitiveness, any re-design of the existing hospitality offer or those created through discontinued change, can be objectively assessed only through the understanding of the perception of the service value by the customer (Vukosav at al, 2009).
In order to facilitate better understanding of complex business relationships of largest hotel chains, below is a table with list of parent companies and brands within them (not all companies brends, only those among the top rated in the survey):
Methodology
For this survey we used the statistical data provided by Smith Travel Research database (STR Global) related to the hospitality industry. Data used here represent the business travelers’ evaluation on hotel brands in North American continent. Raw data were obtained by e-mail, where respondents evaluated the hotels in which were staying during 2012. For purposes of comparison, we used the corresponding data for 2011.
Hotel rating is done per tiers (select service and midprice, upscale and upper upscale, luxury, extended stay). Guests had the opportunity to rank the hotels in each tier and for maximum of 12 different attributes (Quality of sales staff, Arrange group travel/meet-ings, Meetings facilities, Corporate rate programs, Quality of food, Helpful and courteous staff, Physical appearance of hotel, Quality of business center, In-room business amenities, In-room amenities, Consistency of offering, Overall price/value relationship). The ranking was done in 1 to 6 Likert scale. For tabulation of results, hotel chains with highest score were marked in bold font.
The paper deals with data for hotel brands with statistical significant response (total of 221 valid completed questionnaires).
Select service and midprice segment
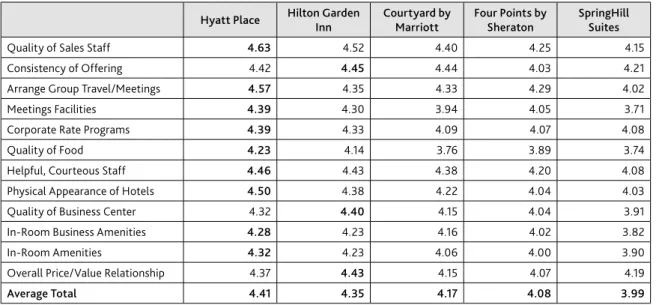
Customers rated Hyatt Place as the best selet service hotels chain in 2012, giving it the high-est score in all but three categories. The chain was founded in 2004, when Hyatt took over AmeriSuites (Hyatt Hotels Corporation 2010 annual report). Under the name Hyatt Place currently operate about 160 facilities. Hilton Garden Inn is in second place, followed by Courtyard by Marriott. Top-ranking brand in 2011, the Four Points by Sheraton, scored only enough for fourth place.
In the medprice segment, Hilton’s Hampton Inn, after sixth place in 2011, leave the best impression in 2012 in all but two specific categories - Corporate rate programs and Meet-ings facilities, both won by Holiday Inn (according to guests – the best hotel midprice brand in 2011).
traveler. These hotels offer around the clock selection of fresh food, which probably contrib-uted to the maximum scores for the Quality of food. High scores for In-Room Amenities can be attributed to the angular furniture and large LED TVs with connections for connecting to a computer. Another reason for the success lies in benefits of global sales network through the parenty company - Hyatt.
Hilton Garden Inn, on the other hand, achieved the highest score in three categories: Consistency of offering, Quality of business center and Overall price/value relationship. Hilton Garden Inn benefit from consumer services through mobile devices. The Brand is currently focusing on lobby renovation program, which should provide additional space that could be used for food and beverage facilities (Roberts, 2012).
Hampton Inn is also focused on public areas. By the end of 2012, in its more than 1,800 properties, the brand is globally applied the “perfect mix” lobby with seating areas and extra outlets for electronic devices. All hotels are currently promoting their recreational activities (Cordell, 2012).
Holiday Inn and Holiday Inn Express continues to benefit from recently completed glob-al relaunch, six-year investment that has given a new look for approximately 3,400 hotels worldwide. From InterContinental Hotels Group say that during the worst recession they spent about $ 1 billion, but are now seeing the results of that investment (Labarre, 2012).
According to STR, the largest number of hotel projects in North America is currently in the mid price tier, especially in urban locations. Hampton Inn was once considered for a hotel chain located in the suburbs, or along the road, but now it can be noticed movements to urbanized centers. Apart from the U.S., Mexico and Canada, Hampton Inn has aggressive plans to enter the European market (Cordell, 2012). Hyatt Place is targeting South Ameri-can, Indian and China markets (Rose, 2012). Hilton Garden Inn is also looking at opportu-nities in China, Colombia and Chile (Roberts, 2012).
Table 2. Best scores of Select service hotel brands
Hyatt Place Hilton Garden Inn
Courtyard by Marriott
Four Points by Sheraton
SpringHill Suites
Quality of Sales Staff 4.63 4.52 4.40 4.25 4.15 Consistency of Offering 4.42 4.45 4.44 4.03 4.21 Arrange Group Travel/Meetings 4.57 4.35 4.33 4.29 4.02 Meetings Facilities 4.39 4.30 3.94 4.05 3.71 Corporate Rate Programs 4.39 4.33 4.09 4.07 4.08 Quality of Food 4.23 4.14 3.76 3.89 3.74 Helpful, Courteous Staff 4.46 4.43 4.38 4.20 4.08 Physical Appearance of Hotels 4.50 4.38 4.22 4.04 4.03 Quality of Business Center 4.32 4.40 4.15 4.04 3.91 In-Room Business Amenities 4.28 4.23 4.16 4.02 3.82 In-Room Amenities 4.32 4.23 4.06 4.00 3.90 Overall Price/Value Relationship 4.37 4.43 4.15 4.07 4.19
Average Total 4.41 4.35 4.17 4.08 3.99
Upscale and upper upscale segment
In the upscale segment, guests gave average top score to Embassy Suites (part of Hilton), then to Doubletree (also Hilton’s brand). IHG’s Crowne Plaza, top-rated upscale brand in 2011, is in third place. Just two hundredths of a point separated three best brends. Custom-ers find that Embassy Suites has the best Consistency of offering and providing best Overall price/value relationship. Together with Doubletree, it has top marks for Physical appearance. Unlike most other brands in upper and upper upscale segment, Embassy Suites has an active ethnocentrical growing policy (within United States). In 2012 Embassy Suites has signed 15 new contracts, result of a few years ago developed flexible structure prototype that is more suitable for urban expansion (McAteer, 2012). One possible explanation for the high-est score in terms of Overall price/value relationship is - no matter which hotel to go, guhigh-ests will get a suite, complimentary breakfasts and use of fitness centers.
Doubletree top scored for Arrange group travel/meetings, Meetings facilities, Corporate rate programs, Helpful courteous staff and In-Room amenities. In the last few years, prior-ity was given to excellent qualprior-ity of the bedding, existence of fitness centers, Wolfgang Puck coffee products and Crabtree & Evelyn cosmetics and accessories for bathrooms (Palleschi, 2012). Highly scored category of staff indicates good results of recently introduced iPad training program, in which employees can undergo quick training using short quiz ques-tions. Internal research shows that this program has a positive impact on the occupancy, rates and customer loyalty. Doubletree is also developing rapidly. They opened 40 hotels in 2011 and around 50 hotels in 2012. Much of the growth is in Asian-Pacific region, the
Unit-ed Kingdom and continental Europe.
Crowne Plaza has recently launched repositioning projects and it is simultaneously work-ing on updatwork-ing individual properties and developwork-ing new chain identity. To make this pos-sible there are current discussion with parent company IHG and individual owners to iden-tify areas for improvement.
Table 3. Best scores of Mid price hotel brands
Hampton Inn
Holiday Inn
Express Holiday Inn La Quinta Fairfield Inn
Best Western
Quality of Sales Staff 4.31 4.16 4.04 3.86 3.99 3.78 Consistency of Offering 4.45 4.20 3.95 3.88 3.95 3.41 Arrange Group Travel/Meetings 4.24 4.06 4.14 3.80 3.89 3.74 Meetings Facilities 3.83 3.90 4.06 3.62 3.68 3.59 Corporate Rate Programs 4.23 4.37 4.27 4.10 4.03 3.90 Quality of Food 3.72 3.62 3.68 3.56 3.27 3.37 Helpful, Courteous Staff 4.34 4.26 4.15 3.97 3.98 3.85 Physical Appearance of Hotels 4.24 4.08 3.89 3.77 3.92 3.47 Quality of Business Center 4.07 4.01 3.92 3.67 3.71 3.47 In-Room Business Amenities 4.13 4.08 3.97 3.76 3.68 3.65 In-Room Amenities 4.10 3.99 3.87 3.80 3.64 3.52 Overall Price/Value Relationship 4.32 4.18 4.06 3.97 3.87 3.80
Average Total 4.17 4.08 4.00 3.81 3.80 3.63
In upper upscale segment, JW Marriott have been replaced at the best in 2011 by W Hotels in hundredth of points, which represents significant improvement from W’s seventh result in 2011. According to guests, most valued at W Hotels are Sales staff, Business amen-ities, Physical appearance and Food. JW Marriott has achieved the highest scores in the cat-egories of Consistency of offering, Helpful and courteous staff and Quality of the business center. The aforementioned brands are similar, almost equal in terms of Amenities and Rates, and belong to segment between the traditional premium and luxury brands. Both brands also have about 50 hotels all over the world.
Upper upscale segment in 2012 had a remarkable share, with occupancy above 70% and the average rate increased by 4.3% compared to 2011 (STR, 2012).
Although the W Hotels launched 1998th and among the youngest of the brands in its seg-ment, Starwood is renovating many North American properties. This includes an invest-ment of more than $ 100 million for dozens of hotels. For example, the W New York Union Square, recently refurbished all 270 rooms, while the W Chicago renovated restaurant, lobby and meeting spaces. JW Marriott’s top score for Quality of sales staff stems of ser-vice initiatives that have been implemented in recent years. They introduced daily rehears-al service procedures to verify service standards. It is planed to introduce more intensive staff training program in 2013 in order to improve employees intuition when guest need them, and when not (Gaskins, 2012). In order to improve the offer, the JW Marriott par-ticular attention is addressed to partnership with globally recognized brands, Aromathera-py Associates (bathroom products) and Christie’s for the art collection. Considering the cost premium above most of their competitors, Corporate rate programs unsurprisingly was the weakest category in the survey for both W and JW Marriott. InterContinental (which was the third best rated brand in upper upscale tier) and Hilton have the best result for Corporate rate programs. InterContinental has made a breakthrough to buyers, especially those plan-ning events, through its Insider Collection Program, where hotels work with planners to fit events specific to a hotel’s location. The brand has also launched a concierge program that provides information on the local market, and video content on its website and via mobile applications.
Table 4. Best scores of Upscale hotel brands
Embassy Suites Doubletree Crowne Plaza Wyndham Radisson
Quality of Sales Staff 4.42 4.30 4.43 3.98 4.05 Consistency of Offering 4.48 4.35 4.32 3.89 3.85 Arrange Group Travel/Meetings 4.55 4.56 4.34 4.02 4.24 Meetings Facilities 4.40 4.41 4.36 4.09 4.13 Corporate Rate Programs 4.26 4.31 4.27 3.90 3.93 Quality of Food 4.14 4.15 4.24 3.84 3.83 Helpful, Courteous Staff 4.40 4.43 4.38 4.07 4.02 Physical Appearance of Hotels 4.26 4.26 4.19 3.93 3.75 Quality of Business Center 4.23 4.30 4.41 4.13 3.88 In-Room Business Amenities 4.27 4.27 4.27 4.02 3.78 In-Room Amenities 4.24 4.27 4.26 4.13 3.83 Overall Price/Value Relationship 4.28 4.19 4.22 4.04 3.84
Average Total 4.33 4.32 4.31 4.00 3.93
In terms of Overall price/value relationship customers rated Marriott’s Renaissance buotique styled chain as the best. We can say that the growth of supply in North American upper upscale tier in 2012th almost non-exists - 0.1%, compared to year 2011 (STR, 2012). Over the last few years JW Marriott has opened properties in Chicago, Los Angeles, Miami and San Antonio, and announced plans for acquiring Jumeriah Essex House in New York. However, most hotel brands are looking for development opportunities in other continents. JW Marriott will soon open new hotels in Dubai, India and Hanoi. At the beginning of 2012 W Hotels opened a hotel in Paris, fol-lowed by the opening in Singapore, Bangkok, Milan and Guangzhou.
Luxury segment
The overall result of Starwood’s brands St.Regis/Luxury Collection was more than one-tenth higher than the second-ranked brand, Ritz-Carlton’s. St.Regis/Luxury Collection had a nearly perfect results for the Physical appearance of hotels and Helpful courteous staff, and were also top scored for Quality of sales staff, Meetings facilities, In-Room business amen-ities, In-Room amenities as well as Overall price/value relationship. Although the overall result for Waldorf Astoria Hotels & Resorts was slightly lower than the Ritz-Carlton, the Hilton brand is at the top of several criteria: Consistency of offering, Arrange group travel/ meetings, Meetings facilities, Corporate rate programs and Quality of food. The best rated brand in 2011 Four Seasons, slipped to fifth position.
Although owned by two different hotel groups, St. Regis and the Waldorf Astoria have common roots. Two New York hotels that bear their original names in the early 20th cen-tury were owned by the Astor family (The Encyclopedia Americana, 2011). In recent dec-ades, Starwood and Hilton decided to develop the global luxury brands. Currently, under the name of St. Regis operate 31 hotels with a number of new properties under construc-tion. Waldorf Astoria, which is established in 2006, is a little smaller - 22 hotels opened and 13 under construction, including properties in Panama City, Berlin, Amsterdam, Dubai and Table 5. Best scores of Upper Upscale hotel brands
W JW
Marriott
Inter
Con-tinental Hyatt
Renais-sance Westin Hilton
Quality of Sales Staff 4.95 4.85 4.84 4.81 4.70 4.94 4.74 Consistency of Offering 4.83 4.87 4.82 4.75 4.63 4.72 4.76 Arrange Group Travel/Meetings 4.81 4.79 4.64 4.85 4.71 4.67 4.68 Meetings Facilities 4.72 4.92 4.96 5.00 4.86 4.68 4.84 Corporate Rate Programs 4.46 4.49 4.77 4.58 4.41 4.39 4.77 Quality of Food 4.84 4.72 4.79 4.75 4.59 4.57 4.53 Helpful, Courteous Staff 5.03 5.08 4.92 4.91 4.92 4.95 4.91 Physical Appearance of Hotels 5.26 5.14 5.00 4.90 4.91 4.94 4.78 Quality of Business Center 5.00 5.06 4.90 4.88 4.90 4.90 4.83 In-Room Business Amenities 5.00 4.86 4.88 4.75 4.85 4.78 4.68 In-Room Amenities 4.94 4.94 4.88 4.84 4.85 4.81 4.59 Overall Price/Value Relationship 4.57 4.58 4.57 4.59 4.62 4.55 4.50
Average Total 4.87 4.86 4.83 4.80 4.75 4.74 4.72
Beijing. Together with the brand Conrad Hotels & Resorts, Hilton wants to be the fastest growing hotel group in the luxury segment (Vanderslice, 2012).
In the aftermath of the recession, the luxury hotel segment recorded a strong recovery. In the first seven months of 2012 average occupancy has reached pre-recession level of 72.5 percent (STR, 2012). In January-July period the average rates increased by 4.8% compared to 2011 (more than any other segment), although it is still below pre-recession levels. Rates will probably go up, given that 2012 demand in the North American market increased by 3% compared to the previous year, while the offer is declined by 0.5%.
At St. Regis butler service is standard, while the Waldorf Astoria properties provide per-sonal concierge for transient guests. Currently, the focus of St. Regis is given to the design, which is indicated in the research and evaluation. On the other hand, food is one of the most important components in history of the Waldorf Astoria – well known are hotel’s gas-tronomic “inventions” such as Veal Oscar, Red Velvet cake and Waldorf salad. Exception-al restaurants have led the brand to the top of the list in QuException-ality of food category. The man-agements of both chains agree that they benefit as parts of large hotel groups, as well as the Ritz-Carlton, which is part of Marriott.
Extended stay segment
While there were no results for them in 2011, Summerfield Suites in 2012 received the high-est scores across all criteria in the upscale extended stay segment. Their general result is almost 0.4 points higher than the second brand, Marriott’s Residence Inn. Last year’s win-ner brand, Staybridge Suites within the InterContinental Hotels Group, fell to third place.
Looking at the earlier data, this is not the first time for Summerfield Suites to be on the top (leading in 2008), but it will certainly be their last. Hyatt in early 2012 completed the switch of Summerfield Suites properties to its new extended-stay brand, Hyatt House. Hyatt Table 6. Best scores of Luxury hotel brands
St. Regis/ Luxury Collection
Ritz-Carlton Waldorf Astoria
Mandarin Oriental
Four
Seasons Fairmont
Quality of Sales Staff 5.27 5.06 5.18 5.05 5.05 4.82 Consistency of Offering 5.40 5.24 5.47 5.15 5.33 4.79 Arrange Group Travel/Meetings 5.04 5.11 5.19 4.89 4.88 4.84 Meetings Facilities 5.04 5.15 5.31 4.89 5.00 4.84 Corporate Rate Programs 4.52 4.49 4.94 4.58 4.43 3.91 Quality of Food 5.33 5.18 5.44 5.05 5.20 5.00 Helpful, Courteous Staff 5.70 5.49 5.25 5.40 5.18 5.04 Physical Appearance of Hotels 5.80 5.59 5.25 5.60 5.55 5.46 Quality of Business Center 5.50 5.34 5.08 5.40 5.32 5.08 In-Room Business Amenities 5.50 5.32 4.92 5.20 5.11 4.92 In-Room Amenities 5.60 5.48 5.08 5.40 5.42 5.12 Overall Price/Value Relationship 5.05 4.77 4.75 4.87 4.82 4.75
Average Total 5.31 5.19 5.16 5.12 5.11 4.88
House also got additional boost through Hyatt’s acquisition of LodgeWorks, which is com-prised of 17 properties of Sierra Hotel chain.
Although Summerfield Suites are traditionally highly regarded among the guests, many of them see the properties as a unit rooted in local environment, rather than a brand. Terri-torial distribution of Hyatt House will be a big brand advantage to compete against its main competitors, which are in volume two or three times as Summerfield Suites. Hyatt House intends to keep high scores of Summerfield Suites through business amenities such as remote printing and special room design features (Rose, 2012). Of social events, which have become a tradition in many brands in this segment, Hyatt House organizes summertime barbecues.
Results for mid price extended stay tier in 2012 are the same as and 2011 - TownePlace Suites is the leader, followed by IHG’s Candlewood Suites and Extended Stay America. In 2011, After 16 years and over 200 properties, TownePlace Suites brand began the process of renovating old hotels. The main objective of these activities is to add space for breakfast in hotels built before this became brand standard. The novelty of TownePlace is also a daily housekeeping service, which improves cleanliness of rooms for guests who stay for a longer period of time (refreshing bedding and washing). “Old” services as 24-hour fitness facilities and IT center, still have a strong attractiveness for guests (Nalewanski, 2012).
Table 7. Best scores of Upscale extended stay brands
Hyatt Summerfield
Suites Residence Inn Staybridge Suites Homewood Suites
Quality of Sales Staff 4.79 4.54 4.33 4.00 Consistency of Offering 4.93 4.17 4.29 4.09 Corporate Rate Programs 4.36 4.18 4.30 4.14 Helpful, Courteous Staff 4.86 4.56 4.48 4.32 Physical Appearance of Hotels 4.77 4.16 4.05 4.25 Quality of Business Center 4.31 4.10 3.89 3.94 In-Room Business Amenities 4.23 4.06 3.89 4.00
In-Room Amenities 4.54 4.16 3.79 3.79
Overall Price/Value Relationship 4.54 4.13 4.00 4.30
Average Total 4.59 4.22 4.11 4.09
Source: STR Global: Americas results 2012.
Table 8. Best scores of Midprice extended stay brends
TownePlace Suites Candlewood Suites Extended Stay America
Quality of Sales Staff 4.46 3.92 3.50
Consistency of Offering 4.15 3.86 3.23 Corporate Rate Programs 4.31 4.00 3.67 Helpful, Courteous Staff 4.38 4.00 3.38 Physical Appearance of Hotels 3.92 3.86 2.83 Quality of Business Center 3.62 3.62 2.83 In-Room Business Amenities 3.62 3.54 2.92
In-Room Amenities 3.62 3.54 2.92
Overall Price/Value Relationship 4.00 3.77 2.92
Average Total 4.01 3.79 3.13
According to a report Highland Group, in 2012, average rates in North American extend-ed stay properties grew more than the average growth rate for the entire North American logging industry. In just first six months of the 2012th average rate per day for extended stay tier increased by 7.2%, including an increase of 5.8% in upscale and a 9.6% in mid price prop-erties. The average occupancy was higher by 1.5%, ie. 75.8% in upscale, but lower by 3.1%, ie. 70.1% in mid price extended stay properties (the reason for this is the large number of hotels under construction and nearly bankrupt chain Extended Stay America).
Despite the limited, short-term construction in the upscale extended stay sector, custom-ers are seeing new options. In addition to Hyatt House’s, Sonesta International has also created its own extended stay brand converting 17 former Residence Inn and Staybridge Suites prop-erties. Both “new players” are preparing to impose their increased presence in years to come.
Conclusion
Looking at the North American logging market, the conclusion is that competition has never been so strong. After the economic recession, the hotel industry is showing good signs of recovery. The growth is greatest in midprice tier. In 2012 several relatively new hotel brands made a strong impact on business travelers. Some new market participants were able to take some of the primacy of hotel chains that were “untouchable” last two decades.
Concepts of spatial organization and new services, which are taken from small entrepre-neurs, have proved successful within large global corporations. The largest of them have rec-ognized the need to offer innovations in hotel products, and some offer new brand products to the market. Some use the tried and tested technique of constant investment and improve-ment of existing products, for example Holiday Inn, Waldorf Astoria, InterContinental. Others argue that the biggest costs arise when you have to change consumer view of an already well-known product. Therefore, it should not be surprising the success of relatively “new players”, such as the Hyatt Place. Noticeably among all brands is accentuation of ser-vices related to new and mobile technologies as inseparable tools of a modern business people. In this direction we should expect future solutions. Counterbalance these services are rec-reational (anti stress) services, which seem to be unavoidable even in lower price properties.
The biggest winners in this global market competition are certainly buyers. Hotel rates won’t be lower over time, but guests will get more options and better service for the same money.
References
Blešić, I., Čerović, S., Dragićević, V. (2011). Improving the service quality as a socially responsible activity of hotel companies. Amfiteatru Economic Journal, XIII( 29), 273 – 286. Cordell, P. 2012. news.hiltonworldwide.com/index.cfm/newsroom/detail/14570
Dragićević, V., Blešić, I., Stankov, U. (2010). Satisfaction and Behavioural Intentions of Congress Attendees: Evidence from an International Congress in Novi Sad (Serbia). Geo-graphica Pannonica 14 (1), 23-30.
Dunjić, J., Dragićević, V., Arsenović, D., Pantelić, M., Stankov, U. (2012). Conference Attendees’ Satisfaction: Evidence from Belgrade (Serbia). Turizam 16(4), 170-179.
Hayes, B.E. (1997). Measuring Customer Satisfaction: Survey Design, Use, and Statistical Analysis Methods. 2nd ed., ASQ Quality Press, Milwaukee, WI., pp. 7
Highland Group Reports: 2012 US Extended Stay National & 100 Largest Markets Report, Highland Group, pp. 131-154
Hotels 325-2012., HOTELS July/August 2012, www.hotelsmag.com Hyatt Hotels Corporation 2012 annual report, Part 1, Item 1, page 3
Kandampully, J., Suhartanto, D. (2003). The Role of Customer Satisfaction and Image in Gaining Customer Loyalty in the Hotel Industry. Journal of Hospitality & Leisure Market-ing 10(1-2), 3-25.
LaBarre, G., IHG Press Release 05.12.2012, www.littlerock.com/media/press/release.aspx-?id=252
McAteer, S. (2013). Developers overcome hotel space limitations, HotelNewsNow.com, http:// www.hotelnewsnow.com/articles.aspx/9656/Developers-overcome-hotel-space-limitations Mitzi, G. (2013). Where Marriott sees global luxury growth, CNN Money,
http://manage-ment.fortune.cnn.com/2013/03/20/marriott-hotels-growth/
Nalewanski, L. (2012). Marriott TownPlace Suites opens at Westview, The Frederick News-Post, November 20, 2012. http://www.fredericknewspost.com/sections/business/dis-play.htm?StoryID=143561#.UV6b8TfcAqo
Naumann, E. (1995). Customer Satisfaction Measurement and Management: Using the Voice of the Customer, Thomson Executive Press, 16.
Palleschi, R. (2012). DoubleTree by Hilton Doubles Up in Oregon, Aimbridge Hospitality, http://www.aimbridgehospitality.com/doubletree-hilton-doubles-oregon
Pei Mey, L., Khatibi Akbar, A., Yong Gun Fie, D. (2006). Measuring Service Quality and Customer Satisfaction of the Hotels in Malaysia: Malaysian, Asian and Non-Asian Hotel Guests. Journal of Hospitality and Tourism Management 13(2), 144-160.
Pizam, A., Ellis, T. (1999). Customer satisfaction and its measurement in hospitality enter-prises. International Journal of Contemporary Hospitality Management 11/7, 326-339.
Ransley, J., Ingram, H. (2004). Developing Hospitality Properties and Facilities - Second edition, Elsevier Butterworth-Heinemann, 5-10.
Roberts, A. (2012). news.hiltonworldwide.com/index.cfm/newsroom/detail/22254
Rose, K. (2012). Hyatt Retires Summerfield Suites Brand, Launches Hyatt House, Suc-cessfulMeetings.com, Northstar Travel Media LLC, http://www.successfulmeetings. com/Conference-News/meeting-facilities-/Articles/Hyatt-Retires-Summerfield-Suites-Brand,-Launches-Hyatt-House/
Rose, K., Interview for www.hyattpressroom.com, 13 Mar 2012
Saleh, F., Ryan, C. (1991). Analyzing service quality in the hospitality industry using the SERVQUAL model. The Service Industries Journal 11, 324-343.
STR Global: Americas results 2012.
The Encyclopedia Americana: a library of universal knowledge, Volume 21. Encyclopedia Americana Corp. 1919. Retrieved 15 May 2011.
Vanderslice, J. (2012). John Vanderslice of Hilton Worldwide Discusses Luxury Trends for 2012-13, JustLuxe, http://www.justluxe.com/luxe-insider/trends/feature-1779277.php Đeri, L., Plavša, J., Čerović, S. (2007). Analysis of Potenial Tourist`s Behavior in the Process
of Deciding Upon a Tourist Destination Based on a Survey Conducted in Backa Region. Geographica Pannonica 11(1), 70-76.