TCD
8, 3367–3411, 2014Glacier change in the Cariboo Mountains,
British Columbia, Canada (1952–2005)
M. J. Beedle et al.
Title Page
Abstract Introduction
Conclusions References
Tables Figures
◭ ◮
◭ ◮
Back Close
Full Screen / Esc
Printer-friendly Version
Interactive Discussion
Discussion
P
a
per
|
Discus
sion
P
a
per
|
Discussion
P
a
per
|
Discussion
P
a
per
|
The Cryosphere Discuss., 8, 3367–3411, 2014 www.the-cryosphere-discuss.net/8/3367/2014/ doi:10.5194/tcd-8-3367-2014
© Author(s) 2014. CC Attribution 3.0 License.
This discussion paper is/has been under review for the journal The Cryosphere (TC). Please refer to the corresponding final paper in TC if available.
Glacier change in the Cariboo Mountains,
British Columbia, Canada (1952–2005)
M. J. Beedle, B. Menounos, and R. Wheate
Geography Program, University of Northern British Columbia, Prince George, BC, Canada Received: 20 May 2014 – Accepted: 2 June 2014 – Published: 25 June 2014
Correspondence to: M. J. Beedle ([email protected])
TCD
8, 3367–3411, 2014Glacier change in the Cariboo Mountains,
British Columbia, Canada (1952–2005)
M. J. Beedle et al.
Title Page
Abstract Introduction
Conclusions References
Tables Figures
◭ ◮
◭ ◮
Back Close
Full Screen / Esc
Printer-friendly Version
Interactive Discussion
Discussion
P
a
per
|
Discus
sion
P
a
per
|
Discussion
P
a
per
|
Discussion
P
a
per
|
Abstract
We calculated dimensional change for 33 glaciers in the Cariboo Mountains of British Columbia for the latter half of the twentieth century. All glaciers receded during the pe-riod 1952–2005; area retreat averaged−0.19±0.05 % a−1. From 1952 to 1985, nine glaciers advanced. Following 1985, retreat rates accelerated to −0.41±0.12 % a−1.
5
Thinning rates likewise accelerated, from −0.14±0.04 m w.e. a−1 (1952–1985) to −0.50±0.07 m w.e. a−1 for the period 1985–2005. Temperatures increased from the earlier to the latter period for the ablation (+0.38◦C) and accumulation (+0.87◦C) sea-sons, and average precipitation decreased, particularly in the accumulation season (−32 mm,−3.2 %). Our comparison of surface area change with glacier morphometry
10
corroborates previous studies that show primary relations between extent change and surface area. We also find, however, that the strength and sign of these relations varied for different epochs.
1 Introduction
Glaciers are important components of the hydrologic system. They contribute
meltwa-15
ter along with organic and inorganic materials to freshwater systems (Bogdal et al., 2009; Hood et al., 2009; Moore et al., 2009; Marshall et al., 2011). These inputs, along with downstream impacts, are altered when glaciers undergo changes in extent and volume. As glaciers and ice caps (GIC; all glaciers outside of the Antarctic and Green-land ice sheets) lose volume, sea level rises (Radićand Hock, 2011). The largest GIC
20
contributions to sea level rise include the Canadian Arctic Archipelago and Gulf of Alaska regions (Gardner et al., 2011; Berthier et al., 2010), but recent work demon-strates that, collectively, small glaciers (<1 km2) contribute a significant amount to total GIC volume (Bahr and Radić, 2012).
Recent studies of glacier change use a variety of remotely-sensed products that
in-25
TCD
8, 3367–3411, 2014Glacier change in the Cariboo Mountains,
British Columbia, Canada (1952–2005)
M. J. Beedle et al.
Title Page
Abstract Introduction
Conclusions References
Tables Figures
◭ ◮
◭ ◮
Back Close
Full Screen / Esc
Printer-friendly Version
Interactive Discussion
Discussion
P
a
per
|
Discus
sion
P
a
per
|
Discussion
P
a
per
|
Discussion
P
a
per
|
(Paul et al., 2004; Berthier et al., 2010), and laser altimetry (Sapiano et al., 1998; Arendt et al., 2002). Typically these studies employ a combination of geomatic data to as-sess changes in glaciers for a particular region (Schiefer et al., 2007; Abermann et al., 2009; Bolch et al., 2010). Comprehensive inventories of glacier extent and change (e.g., Bolch et al., 2010), and measurement of glacier volume change of large regions
5
(e.g., Schiefer et al., 2007) primarily rely on satellite borne instruments. Such analy-sis is therefore limited to the last 30 years. Air photos afford the ability to document glacier change for up to three decades prior to the beginning of the satellite era. In this study we use aerial photogrammetry to investigate the extent and volume change of a subset of glaciers in western Canada for the periods 1952–1970, 1970–1985, and
10
1985–2005. The use of aerial photography thus provides a method to temporally ex-tend the glacier inventory studies of Schiefer et al. (2007) and Bolch et al. (2010). The use of aerial photography also provides an independent check against glacier mapping using lower-resolution satellite imagery.
The objectives of this study are to: (1) document the extent and volume change of
15
a subset of glaciers in the Cariboo Mountains of British Columbia (BC); and (2) assess the climatological conditions that could explain observed glacier change in the study area.
1.1 Study area and previous work
The Cariboo Mountains are the northernmost range of the Columbia Mountains of BC,
20
Canada (Fig. 1). The climate of the Cariboo Mountains is transitional, wetter than the Rocky Mountains to the east, and drier than the Coast Mountains. Total annual pre-cipitation (1971–2000 climate normals) averages 1014 and 679 mm on the windward (Barkerville, BC) and lee (McBride, BC) sides of the Cariboo Mountains, and annual temperature averages 1.9 and 4.4◦C respectively (Environment Canada, 2012).
25
Cari-TCD
8, 3367–3411, 2014Glacier change in the Cariboo Mountains,
British Columbia, Canada (1952–2005)
M. J. Beedle et al.
Title Page
Abstract Introduction
Conclusions References
Tables Figures
◭ ◮
◭ ◮
Back Close
Full Screen / Esc
Printer-friendly Version
Interactive Discussion
Discussion
P
a
per
|
Discus
sion
P
a
per
|
Discussion
P
a
per
|
Discussion
P
a
per
|
boo Mountains contributes to the Fraser River; however, some glaciers in the Pre-mier Range (a Cariboo Mountains subrange) contribute to the Columbia River (Fig. 1). Maurer et al. (2012) found that glaciers of the Cariboo Mountains nearly reached their Holocene maximum extents around 2.73–2.49 ka and that major retreat of the glaciers did not begin until the early 20th century. Luckman et al. (1987) showed that some
5
glaciers of the Premier Range advanced in the 1960s and 1970s in response to de-creased temperatures and inde-creased winter precipitation. Bolch et al. (2010) completed the first satellite inventory of glaciers in western Canada, identifying 536 glaciers in the Cariboo Mountains (2005) with a total surface area of 731 km2. Cariboo Mountains glaciers lost 7.06 km3of ice at a rate of−0.58 m water equivalent (w.e.) a−1during the
10
period 1985–1999 (Schiefer et al., 2007).
2 Methods
2.1 Imagery and supplemental data
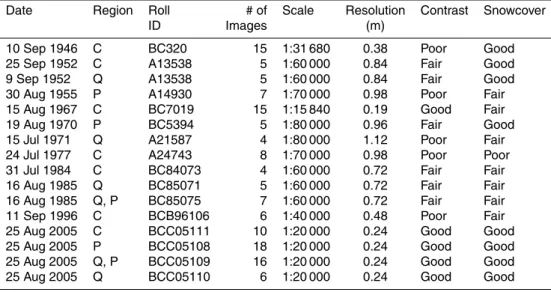
We measured glacier extent and surface elevation change from aerial photographs ob-tained from the British Columbia Government and Canada National Air Photo Library
15
(Table 1). Imagery prior to 2005 was scanned at a resolution of 12–14 µm from diapos-itives or negatives using a photogrammetric scanner whereas imagery from 2005 was available as digital aerial triangulation (AT) scans (digital photos with available exte-rior orientation; BC Ministry of Environment, 1998). Ground sampling distance ranges from 0.2 to 1.1 m depending on scanning resolution and image scale. Most photos were
20
taken in late summer, but dates range from mid-July to late-September. We used all im-ages to estimate glacier length and area change, whereas only those from 1946, 1952, 1984, 1985, and 2005 were used to determine surface-elevation change. As photos for each subregion were taken in different years, we thus report a mean area-weighted year: 1952 for photos taken in 1946, 1952, or 1955; 1970 for those of 1967, 1970, or
25
TCD
8, 3367–3411, 2014Glacier change in the Cariboo Mountains,
British Columbia, Canada (1952–2005)
M. J. Beedle et al.
Title Page
Abstract Introduction
Conclusions References
Tables Figures
◭ ◮
◭ ◮
Back Close
Full Screen / Esc
Printer-friendly Version
Interactive Discussion
Discussion
P
a
per
|
Discus
sion
P
a
per
|
Discussion
P
a
per
|
Discussion
P
a
per
|
are calculated using the actual duration between images. We report extent change of glaciers within three intervals (1952–1970, 1970–1985, and 1985–2005) and surface-elevation change for two epochs (1952–1985 and 1985–2005).
We use ClimateWNA (Wang et al., 2012) to assess the variability in temperature and precipitation during the periods for which we measure glacier extent and
surface-5
elevation change. The ClimateWNA v4.72 program (http://www.genetics.forestry.ubc. ca/cfcg/ClimateWNA/ClimateWNA.html) interpolates and extracts climate data for spe-cific locations for western North America, relying on downscaled PRISM (Daly et al., 2002) and historical data (Mitchell and Jones, 2005) to generate monthly time series of temperature and precipitation. Refer to Wang et al. (2012) for details. We use
av-10
eraged ClimateWNA output for points along the center-line every 100 m in elevation for all 33 glaciers (n=212) to estimate Cariboo Mountains glacier climatology, and for glaciers of the Castle Creek region (n=47), Quanstrom region (n=62), and Premier region (n=103) to estimate sub-regional climatology. We compare monthly tempera-ture precipitation data from ClimateWNA with measurements at Castle Creek Glacier
15
(Déry et al., 2010) for 2009–2011 to estimate the ability of ClimateWNA to represent conditions at high elevations in the Cariboo Mountains.
To investigate dominant synoptic patterns over the Cariboo Mountains, we use the National Centers for Environmental Protection/National Center for Atmospheric Re-search (NCEP/NCAR) reanalysis data (Kalnay et al., 1996) of 700 hPa geopotential
20
height anomalies. The 700 hPa geopotential surface provides a good indicator of gen-eral atmospheric conditions in the middle troposphere (∼3000 m), an elevation just above the uppermost extent of most glaciers in the Cariboo Mountains. We assess climatic conditions for balance years (October–September), and for ablation and accu-mulation seasons, defined as June–September and October–May, respectively.
25
2.2 Photogrammetry
de-TCD
8, 3367–3411, 2014Glacier change in the Cariboo Mountains,
British Columbia, Canada (1952–2005)
M. J. Beedle et al.
Title Page
Abstract Introduction
Conclusions References
Tables Figures
◭ ◮
◭ ◮
Back Close
Full Screen / Esc
Printer-friendly Version
Interactive Discussion
Discussion
P
a
per
|
Discus
sion
P
a
per
|
Discussion
P
a
per
|
Discussion
P
a
per
|
rived from tie points and common ground control points (GCP) horizontally and ver-tically distributed throughout the photos (Schiefer and Gilbert, 2007; Barrand et al., 2009). Within each subregion we used common GCPs to reduce systematic positional errors (Kääb and Vollmer, 2000; Schiefer and Gilbert, 2007; Schiefer et al., 2007). GCPs consisted of stable bedrock features or boulders obtained from aerial
triangu-5
lated stereo models (BC Ministry of Environment, 1998).
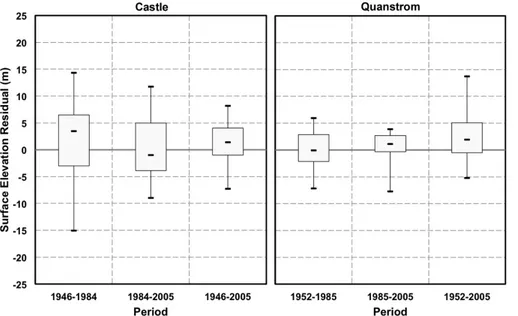
Eleven check patches, located on stable surfaces around each glacier region (Fig. 2), were used to quantify the relative accuracy of the stereo models (Fig. 3). Each check patch is comprised of 25 individual checkpoints in a five-meter grid; we estimated sys-tematic bias of stereo models from the mean residuals of the check patches. Trend
10
surfaces were created from these 11 mean residuals and used to apply a correction for glacier surface-elevation measurements.
2.3 Glacier subset selection
With the exception of 2005, glaciers of the Cariboo Mountains were not comprehen-sively photographed in any given year, and we thus concentrate our study on three
15
subregions of the Cariboo Mountains with suitable photographic coverage: (1) the Cas-tle Creek Glacier area; (2) the Quanstrom Mountain area; and (3) the Premier Range (Figs. 1 and 2). We selected our subset of glaciers based on: (1) availability of imagery, both in terms of temporal resolution and spatial scale; (2) snow cover and contrast; and (3) representativeness based on average glacier morphometry of Cariboo
Moun-20
tain glaciers presented in Bolch et al. (2010). Snowcover and poor contrast of older aerial photography reduce potential glaciers for study (Table 1). Sun angle with respect to glacier aspect and slope leads to local areas of high reflectivity and an absence of contrast, particularly for some south-facing glaciers. We omitted glaciers with these issues in our selection of a subset.
25
TCD
8, 3367–3411, 2014Glacier change in the Cariboo Mountains,
British Columbia, Canada (1952–2005)
M. J. Beedle et al.
Title Page
Abstract Introduction
Conclusions References
Tables Figures
◭ ◮
◭ ◮
Back Close
Full Screen / Esc
Printer-friendly Version
Interactive Discussion
Discussion
P
a
per
|
Discus
sion
P
a
per
|
Discussion
P
a
per
|
Discussion
P
a
per
|
the key morphometric determinant of glacier extent change (e.g., Serandbrei-Barbero et al., 1999; Hoelzle et al., 2003; Paul et al., 2004; Andreassen et al., 2008; Bolch et al., 2010; Paul and Andreassen, 2009). Our analysis oversampled glaciers in the largest size class as these glaciers likely play a dominant role in regional volume change and meltwater contributions to their respective watersheds (e.g., Arendt et al., 2006;
De-5
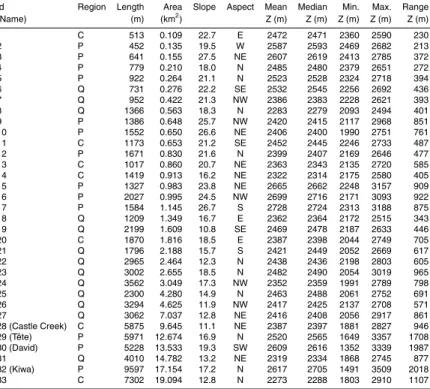
Beer and Sharp, 2007; Paul and Haeberli, 2008). All ice masses with the exception of Kiwa Glacier (glacier 32 in Fig. 2 and Table 3) are land-terminating glaciers.
2.4 Data collection and analysis
We manually collected glacier extents and point measurements of surface elevation directly from the stereo models. Complete glacier outlines were mapped for 2005,
10
and glacier extents were updated for previous years only below the transient snow-line (TSL), thus eliminating errantly mapping seasonal snow cover as glacierized area (e.g., Koblet et al., 2010). Delineation of planimetric glacier area above the TSL is prob-lematic as seasonal snow cover masks the glacier margin, and can erroneously inflate estimates of glacier surface area. Mapping of ice divides relied on surface elevation and
15
surface features such as crevasses and runnels; these divides were held constant in or-der to compare dimensional changes for a given ice body through time. Extent-change analysis was made for different glacier subsets by epoch based on aerial photo cover-age and snowcover. Collectively, our analysis allows us to compare area change for 33 glaciers for the epochs 1952–1985, 1985–2005, and 1952–2005 (33-glacier subset),
20
and for 26 glaciers in the additional epochs 1952–1970, and 1970–1985 (26-glacier subset).
Poor contrast and snowcover limit our analysis of glacier surface elevation change to seven glaciers for the periods 1952–1985, 1985–2005, and 1952–2005. For these glaciers, we measured surface elevation on a 100 m grid for large glaciers (>1 km2) and
25
TCD
8, 3367–3411, 2014Glacier change in the Cariboo Mountains,
British Columbia, Canada (1952–2005)
M. J. Beedle et al.
Title Page
Abstract Introduction
Conclusions References
Tables Figures
◭ ◮
◭ ◮
Back Close
Full Screen / Esc
Printer-friendly Version
Interactive Discussion
Discussion
P
a
per
|
Discus
sion
P
a
per
|
Discussion
P
a
per
|
Discussion
P
a
per
|
have measurements, assigning the average surface-elevation change of these obser-vations to the bins with missing values. This assumption was necessary only for periods that rely on the earliest year of photography (1952); missing data total a maximum of 27 % of total glacier surface area.
To calculate glacier-wide volume change from point measurements, we multiplied
av-5
erage elevation change for each 50 m elevation bin and summed over the entire glacier surface. Elevation bins and glacier surface were derived from epoch-specific glacier hypsometries created from the same point measurements. Where poor contrast led to an absence of measurements in the accumulation area, we used surface-elevation measurements for that elevation bin from the stereo model of a prior or subsequent
10
year. This approach assumes that surface elevation and extent underwent negligible change, an assumption that would be inappropriate in the rapidly changing ablation zones, but one that is more likely in the accumulation zones where this assumption was applied. We calculated glacier wide average thickness change based on the av-erage of the two extents that define a given period (e.g., Arendt et al., 2002; Barrand
15
et al., 2010). All values presented in water equivalent (w.e.) are calculated by assum-ing a density of 900 kg m−3
in the ablation area and 750 kg m−3
in the accumulation area (e.g., Beedle et al., 2014); ablation and accumulation areas are defined by each glacier’s median elevation (Table 2).
To estimate regional (Cariboo Mountains) glacier extent change, we extrapolated
20
from measurements of our subset of studied glaciers using the average rates of rel-ative extent change by size class for different periods. We used two methods to esti-mate Cariboo Mountains surface-elevation change: first, the average surface-elevation change of our subset of seven glaciers; and second, the average gradient of surface-elevation change with surface-elevation, defined as the average of all measurements within
25
TCD
8, 3367–3411, 2014Glacier change in the Cariboo Mountains,
British Columbia, Canada (1952–2005)
M. J. Beedle et al.
Title Page
Abstract Introduction
Conclusions References
Tables Figures
◭ ◮
◭ ◮
Back Close
Full Screen / Esc
Printer-friendly Version
Interactive Discussion
Discussion
P
a
per
|
Discus
sion
P
a
per
|
Discussion
P
a
per
|
Discussion
P
a
per
|
2.5 Error analysis
We estimated error in glacier extent and extent change based on a buffer approach (Granshaw and Fountain, 2006). Our buffer (±5 pixels) yields widths of∼5.5 to 1.3 m, depending on image resolution. Error in extent change is calculated as the root mean squared error (RMSE) of the error estimates for the years that define a given period.
5
Average errors for the 33-glacier subset range from 0.8–2.4 % for extents, and from 2.3–3.6 % for extent change. These errors vary depending on image resolution (see Table 1) and glacier dimensions.
We used the standard deviation of 275 check points in 11 check patches to esti-mate error in our measurements of surface-elevation change (E∆Z). To account for
10
greater uncertainty over surfaces with reduced contrast, we added an error of±5 m for measurements above the TSL. In cases where measurements are absent due to poor contrast, we increased this added error term to±10 m (e.g., Tennant and Menounos, 2013). Error in measurements of surface-elevation change in the ablation area is 1σ of check points, whereas for the accumulation zone it is the quadrature sum of 1σ of
15
check points (E1) and the added error of±5 or 10 m for reduced contrast (E2):
E∆Z =
q
E12+E2
2 (1)
Converting to water equivalent units through density assumptions imparts an additional error term. To estimate error in the density assumption of 750 kg m−3for the
accumu-20
lation zone we used a range of possible values for accumulation-zone density (600– 900 kg m−3). We estimate error in our measurements of surface-elevation change in
water equivalent units (E∆Zw.e.) as:
E∆Zw.e.=
q
E∆2Zρ2+E2
ρ∆Z
2
(2)
25
TCD
8, 3367–3411, 2014Glacier change in the Cariboo Mountains,
British Columbia, Canada (1952–2005)
M. J. Beedle et al.
Title Page
Abstract Introduction
Conclusions References
Tables Figures
◭ ◮
◭ ◮
Back Close
Full Screen / Esc
Printer-friendly Version
Interactive Discussion
Discussion
P
a
per
|
Discus
sion
P
a
per
|
Discussion
P
a
per
|
Discussion
P
a
per
|
We estimate volume change error (EVOL) after Barrand et al. (2010) as:
EVOL=
v u u t
bin
X
1
(EbinAbin)2 (3)
whereEbin is the error (E∆Zw.e.) andAbinis the surface area of each 50 m bin.
Previous work indicated a spatial correlation of 1000 m in photogrammetric DEMs
5
(Rolstad et al., 2009), and others have calculated a number of independent measure-ments (n) assuming a correlation scale of 1000 m (Barrand et al., 2010). We calculated degrees of freedom for each glacier from point measurements of surface-elevation change in epochs with complete spatial coverage. Using the Incremental Spatial Auto-correlation tool in ArcGIS 10.1 we calculated Auto-correlation distances that range from 350
10
to 2,000 m, yielding effective degrees of freedom that range from 1 to 5.
We used cross-validation to test the accuracy of our extrapolation of Cariboo Moun-tains glacier extent and surface-elevation change. In our test of glacier extent extrapo-lation, we partitioned the 26-glacier subset into four scenarios where we withheld 75, 50, and 25 % of the individual glaciers as a validation set and retained the remainder as
15
a training set. Set selection was randomized within each size class, ensuring each set retained glaciers of varying size. Each of the three scenarios was applied to observa-tions in five epochs: 1952–1970, 1970–1985, 1985–2005, 1952–1985, and 1952–2005. We used the standard deviation of these 15 test cases (±4.7 %) as an estimate of error in our extrapolation of the extent of all Cariboo Mountains glaciers. To estimate error in
20
our extrapolation of surface-elevation change, we partitioned our seven glacier subset into two scenarios where we withheld three and four individual glaciers as a validation set and retain the remainder as a training set. Each scenario was applied to observa-tions in three epochs: 1952–1985, 1985–2005, and 1952–2005. We used the variability of these six test cases to estimate error in our extrapolation of surface-elevation change
25
sub-TCD
8, 3367–3411, 2014Glacier change in the Cariboo Mountains,
British Columbia, Canada (1952–2005)
M. J. Beedle et al.
Title Page
Abstract Introduction
Conclusions References
Tables Figures
◭ ◮
◭ ◮
Back Close
Full Screen / Esc
Printer-friendly Version
Interactive Discussion
Discussion
P
a
per
|
Discus
sion
P
a
per
|
Discussion
P
a
per
|
Discussion
P
a
per
|
set (±0.077 m w.e. a−1); and (2) mean surface-elevation change within each collective 50 m elevation bin for the glacier subset (±0.089 m w.e. a−1).
3 Results
3.1 Regional representativeness
As expected, our glacier subset undersamples ice masses of the Cariboo Mountains
5
in all size classes except the largest size class (Fig. 4). Most glaciers in the Cariboo Mountains (40 %) fall in the 1.0–5.0 km2 size class compared to 20 % in our sample. In contrast, our subset contains 61 % glaciers exceeding 5.0 km2compared to 21 % for the Cariboo Mountains. Eliminating four of the five largest glaciers from our 33-glacier subset (glaciers 30–33; Table 3) would result in a size-class distribution that is nearly
10
identical to glaciers in the Cariboo Mountains.
Our glacier subset also oversamples higher elevations (Fig. 5). Area-altitude distribu-tion of glaciers in the Premier range, for example, are higher than the average elevadistribu-tion of glacier in the Cariboo Mountains whereas the hypsometry of our glacier subset from the Castle and Quanstrom areas are more similar to the total glacierized area of the
15
Cariboo Mountains.
Glaciers in our study also more commonly face north, northeast, and southwest (Fig. 6). Cariboo Mountains glaciers have an average slope of 21.1◦ whereas our sub-set has an average slope of 18.7◦ ; these differences, however, are not statistically significant.
20
3.2 Extent change
re-TCD
8, 3367–3411, 2014Glacier change in the Cariboo Mountains,
British Columbia, Canada (1952–2005)
M. J. Beedle et al.
Title Page
Abstract Introduction
Conclusions References
Tables Figures
◭ ◮
◭ ◮
Back Close
Full Screen / Esc
Printer-friendly Version
Interactive Discussion
Discussion
P
a
per
|
Discus
sion
P
a
per
|
Discussion
P
a
per
|
Discussion
P
a
per
|
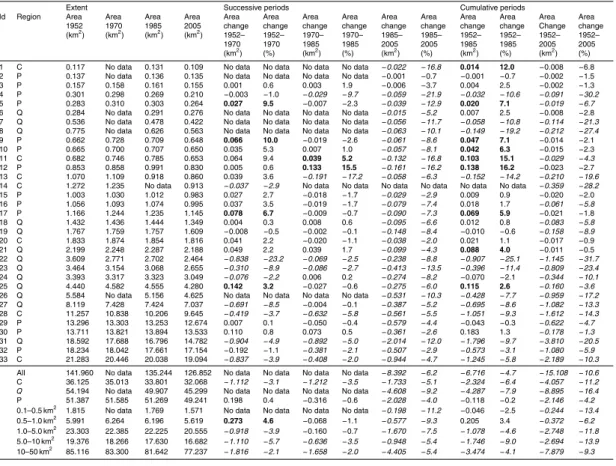
spectively. Absolute area change by size class over the same period varied from −6.2±3.3 % (0.5–1.0 km2) to−13.9±1.1 % (5.0–10 km2). Individual glacier area loss varied from−0.5±1.6 to−31.7±1.4 %. Recession for 22 of the 33 glaciers exceeded the uncertainties in the data. Absolute extent change is dominated by three of the largest glaciers (glaciers 28, 31, and 33), which comprise 50 % of the total subset
ex-5
tent change for the period.
While glaciers on average shrank during the period 1952–2005, their change during intervening epochs was more complex (Table 3 and Fig. 7). Over the period 1952– 1970, for example, five of 26 glaciers advanced, seven receded, and 14 did not signif-icantly change. Between the years 1970 and 1985, two of 26 glaciers advanced, eight
10
shrank, and the area of 16 glaciers did not change. For the cumulative period 1952– 1985 nine glaciers advanced, 12 receded, and 11 had no discernable extent change.
Glaciers that advanced were generally shorter, smaller, steeper, and had higher me-dian and minimum elevations than glaciers that receded (Table 4). Glaciers that negli-gibly changed tended to be steep, but were longer than those glaciers that advanced.
15
Glaciers that changed little were also higher and flowed over a greater elevation range than advancing ones. Receding glaciers all had northerly aspects, whereas those that advanced or did not change had no dominant aspect.
After 1985, all glaciers throughout the region shrank (Fig. 7). The av-erage rate of area change increased from −0.05±0.10 % a−1 from 1952–
20
1985, to −0.41±0.12 % a−1 from 1985–2005. Rates of area change aver-aged +0.03±0.18 % a−1 for 1952–1970, −0.08±0.13 % a−1 for 1970–1985, and −0.40±0.10 % a−1 from 1985–2005. During the period 1985–2005, 30 glaciers re-ceded, and the area of two glaciers did not change. Total surface area change of the period 1985–2005 was−8.39±1.51 km2, or−6.2±2.3 % (Table 3).
25
TCD
8, 3367–3411, 2014Glacier change in the Cariboo Mountains,
British Columbia, Canada (1952–2005)
M. J. Beedle et al.
Title Page
Abstract Introduction
Conclusions References
Tables Figures
◭ ◮
◭ ◮
Back Close
Full Screen / Esc
Printer-friendly Version
Interactive Discussion
Discussion
P
a
per
|
Discus
sion
P
a
per
|
Discussion
P
a
per
|
Discussion
P
a
per
|
824±39 km2. By 1970 glacier cover declined to 805±38 km2, and continued to shrink to 785±37 km2by 1985.
We directly compare glacier extent and extent change (1985–2005) for 28 glaciers common to the Bolch et al. (2010) inventory and this study (Fig. 8). The Bolch et al. in-ventory relies on glacier extents mapped by the British Columbia Government Terrain
5
Resource Inventory Management (TRIM) program from 1980s aerial photography and Landsat imagery from 2003–2007. The 2005 extents of this inventory, created through a semi-automated process, average 2 % larger than our extents manually digitized from aerial photographs with much higher resolution. However, the Bolch et al. (2010) inven-tory uses an area-weighted date (2005); the actual date of imagery covering the
Cari-10
boo Mountains is from 2006. Relative area change for the period 1985–2005 averaged ∼0.3 % a−1for this 28-glacier subset, and thus the Bolch et al. (2010) inventory, based on 2006 imagery, will not significantly differ from our measurements from 2005 aerial photos. This provides evidence of the quality of the 2005 inventory and the precision of the method used by Bolch et al. (2010). The 1985 TRIM extents, however, digitized
15
manually by the province of British Columbia from the same aerial photographs we use here, average 5 % larger than our extents. Late-lying snow is prevalent in the 1984 and 1985 photographs, but reference to additional photographs in years with a higher snowline helped us distinguish snowfields from glacierized area. The TRIM mapping included some late-lying snow as glacier, resulting in overestimation of 1985 extents
20
in the TRIM dataset. Errant mapping of late-lying snow thus led to 52 % more surface-area loss reported in the Bolch et al. (2010) inventory than we find for the 28 glaciers of this comparison.
Based on the extrapolation procedure described above, we estimate a net change of −53 km2(−6.8 %) for the period 1985–2005 compared to−114 km2(−13.5 %) of Bolch
25
TCD
8, 3367–3411, 2014Glacier change in the Cariboo Mountains,
British Columbia, Canada (1952–2005)
M. J. Beedle et al.
Title Page
Abstract Introduction
Conclusions References
Tables Figures
◭ ◮
◭ ◮
Back Close
Full Screen / Esc
Printer-friendly Version
Interactive Discussion
Discussion
P
a
per
|
Discus
sion
P
a
per
|
Discussion
P
a
per
|
Discussion
P
a
per
|
2010). Our results thus demonstrate that glacier loss during the period 1985–2005 was higher than during previous epochs, but that the absolute surface area lost in this period may have been overestimated in previous studies.
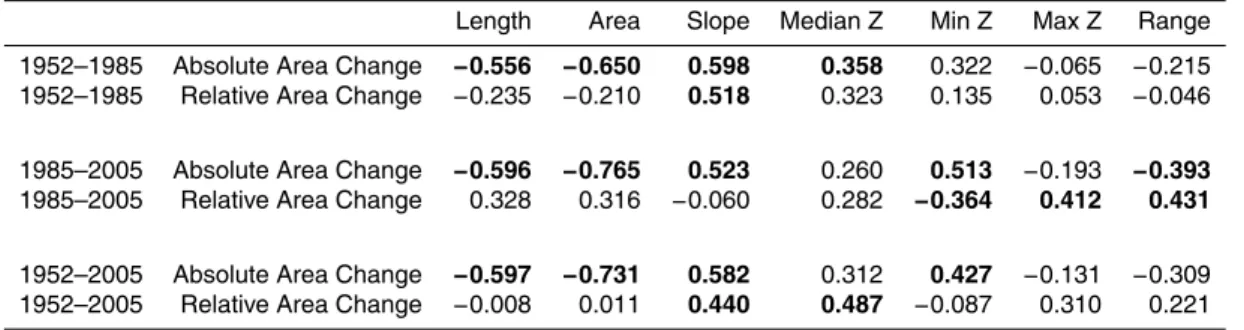
The relation between area change and glacier morphometry temporally varies (Ta-ble 5). For three periods – 1952–1985, 1985–2005, and 1952–2005 – absolute area
5
change correlates (p <0.05) negatively with glacier length and area, indicating that the larger glaciers in absolute terms lost more surface area in all periods. The relation be-tween relative area change and both length and area varies with time. For the period 1952–1985 we findr-values of−0.235 and−0.210 for length and area respectively, and these correlations for length and area change to 0.328 (p <0.10) and 0.316 (p <0.10)
10
for the period 1985–2005. Large glaciers thus lost more relative area in the earlier pe-riod, whereas small glaciers lost more relative area in the latter period. Average glacier surface slope is correlated with absolute and relative area change in all periods, ex-cept for relative area change from 1985–2005, indicating steeper glaciers generally lost less absolute and relative surface area, except during the latter period when there
15
was no correlation. Median glacier elevation is correlated with absolute area change for the period 1952–1985 (r =0.358, p <0.05) and relative area change for the pe-riod 1952–2005 (r=0.487,p <0.05) indicating that glaciers with more surface area at higher elevations experienced less area change in these two periods.
3.3 Volume change
20
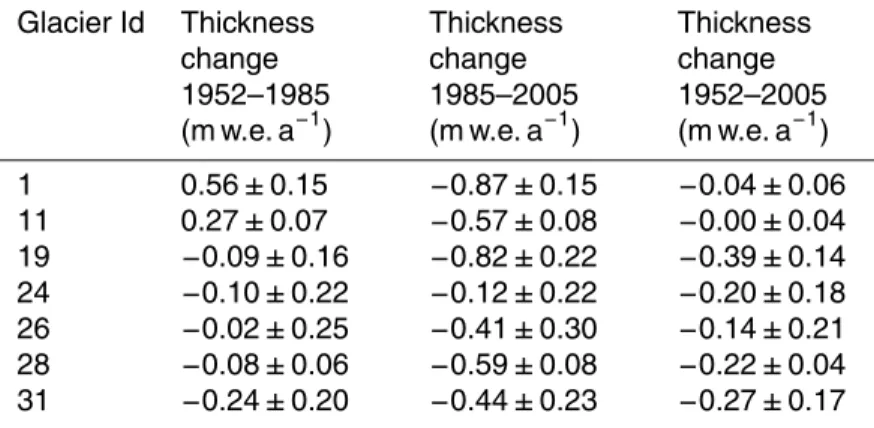
Over the period 1952–1985, the seven glaciers of our study lost
−0.480±0.051 km3w.e. Volume loss during the first period (1952–1985) totaled −0.195±0.059 km3w.e., and this loss accelerated to −0.345±0.048 km3w.e. during the later period (1985–2005). These volume losses correspond to respective thinning rates of−0.14±0.043 m w.e. a−1and−0.50±0.07 m w.e. a−1 (Table 6 and Fig. 9). Net
25
TCD
8, 3367–3411, 2014Glacier change in the Cariboo Mountains,
British Columbia, Canada (1952–2005)
M. J. Beedle et al.
Title Page
Abstract Introduction
Conclusions References
Tables Figures
◭ ◮
◭ ◮
Back Close
Full Screen / Esc
Printer-friendly Version
Interactive Discussion
Discussion
P
a
per
|
Discus
sion
P
a
per
|
Discussion
P
a
per
|
Discussion
P
a
per
|
1952–1985 (Table 6). Both of these glaciers thinned after 1985, but experienced little net change from 1952–2005. Five glaciers continuously thinned and receded.
Extrapolation of these thinning rates to unmeasured glaciers in the Cariboo Moun-tains yields volume losses of−4.027±2.044 and −7.580±1.167 km3w.e. for the pe-riods 1952–1985 and 1985–2005 respectively. We obtain lower estimates of volume
5
change (−2.312±2.170 and −6.242±1.315 km3w.e) using elevation-averaged sur-face elevation change measurements from these seven glaciers.
3.4 Relation to climate
Surface temperature increased during the period of study, particularly after 1985 (Fig. 10). From the earlier (1952–1985) to the latter epoch (1986–2005), average
tem-10
peratures increased by+0.38 and+0.87◦C for the ablation and accumulation season respectively.
Accumulation season and annual precipitation decreased during the period of study, but little change occurred during the ablation season (Fig. 11). From the earlier (1952– 1985) to the latter period (1986–2005), accumulation-season and annual precipitation
15
decreased by−32 mm (−3.2 %) and−44 mm (−3.0 %) respectively.
Geopotential height (700 hPa) anomalies, based on 1952–2005 mean fields, reveal an area of persistent low pressure in western Canada during the accumulation and ablation seasons for the periods 1952–1970 and 1971–1985 (Fig. 12). These low-pressure anomalies were centered over the Yukon Territory and northern BC from
20
1952–1970. These areas of low pressure weakened during the period 1971–1985 with a prominent trough along the Coast Mountains (ablation season) and diffuse area of anomalously low pressure over much of central North America (accumulation season). A marked change in circulation occurred for the later period with anomalously high pressure present during the period 1986–2005, with ridges over south central Alaska
25
TCD
8, 3367–3411, 2014Glacier change in the Cariboo Mountains,
British Columbia, Canada (1952–2005)
M. J. Beedle et al.
Title Page
Abstract Introduction
Conclusions References
Tables Figures
◭ ◮
◭ ◮
Back Close
Full Screen / Esc
Printer-friendly Version
Interactive Discussion
Discussion
P
a
per
|
Discus
sion
P
a
per
|
Discussion
P
a
per
|
Discussion
P
a
per
|
These synoptic conditions broadly accord with the Pacific Decadal Oscillation (PDO; Mantua et al., 1997), a pattern of Pacific climate variability that persists for multiple decades and plays a prominent role in determining glacier mass balance in northwest North America (e.g., Bitz and Battisti, 1999). The earlier two periods (1950–1970 and 1971–1985) were largely coincident with a cool phase of the PDO from 1947 to 1976.
5
In contrast, the latest period (1985–2005) coincided with a warm phase of the PDO from 1977 to at least the mid-1990s.
4 Discussion
4.1 Regional representativeness
Our glacier subset represents a compromise between regional representativeness and
10
the availability of suitable aerial photography. We oversampled large glaciers as they will contribute most to volume change for a given region. While glaciers of the 1–5 km2 size class dominated volume change in the Cariboo Mountains for the period 1985– 2005, losses from large glaciers (>5 km2) were even more important for previous epochs. The two largest glaciers for which we calculated volume change, for
exam-15
ple, accounted for 94 % of the total volume change for seven glaciers from 1952–1985, and 75 % from 1985–2005. Selection of a representative subset of glaciers for a region is difficult, especially when glacier change is assessed over multiple epochs.
Most studies of glacier change note increased scatter of percent area change for smaller glaciers (Serandbrei-Barbero et al., 1999; Kääb et al., 2001; Paul, 2002; Paul
20
et al., 2004; DeBeer and Sharp, 2007; Andreassen et al., 2008; Bolch et al., 2010; Paul and Andreassen, 2009). This scatter may arise from the influence of local topographic factors (DeBeer and Sharp, 2007; Paul and Andreassen, 2009). Kääb et al. (2001) concluded that this scatter could also be the result of using low-resolution satellite imagery, or from the fast response times of small glaciers. Late-lying seasonal snow
25
TCD
8, 3367–3411, 2014Glacier change in the Cariboo Mountains,
British Columbia, Canada (1952–2005)
M. J. Beedle et al.
Title Page
Abstract Introduction
Conclusions References
Tables Figures
◭ ◮
◭ ◮
Back Close
Full Screen / Esc
Printer-friendly Version
Interactive Discussion
Discussion
P
a
per
|
Discus
sion
P
a
per
|
Discussion
P
a
per
|
Discussion
P
a
per
|
a role in the observation of increased scatter for smaller glaciers. To assess this factor we compared the standard deviation in relative area change of the smallest glaciers as measured for 28 glaciers in both Bolch et al. (2010) and in our study, which based on our analysis is less affected by late-lying seasonal snow cover. The standard deviation of relative area change from 1985–2005 for the Bolch et al. (2010) inventory is 8.1 %
5
for the smallest glaciers (<1.0 km2), whereas in our study it is 5.8 %. This difference is significant (F test,p <0.05); it supports our hypothesis that late-lying seasonal snow plays a role in observations of increased scatter for smaller glaciers, and that the TRIM mapping of 1985 glacier extents errantly mapped seasonal snow cover as glacierized area.
10
4.2 Area change
Our results indicate net recession of Cariboo Mountains glaciers from 1952–2005, con-sistent with other studies of glacier change in BC (DeBeer and Sharp, 2007; Brewis, 2012; Tennant et al., 2012; Tennant and Menounos, 2013). While net glacier change of our 33-glacier subset over this period is negative (−15.11±1.89 km2or−10.6±2.9 %),
15
recession for 11 of these glaciers was not significant. Nine of these 11 glaciers ad-vanced during the period 1952–1985.
Our finding of glacier advance in the period 1952–1985 accords with the advance in the Premier Range described by Luckman et al. (1987) and with glacier expansion elsewhere in BC during this period (Koch et al., 2009; Menounos et al., 2009; Brewis,
20
2012; Tennant and Menounos, 2013). Studies that only determine net recession over a multi-decadal period (e.g., DeBeer and Sharp, 2007, 2009; Jiskoot et al., 2009) may not capture minor advances like those of the present study.
During the period 1985–2005, glaciers shrank eight times faster than the period 1952–1985, and five times faster than 1970–1985 (Fig. 7). Annual recession of Castle
25
TCD
8, 3367–3411, 2014Glacier change in the Cariboo Mountains,
British Columbia, Canada (1952–2005)
M. J. Beedle et al.
Title Page
Abstract Introduction
Conclusions References
Tables Figures
◭ ◮
◭ ◮
Back Close
Full Screen / Esc
Printer-friendly Version
Interactive Discussion
Discussion
P
a
per
|
Discus
sion
P
a
per
|
Discussion
P
a
per
|
Discussion
P
a
per
|
(2013) also found increased recession rates for glaciers of the Columbia Icefield of BC and Alberta, which increased after 1979 and again after 2000.
4.3 Thickness change
Observed thinning rates during the period 1952–2005 averaged
−0.23±0.12 m w.e. a−1, resulting in a net loss of −0.48±0.05 km3w.e. (Table 6).
5
This rate of thinning is considerably less then long-term thinning rates for glaciers of the Columbia Icefield (−0.6±0.3 m w.e. a−1; Tennant and Menounos, 2013) and Alaskan glaciers (−0.48±0.10 m w.e. a−1; Berthier et al., 2010). However, our average thinning rate is similar to those reported for nine North America glaciers for the period from the mid-1950s to the mid-1990s, which range from+0.01 to −0.61 and average
10
−0.21 m w.e. a−1(Sapiano et al., 1998).
From 1952–1985 thinning rates averaged −0.14±0.16 m w.e. a−1 and glaciers lost −0.20±0.06 km3w.e. The two smallest glaciers of our study thickened and advanced over the same period. Brewis (2012) also found that four of six glaciers in the Canoe River Basin (Fig. 1) thickened and advanced during the period 1955–1970.
15
The post-1985 accelerated thinning of Cariboo Mountain glaciers agrees with other studies of glacier change in northwest North America (e.g., Rasmussen and Conway, 2004; Brewis, 2012; Tennant and Menounos, 2013). Schiefer et al. (2007) found that over the period 1985–1999, glaciers of the Cariboo Mountains thinned by a rate of −0.58 m w.e. a−1 and lost −7.06 km3w.e. Using our two different methods of
extrap-20
olation described in Sect. 3.3, our estimates yield comparable estimates of ice loss (−6.24±1.32 km3and−7.58±1.17 km3) for the Cariboo Mountains.
Unlike the period 1985–2005, our methods of extrapolation to Cariboo Mountains glaciers yield significantly different volume change estimates for the period 1952– 1985 (−4.03±2.04 km3vs.−2.31±2.17 km3). This discrepancy could arise from
time-25
TCD
8, 3367–3411, 2014Glacier change in the Cariboo Mountains,
British Columbia, Canada (1952–2005)
M. J. Beedle et al.
Title Page
Abstract Introduction
Conclusions References
Tables Figures
◭ ◮
◭ ◮
Back Close
Full Screen / Esc
Printer-friendly Version
Interactive Discussion
Discussion
P
a
per
|
Discus
sion
P
a
per
|
Discussion
P
a
per
|
Discussion
P
a
per
|
change from a subset of glaciers, but with a more robust sample size to better con-strain regional variability of surface-elevation change.
4.4 Relations of extent change to glacier morphometry
Glacier surface area is the single morphometric parameter that commonly correlates with extent change (Serandbrei-Barbero et al., 1999; Hoelzle et al., 2003; Paul et al.,
5
2004; Andreassen et al., 2008; Bolch et al., 2010; Paul and Andreassen, 2009). From 1985–2005, we find average relative area change of −11.2, −9.3, −7.5, −5.4, and −5.4 % for our five size classes, arranged from smallest to largest (Table 3). Surface area and relative area change during the period 1985–2005 are weakly correlated (p <0.1) indicating generally more relative area change for smaller glaciers (Table 5).
10
However, from 1952–1985, a period with reduced rates of recession or advance, this does not apply; average relative area change was−2.5,+3.4,−4.6,−9.0, and−4.1 % for the same size classes, and the r value (not significant) is negative. It appears that the magnitude of glacier change is not simply related to dimensional attributes of a given glacier; they apparently vary with differing climatic regimes.
15
Studies have typically found no significant correlation among other morphometric parameters and area change (Paul, 2002; Granshaw and Fountain, 2006; Andreassen et al., 2008; Bolch et al., 2010; DeBeer and Sharp, 2009; and Paul and Andreassen, 2009). Other parameters include slope, aspect, and median, minimum, and maximum elevation. We, however, find correlation between slope and absolute area in all periods.
20
Slope correlates with relative area change from 1952–1985, and on a net basis from 1952–2005, but not for the latter period 1985–2005 (Table 5). This relation, indicating that the steeper glaciers lost less absolute and relative surface area, may be spurious, however, as slope is highly correlated with glacier surface area and length (e.g., Hoelzle et al., 2003).
25
TCD
8, 3367–3411, 2014Glacier change in the Cariboo Mountains,
British Columbia, Canada (1952–2005)
M. J. Beedle et al.
Title Page
Abstract Introduction
Conclusions References
Tables Figures
◭ ◮
◭ ◮
Back Close
Full Screen / Esc
Printer-friendly Version
Interactive Discussion
Discussion
P
a
per
|
Discus
sion
P
a
per
|
Discussion
P
a
per
|
Discussion
P
a
per
|
whether the temporal changes we observed in this study are present for other moun-tain ranges, and how time-variable glacier dynamics might obscure relations between extent change and glacier geometry.
4.5 Relations to climate
Mean annual and seasonal temperatures increased from 1952–2005, particularly after
5
1985, whereas wintertime precipitation slightly decreased (Figs. 9 and 10). It is likely that observed glacier loss resulted from increased (decreased) temperatures (precipi-tation), a finding in agreement with previous studies for glaciers in the Cariboo Moun-tains (Luckman et al., 1987; Brewis, 2012). Previous studies implicate rising surface temperatures as the recent cause for accelerated mass loss of North American glaciers
10
in maritime environments (Rasmussen and Conway, 2004; Arendt et al., 2009). Ten-nant and Menounos (2013) also observed the role of decreased precipitation for the Columbia Icefield of the Canadian Rocky Mountains.
There was little temperature change, or decreased temperatures from 1952–1970 to 1971–1986, but following 1985, temperatures increased in the Cariboo Mountains
15
(Fig. 10). After 1985, increased annual temperature occurred in both the accumulation and ablation seasons, but change during the accumulation season is double that of the ablation season.
Precipitation consistently decreased over the three periods of analysis for the ac-cumulation season and annually (Fig. 11). Decreased annual precipitation is primarily
20
an accumulation season phenomenon, whereas average ablation season precipita-tion negligibly changed. Cool accumulaprecipita-tion season temperatures from 1971–1985 may have counteracted decreased precipitation, leading to snow accumulation comparable to that of the period 1952–1970. Some, but not all, glaciers thickened and advanced between 1952–1985, a result of both individual glacier hypsometry leading to more
25
TCD
8, 3367–3411, 2014Glacier change in the Cariboo Mountains,
British Columbia, Canada (1952–2005)
M. J. Beedle et al.
Title Page
Abstract Introduction
Conclusions References
Tables Figures
◭ ◮
◭ ◮
Back Close
Full Screen / Esc
Printer-friendly Version
Interactive Discussion
Discussion
P
a
per
|
Discus
sion
P
a
per
|
Discussion
P
a
per
|
Discussion
P
a
per
|
ClimateWNA records indicate that wetter and cooler periods align with anomalous low-pressure (1952–1970 and 1971–1985), and drier and warmer periods align with anomalous high-pressure (1985–2005) (Fig. 12). Previous studies note high-pressure anomalies over northwest North America after the late-1970s with coincident glacier recession and thinning (e.g., Bitz and Battisti, 1999; Hodge et al., 1998; Rasmussen
5
and Conway, 2004). Our findings for glaciers of the Cariboo Mountains agree with this earlier work and expand the spatial domain of these climate anomalies and how they influenced glacier change during the mid-20th to early-21st centuries.
Glaciers of the Cariboo Mountains will continue to strongly recede for the remain-der of the 21st century. Projections suggest annual warming of 1.8◦C to 2.7◦C above
10
the 1971–2000 mean by the 2050s for the Columbia Basin of BC, an area that in-cludes a portion of the Premier Range (Murdock et al., 2013). Assuming a lapse rate of 0.006◦C m−1, such warming would result in a rise in the ELA of 300 to 450 m. Given current glacier hypsometry (Fig. 5), an assumed steady-state accumulation-area ratio (AAR) of 60 % indicates a present steady-state ELA for Cariboo Mountains glaciers of
15
approximately 2375 m. A rise in the ELA of from 300 to 450 m would reduce the AAR from 60 % to between 12 and 5 %, leaving glaciers of the Cariboo Mountains grossly out of balance and greatly diminished by the mid-21st century. Such a decline is con-sistent with the finding for the eastern slopes of the Rocky Mountains that predicts glaciers will lose 80–90 % of their volume by 2100 (Marshall et al., 2011).
20
Previous studies suggest that glaciologists need to further examine intra- and inter-regional mass balance variability (Braithwaite, 2002), and conclude that there are no means of making an a priori selection of a regionally-representative benchmark glacier (Fountain et al., 2009). The paucity of traditional mass-balance and glacier length change measurements limits assessments of regional representativeness. Widespread
25
TCD
8, 3367–3411, 2014Glacier change in the Cariboo Mountains,
British Columbia, Canada (1952–2005)
M. J. Beedle et al.
Title Page
Abstract Introduction
Conclusions References
Tables Figures
◭ ◮
◭ ◮
Back Close
Full Screen / Esc
Printer-friendly Version
Interactive Discussion
Discussion
P
a
per
|
Discus
sion
P
a
per
|
Discussion
P
a
per
|
Discussion
P
a
per
|
a priori selection of a representative subset of glaciers. Regional representativeness will be variable with respect to glacier morphometry, climate and glacier response, how-ever. Selection of benchmark glaciers and representative glacier subsets, as well as testing of the regional representativeness of existing benchmark glaciers (e.g., Foun-tain et al., 2009) should be based on regional glacier morphometry, recent decadal
5
glacier extent and thickness change, and with respect to varying glacier response in different climatic regimes.
5 Conclusions
During the period 1952–2005, glaciers of the Cariboo Mountains receded at a rate of 0.19±0.05 % a−1. Slow glacier recession rates characterized the epoch 1952–
10
1985 (−0.05±0.10 % a−1), and some glaciers advanced. After 1985, glacier reces-sion rates increased eightfold (0.41±0.12 % a−1). Thinning rates also accelerated from −0.143±0.043 m w.e. a−1(1952–1985) to−0.500±0.070 m w.e. a−1from 1985–2005. Temperatures increased from 1952–2005, primarily after 1985, whereas accumulation season precipitation decreased over the period of study, indicating that both increases
15
in temperature and decreases in precipitation explain the observed pattern of glacier change.
The inventory of Bolch et al. (2010) possibly overestimated the recession of Cariboo Mountains glaciers from 1985–2005. For 28 common glaciers, our extents average 2 % smaller than the 2005 extents generated with the semi-automated method of Bolch
20
et al. (2010) and 5 % smaller than the 1985 extents of the TRIM dataset, likely due to mapping of late-lying seasonal snow as glacierized area in the TRIM dataset.
Our results indicate that relations between glacier change and dimensional attributes of the glaciers of this study are not stable through time; this non-stationarity may be related to ice dynamics and the complex way glaciers respond to changes in surface
25
TCD
8, 3367–3411, 2014Glacier change in the Cariboo Mountains,
British Columbia, Canada (1952–2005)
M. J. Beedle et al.
Title Page
Abstract Introduction
Conclusions References
Tables Figures
◭ ◮
◭ ◮
Back Close
Full Screen / Esc
Printer-friendly Version
Interactive Discussion
Discussion
P
a
per
|
Discus
sion
P
a
per
|
Discussion
P
a
per
|
Discussion
P
a
per
|
Acknowledgements. We acknowledge research funding provided through the Western
Cana-dian Cryospheric Network (from the CanaCana-dian Foundation for Climate and Atmospheric Sci-ences), Natural Sciences and Engineering Research Council of Canada (NSERC), Pacific In-stitute for Climate Solutions (Graduate Fellowship to M. Beedle), and University of Northern British Columbia (Graduate Scholarship to M. Beedle). We also thank the Province of British 5
Columbia and Natural Resources Canada for access to aerial photography, Caillin Smith and Tyler Sylvestre for photogrammetric scanning, and Cardinal Systems for providing Vr Mapping software licenses and support. Stephen Déry, Peter Jackson and Andrew Fountain provided comments that significantly improved our analysis and manuscript.
References
10
Abermann, J., Lambrecht, A., Fischer, A., and Kuhn, M.: Quantifying changes and trends in glacier area and volume in the Austrian Ötztal Alps (1969-1997-2006), The Cryosphere, 3, 205–215, doi:10.5194/tc-3-205-2009, 2009.
Andreassen, L. M., Paul, F., Kääb, A., and Hausberg, J. E.: Landsat-derived glacier inventory for Jotunheimen, Norway, and deduced glacier changes since the 1930s, The Cryosphere, 15
2, 131–145, doi:10.5194/tc-2-131-2008, 2008.
Arendt, A. A., Echelmeyer, K. A., Harrison, W. D., Lingle, C. S., and Valentine, V. B.: Rapid wastage of Alaska glaciers and their contribution to rising sea level, Science, 297, 382–385, 2002.
Arendt, A., Echelmeyer, K., Harrison, W., Lingle, C., Zirnheld, S., Valentine, V., Ritchie, B., and 20
Druckenmiller, M.: Updated estimates of glacier volume changes in the western Chugach Mountains, Alaska, and a comparison of regional extrapolation methods, J. Geophys. Res., 111, F03019, doi:10.1029/2005JF000436, 2006.
Arendt, A., Walsh, J., and Harrison, W.: Changes of glaciers and climate in northwestern North America during the late 20th century, J. Climate, 22, 4117–4134, 2009.
25
Bahr, D. B. and Radić, V.: Significant contribution to total mass from very small glaciers, The
Cryosphere, 6, 763–770, doi:10.5194/tc-6-763-2012, 2012.
Barrand, N. E., Murray, T., James, T. D., Barr, S. L., and Mills, J. P.: Optimizing photogrammetric DEMs for glacier volume change assessment using laser-scanning derived ground-control points, J. Glaciol., 55, 106–116, 2009.
TCD
8, 3367–3411, 2014Glacier change in the Cariboo Mountains,
British Columbia, Canada (1952–2005)
M. J. Beedle et al.
Title Page
Abstract Introduction
Conclusions References
Tables Figures
◭ ◮
◭ ◮
Back Close
Full Screen / Esc
Printer-friendly Version
Interactive Discussion
Discussion
P
a
per
|
Discus
sion
P
a
per
|
Discussion
P
a
per
|
Discussion
P
a
per
|
Barrand, N. E., James, T. D., and Murray, T.: Spatio-temporal variability in elevation changes of two high-Arctic valley glaciers, J. Glaciol., 56, 771–780, 2010.
Beedle, M. J., Menounos, B., Luckman, B. H., and Wheate, R.: Annual push moraines as cli-mate proxy, Geophys. Res. Lett., 36, L20501, doi:10.1029/2009GL039533, 2009.
Beedle, M. J., Menounos, B., and Wheate, R.: An evaluation of mass balance techniques ap-5
plied to Castle Creek Glacier, British Columbia, Canada, J. Glaciol., 60, 262–276, 2014. Berthier, E., Schiefer, E., Clarke, G. K. C., Menounos, B., and Rémy, F.: Contribution of
Alaskan glaciers to sea-level rise derived from satellite imagery, Nat. Geosci., 3, 92–95, doi:10.1038/NGEO737, 2010.
Bitz, C. M. and Battisti, D. S.: Interannual to decadal variability in climate and the glacier mass 10
balance in Washington, western Canada, and Alaska, J. Climate, 12, 3181–3196, 1999. Bogdal, C., Schmid, P., Zennegg, M., Anselmetti, F. S., Scheringer, M., and Hunberbühler, K.:
Blast from the past: melting glaciers as a relevant source for persistent organic pollutants, Environ. Sci. Technol., 43, 21, 8173–8177, 2009
Bolch, T., Menounos, B., and Wheate, R.: Landsat-based inventory of glaciers in western 15
Canada, 1985–2005, Remote Sens. Environ., 114, 127–137, 2010.
Braithwaite, R. J.: Glacier mass balance: the first 50 years of international monitoring, Prog. Phys. Geog., 26, 76–95, 2002.
Brewis, T. B.: Glacier change and contribution to streamflow in the Canoe Basin, British Columbia, 1948–2005, Master’s thesis, University of Northern British Columbia, Prince 20
George, 2012.
British Columbia (BC) Ministry of Environment: Specifications for Aerial Triangulation. Surveys and Source Mapping, Province of British Columbia, Victoria, BC, 1998.
Daly, C., Gibson, W. P., Taylor, G. H., Johnson, G. L., and Pasteris, P.: A knowledge-based approach to the statistical mapping of climate, Climate Res., 22, 99–113, 2002.
25
DeBeer, C. M. and Sharp, M. J.: Recent changes in glacier area and volume within the southern Canadian Cordillera, Ann. Glaciol., 46, 215–221, 2007.
DeBeer, C. M. and Sharp, M. J.: Topographic influences on recent changes of very small glaciers in the Monashee Mountains, British Columbia, Canada, J. Glaciol., 55, 1–10, 2009. Déry, S. J., Clifton, A., MacLeod, S. and Beedle, M. J.: Blowing snow fluxes in the Cari-30
TCD
8, 3367–3411, 2014Glacier change in the Cariboo Mountains,
British Columbia, Canada (1952–2005)
M. J. Beedle et al.
Title Page
Abstract Introduction
Conclusions References
Tables Figures
◭ ◮
◭ ◮
Back Close
Full Screen / Esc
Printer-friendly Version
Interactive Discussion
Discussion
P
a
per
|
Discus
sion
P
a
per
|
Discussion
P
a
per
|
Discussion
P
a
per
|
Environment Canada: 1981–2010 Climate Normals and Averages, Meteorological Service of Canada, Environment Canada, Ottawa, available at: http://climate.weather.gc.ca/climate_ normals/ (last access: 10 January 2013), 2012.
Fountain, A. G., Hoffman, M. J., Granshaw, F., and Riedel, J.: The ‘benchmark glacier’ concept
– does it work? Lessons from the North Cascade Range, USA, Ann. Glaciol., 50, 163–168, 5
2009.
Gardner, A. S., Moholdt, G., Wouters, B., Wolken, G. J., Burgess, D. O., Sharp, M. J., Cog-ley, J. G., Braun, C., and Labine, C.: Sharply increased mass loss from glaciers and ice caps in the Canadian Arctic Archipelago, Nature, 473, 357–360, doi:10.1038/nature10089, 2011. Granshaw, F. D. and Fountain, A. G.: Glacier change (1958–1998) in the North Cascades Na-10
tional Park Complex, Washington, USA, J. Glaciol., 52, 251–256, 2006.
Hodge, S. M., Trabant, D. C., Krimmel, R. M., Heinrichs, T. A., March, R. S., and Jos-berger, E. G.: Climate variations and changes in mass of three glaciers in western North America, J. Climate, 11, 2161–2179, 1998.
Hoelzle, M., Haeberli, W., Dischl, M., and Peschke, W.: Secular glacier mass balances derived 15
from cumulative glacier length changes, Global Planet. Change, 36, 295–306, 2003.
Hood, E., Fellman, J., Spencer, R. G. M., Hernes, P. J., Edwards, R., D’Amore, D., and Scott, D.: Glaciers as a source of ancient and labile organic matter to the marine environment, Nature, 462, 1044–1048, doi:10.1038/nature08580, 2009.
Jiskoot, H., Curran, C. J., Tessler, D. L., and Shenton, L. R.: Changes in Clemenceau Icefield 20
and Chaba Group glaciers, Canada, related to hypsometry, tributary detachment, length-slope and area-aspect relations, Ann. Glaciol., 50, 133–143, 2009.
Kääb, A. and Vollmer, M.: Surface geometry, thickness changes and flow fields on creeping mountain permafrost: automatic extraction by digital image analysis, Permafrost Periglac., 11, 315–326, 2000.
25
Kääb, A., Paul, F., Maisch, M., Hoelzle, M., and Haeberli, W.: The new remote sensing derived Swiss glacier inventory: II. First results, Ann. Glaciol., 34, 362–366, 2001.
Kalnay, E. M., Kanamitsu, R., Kistler, W., Collins, W., Deaven, D., Gandin, L., Iredell, M., Saha, S., White, G., Woollen, J., Zhu, Y., Chelliah, M., Ebisuzaki, W., Higgins, W., Janowiak, J., Mo, K. C., Ropelewski, C., Wang, J., Leetmaa, A., Jenne, R., and Joseph, D.: 30
The NCEP/NCAR 40-year reanalysis project, B. Am. Meteorol. Soc., 77, 3, 437–471, 1996. Koblet, T., Gärtner-Roer, I., Zemp, M., Jansson, P., Thee, P., Haeberli, W., and Holmlund, P.:
Deter-TCD
8, 3367–3411, 2014Glacier change in the Cariboo Mountains,
British Columbia, Canada (1952–2005)
M. J. Beedle et al.
Title Page
Abstract Introduction
Conclusions References
Tables Figures
◭ ◮
◭ ◮
Back Close
Full Screen / Esc
Printer-friendly Version
Interactive Discussion
Discussion
P
a
per
|
Discus
sion
P
a
per
|
Discussion
P
a
per
|
Discussion
P
a
per
|
mination of length, area, and volume changes, The Cryosphere, 4, 333–343, doi:10.5194/tc-4-333-2010, 2010.
Koch, J., Menounos, B., and Clague, J. J.: Glacier change in Garibaldi Provincial Park, southern Coast Mountains, British Columbia, since the Little Ice Age, Global Planet. Change, 66, 161– 178, 2009.
5
Luckman, B. H., Harding, K. A., and Hamilton, J. P.: Recent glacier advances in the Premier Range, British Columbia, Can. J. Earth Sci., 24, 1149–1161, 1987.
Mantua, N. J., Hare, S. R., Zhang, Y., Wallace, J. M. and Francis, R. C.: A Pacific interdecadal climate oscillation with impacts on salmon production, B. Am. Meteorol. Soc., 78, 1069–1079, 1997.
10
Marshall, S. J., White, E. C., Demuth, M. N., Bolch, T., Wheate, R., Menounos, B., Beedle, M. J., and Shea, J. M.: Glacier water resources on the eastern slopes of the Canadian Rocky Mountains, Can. Water Resour. J., 36, 109–134, 2011.
Maurer, M. K., Menounos, B., Luckman, B. H., Osborn, G., Clague, J. J., Beedle, M. J., Smith, R., and Atkinson, N.: Late Holocene glacier expansion in the Cariboo and northern 15
Rocky Mountains, British Columbia, Canada, Quaternary Sci. Rev., 51, 71–80, 2012. Menounos, B., Osborn, G., Clague, J., and Luckman, B.: Latest Pleistocene and Holocene
glacier fluctuations in western Canada, Quaternary Sci. Rev., 28, 2049–2074, 2009.
Mitchell, T. D. and Jones, P. D.: An improved method of constructing a database of monthly climate observations and associated high-resolution grids, Int. J. Climatol., 25, 693–712, 20
2005.
Moore, R. D., Fleming, S. W., Menounos, B., Wheate, R., Fountain, A., Stahl, K., Holm, K., and Jakob, M.: Glacier change in western North America: influences on hydrology, geomorphic hazards and water quality, Hydrol. Process., 24, 42–61, 2009.
Murdock, T. Q., Sobie, S. R., Zwiers, F. W., and Eckstrand, H. D.: Climate change 25
and extremes in the Canadian Columbia Basin, Atmos. Ocean, 51, 456–469, doi:10.1080/07055900.2013.816932, 2013.
Paul, F.: Changes in glacier area in Tyrol, Austria, between 1969 and 1992 derived from Landsat 5 Thematic Mapper and Austrian Glacier Inventory data, Int. J. Remote Sensing, 23, 787– 799, 2002.
30
TCD
8, 3367–3411, 2014Glacier change in the Cariboo Mountains,
British Columbia, Canada (1952–2005)
M. J. Beedle et al.
Title Page
Abstract Introduction
Conclusions References
Tables Figures
◭ ◮
◭ ◮
Back Close
Full Screen / Esc
Printer-friendly Version
Interactive Discussion
Discussion
P
a
per
|
Discus
sion
P
a
per
|
Discussion
P
a
per
|
Discussion
P
a
per
|
Paul, F. and Haeberli, W.: Spatial variability of glacier elevation changes in the Swiss Alps obtained from two digital elevation models, Geophys. Res. Lett., 35, L21502, doi:10.1029/2008GL034718, 2008.
Paul, F., Kääb, A., Maisch, M., Kellenberger, T., and Haeberli, W.: Rapid disintegra-tion of Alpine glaciers observed with satellite data, Geophys. Res. Lett., 31, L21402, 5
doi:10.1029/2004GL020816, 2004.
Radić, V. and Hock, R.: Regionally differentiated contribution of mountain glaciers and ice caps
to future sea-level rise, Nat. Geosci., 4, 91–94, doi:10.1038/NGEO1052, 2011.
Rasmussen, L. A. and Conway, H.: Climate and glacier variability in western North America, J. Climate, 17, 1804–1815, 2004.
10
Rolstad, C., Haug, T., and Denby, B.: Spatially integrated geodetic glacier mass balance and its uncertainty based on geostatistical analysis: application to the western Svartisen ice cap, J. Glaciol., 55, 666–680, 2009.
Sapiano, J. J., Harrison, W. D., and Echelmeyer, K. A.: Elevation, volume and terminus changes in nine glaciers in North America, J. Glaciol., 44, 119–135, 1998.
15
Schiefer, E. and Gilbert, R.: Reconstructing morphometric change in a proglacial landscape using historical aerial photography and automated DEM generation, Geomorphology, 88, 167–178, 2007.
Schiefer, E., Menounos, B., and Wheate, R.: Recent volume loss of British Columbia glaciers, Canada, Geophys. Res. Lett., 34, L16503, doi:10.1029/2007GL030780, 2007.
20
Schiefer, E., Menounos, B., and Wheate, R.: An inventory and morphometric analysis of British Columbia glaciers, Canada, J. Glaciol., 54, 551–560, 2008.
Serandbrei-Barbero, R., Rabagliati, R., Binaghi, E., and Rampini, A.: Glacial retreat in the 1980s in the Breonie, Aurine and Pusteresi groups (eastern Alps, Italy) in Landsat TM im-ages, Hydrolog. Sci. J., 44, 279–296, 1999.
25
Tennant, C. and Menounos, B.: Glacier change of the Columbia Icefield, Canadian Rocky Mountains, 1919–2009, J. Glaciol., 59, 671–686, doi:10.3189/2013JoG12J135, 2013. Tennant, C., Menounos, B., Wheate, R., and Clague, J. J.: Area change of glaciers in the
Canadian Rocky Mountains, 1919 to 2006, The Cryosphere, 6, 1541–1552, doi:10.5194/tc-6-1541-2012, 2012.
30