HESSD
9, 65–91, 2012Tree ring-based reconstruction in the
Jiaolai River since 1826
L. Ma et al.
Title Page
Abstract Introduction
Conclusions References
Tables Figures
◭ ◮
◭ ◮
Back Close
Full Screen / Esc
Printer-friendly Version Interactive Discussion
Discussion
P
a
per
|
Dis
cussion
P
a
per
|
Discussion
P
a
per
|
Discussio
n
P
a
per
Hydrol. Earth Syst. Sci. Discuss., 9, 65–91, 2012 www.hydrol-earth-syst-sci-discuss.net/9/65/2012/ doi:10.5194/hessd-9-65-2012
© Author(s) 2012. CC Attribution 3.0 License.
Hydrology and Earth System Sciences Discussions
This discussion paper is/has been under review for the journal Hydrology and Earth System Sciences (HESS). Please refer to the corresponding final paper in HESS if available.
Tree ring-based reconstruction of October
to November runo
ff
s in the Jiaolai River
since 1826
L. Ma1, T. X. Liu1, Q. Wu2, L. H. Ji1, and R. Z. Gao1
1
Water Conservancy and Civil Engineering College of Inner Mongolia Agricultural University, Hohhot, Inner Mongolia, 010018, China
2
Land Surveying and Planning Institute of Inner Mongolia, Hohhot, Inner Mongolia, 010010, China
Received: 9 December 2011 – Accepted: 13 December 2011 – Published: 3 January 2012
Correspondence to: L. Ma ([email protected])
HESSD
9, 65–91, 2012Tree ring-based reconstruction in the
Jiaolai River since 1826
L. Ma et al.
Title Page
Abstract Introduction
Conclusions References
Tables Figures
◭ ◮
◭ ◮
Back Close
Full Screen / Esc
Printer-friendly Version Interactive Discussion
Discussion
P
a
per
|
Dis
cussion
P
a
per
|
Discussion
P
a
per
|
Discussio
n
P
a
per
|
Abstract
The Horqin Sandy Land is a typical desertification region in China hounded by eco-logical and environmental problems, which continue to affect economic and social de-velopment.Hence,hydrological climate changes in this region need to be investigated. The current study reconstructed the runoff sequences in the southwest edge of the
5
LiaoHe River into the XiaWa station of the JiaoLai River during the months of October to November from 1826 to 2005. A comprehensive timeline for the regional tree wheel width of the Horqin Sandy Land was employed. The timeline has been in use for 183 yr. For the past 180 yr, the runoffhas experienced six and four consecutive Feng and dry sections, respectively. From 1982 to 2005, the runoffreached the longest section of a
10
continuous low-flow runoff, with the mean average runoffamounting to only 63.58 % of the entire period. Runoffhas 3-, 11-, 15-, 24-, and 30-yr quasi-periodic variations, con-sistent with changes in similar areas worldwide. The period of 1826 to 1917 presents a more gentle change. In 1956, the runoffincreased, and then significantly decreased for nearly 50 yr. The drop rate is 1.7766 million m3/10 yr, which shows a consistent
down-15
ward trend with the precipitation (14.74 mm/10 yr). The overall reduction in precipitation accounts for 29.86 % of the initial value, which is far less than 75.58 % of the runoff. If the runoff and precipitation drop continue, more extensive and longer ecological and environmental problems are foreseen to occur.
1 Introduction
20
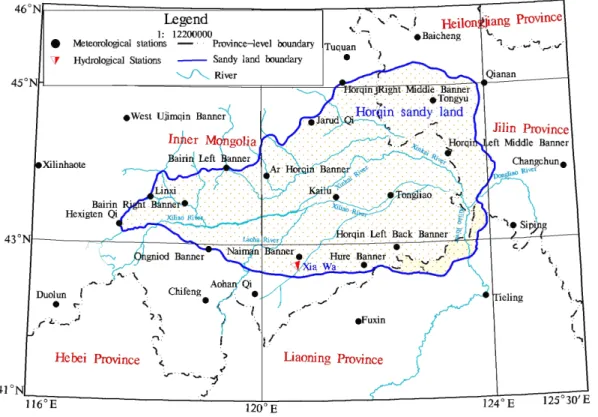
China is one of several countries experiencing severe desertification. The rapid pro-gression of dry land degradation has become an important ecological and socio-economic problem (Wang et al., 2002; Wang and Zhu, 2001). The Horqin Sandy Land is located between east longitude 117◦45′to 124◦06′and north latitude 42◦36′to 45◦20′
(Fig. 1). It belongs to the alluvial plain of the Liaohe River. In ancient times, the Horqin
25
HESSD
9, 65–91, 2012Tree ring-based reconstruction in the
Jiaolai River since 1826
L. Ma et al.
Title Page
Abstract Introduction
Conclusions References
Tables Figures
◭ ◮
◭ ◮
Back Close
Full Screen / Esc
Printer-friendly Version Interactive Discussion
Discussion
P
a
per
|
Dis
cussion
P
a
per
|
Discussion
P
a
per
|
Discussio
n
P
a
per
has become a typical Chinese desertification area, one of China’s four sandy lands. Related research on the environmental changes in this area has begun in the 1950s, producing some substantive results (Wang and Zhu, 2001; Dong et al., 1998; Wang et al., 2004a, 2006; Li et al., 2007; Zhao et al., 2008) on the desertification process, evo-lution, structure, and drive mechanism. The results suggest that climate fluctuations
5
could directly affect to some extent the process of desertification via through the diff er-ent periods of precipitation and temperature combinations (Wang et al., 2004b; Zhao et al., 2008). The desertification is mainly subjected to millennial- and centennial-scale climate fluctuations (Dong et al., 1998). Hence, a long-time-scale research on hydro-logical climate changes is particularly important.
10
Runoffand precipitation are closely related. The amount of runoff not only directly affects river ecology, but also has a profound impact on changes in river environments. Consequently, future trends in the ecological environment and past runoffvariations need to be explored.
A number of studies have been conducted on runoffs in the Liaohe River. This river
15
is located in the Horqin Sandy Land (Zhang et al., 2007; Hao et al., 2008; Yang et al., 2009; Fang et al., 2009; Jiang et al., 2009; Wang et al., 2011; Zhang and He, 2011; Gu et al., 2011), and the study period covers the years 1950s to 2008. The research in-volved the Liaohe River, the Liaohe tributaries, and other tributaries of the Laoha River. Zhang et al. (2007) have shown that the measured runoff in the Liaohe Laoha River
20
has significantly decreased since 1950. Fang et al. (2009) have revealed that from the 1960s to the early 21st century, the variations in annual runoff and the annual runoff
coefficient of the Laoha River were more-less-less-more-less. The decadal variation is much greater than the annual rainfall, and Wang et al. (2011) have pointed out that the measured runoffin Liaohe Tieling showed a significant reduction trend since the
25
mid-1960s.
HESSD
9, 65–91, 2012Tree ring-based reconstruction in the
Jiaolai River since 1826
L. Ma et al.
Title Page
Abstract Introduction
Conclusions References
Tables Figures
◭ ◮
◭ ◮
Back Close
Full Screen / Esc
Printer-friendly Version Interactive Discussion
Discussion
P
a
per
|
Dis
cussion
P
a
per
|
Discussion
P
a
per
|
Discussio
n
P
a
per
|
revealed by tree-ring records is an effective means to address this limitation. Tree ring-based reconstructions present information that feature accurate positioning, good con-tinuity, high resolution, and precise correlation with hydrological climate change (Fritts, 1976; Shao, 1997a; Nicoletta, 2004). Such reconstructions are applied in research on hydro-climatic events abroad, such as runoff, drought, flood, rainfall, temperature,
5
glaciation, and volcanic activity (Stockton and Meko, 1975; Hughes et al., 1978; Cook and Jacoby, 1983; Briffa et al., 1995; Van et al., 1998; Clevel, 2000; Magda et al., 2001; Meko et al., 2001; Woodhouse, 2001; Esper et al., 2003; Law et al., 2006; Michael et al., 2006; Joseph et al., 2006; Sophie et al., 2007; Giovanna et al., 2010; Samuli et al., 2010).
10
In China, to study the chronology established, the tree ring and hydrological climate relationship, as well as the reconstruction, the study objects of Sabina, spruce, pine, white stick, larch, and elm in cold and dry regions were selected. Such regions in-cluded the Qinghai-Tibet Plateau, Qaidam Basin, Xinjiang, Qilian Mountain, Changbai Mountain, Qinling, and Inner Mongolia. The research has made great progress (Wu et
15
al., 1989; Shao et al., 1997b, c; Gou et al., 2006; Ma and Liu, 2007; Zhu et al., 2008; Eryuan et al., 2008; Liu et al., 2004, 2009a, 2010; Li et al., 2010; Ma et al., 2011). Part of the runoffis reconstructed in the Urumqi mountain basin, Black River, Tongtianhe, Huangshui, and Yellow River (Li et al., 1997; Kang et al., 2002, 2008; Qin et al., 2004; Wang et al., 2004; Liu et al., 1997b, 2007; Sun et al., 2011). The long sequence of
20
changes in runoffcharacteristics are analyzed.
Regardless of short time changes in runoffcharacteristics and the reconstruction of a long sequence, studies on the JiaoLai River are relatively limited. In the current paper, the 183-yr Horqin sandy area elm tree ring width chronologies established by Ma et al. (2011) in a station in the JiaoLai River tributary during the months of October to
25
HESSD
9, 65–91, 2012Tree ring-based reconstruction in the
Jiaolai River since 1826
L. Ma et al.
Title Page
Abstract Introduction
Conclusions References
Tables Figures
◭ ◮
◭ ◮
Back Close
Full Screen / Esc
Printer-friendly Version Interactive Discussion
Discussion
P
a
per
|
Dis
cussion
P
a
per
|
Discussion
P
a
per
|
Discussio
n
P
a
per
2 Data used
2.1 Chronological data
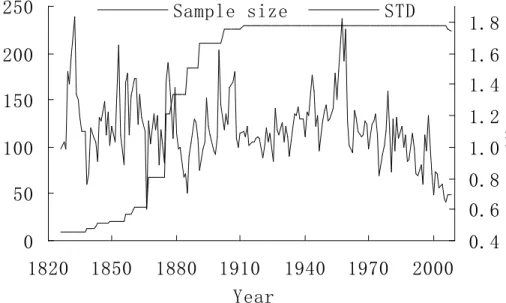
The ring width chronology and reconstruction of elm in the Sandy Land were used (Ma and Liu, 2011). The ring width chronology for 1826 to 2008 (183 yr) is shown in Fig. 2 (Ma and Liu, 2011).
5
2.2 Hydrological and meteorological data
The precipitation data selected were in accordance with the chronology of the estab-lishment of meteorological stations. The 1951 to 2010 monthly (year) precipitation data were obtained from the eight meteorological stations closest to the sites. These sta-tions were the Horqin Left Back Banner, TongLiao, Kailu, Horqin Left Middle Banner,
10
Jarud Qi, Horqin Right Middle Banner, and Horqin Left Right Banner. Data from me-teorological administration-integrated materials were also obtained. The uniformity of every meteorological element indicated that precipitation data from the sites did not exhibit significant deviations as well as random changes, and that data changes were relatively homogenous and consistent. Hence, the data were considered as reliable
15
representations of the climate conditions in the region. Data from adjacent sites were used to interpolate measurements because some of the stations had incomplete infor-mation. The average data of the eight stations were used for area face value.
According to the same basin and proximity principle, the monthly (yearly) runoffdata from 1957 to 2010 of the Xiawa station in the JiaoLai River were collected. This station
20
is located at the edge of the Horqin Sandy Land and the import point to the sand of the JiaoLai River. There is less human activity upstream, so the measured runoffdata was closer to the natural values.
The ground precipitation in the Horqin Sandy Land is basically the same with the precipitation in the upstream watershed area. By combining all factors, the selected
HESSD
9, 65–91, 2012Tree ring-based reconstruction in the
Jiaolai River since 1826
L. Ma et al.
Title Page
Abstract Introduction
Conclusions References
Tables Figures
◭ ◮
◭ ◮
Back Close
Full Screen / Esc
Printer-friendly Version Interactive Discussion
Discussion
P
a
per
|
Dis
cussion
P
a
per
|
Discussion
P
a
per
|
Discussio
n
P
a
per
|
3 Related analysis and explanation
3.1 Correlation of chronology and runoff
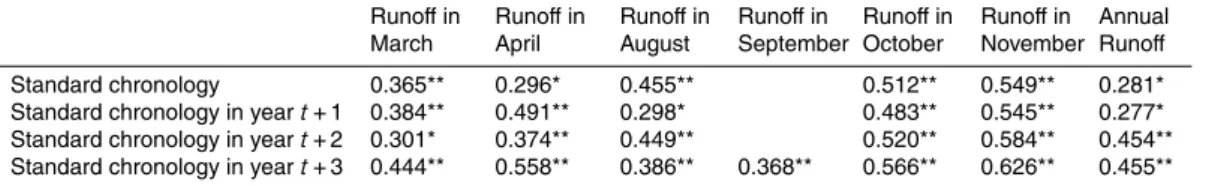
Tree ring climatology considers that rings formed in the yeart are influenced not only by the climate at that time, but also by the climate of the previous 1 to 2 yr (Fritts, 1976). Therefore, the standard chronological sequence and standard chronological
5
t+1, t+2, and t+3 sequences in relation to the runoffin low-lying stations, as well as the correlation coefficients are shown in Table 1. The standard chronology had a significant relationship with the runoffin March, April, August, September, October, and November, as well as the annual runoff. The correlation in October and November was the highest.
10
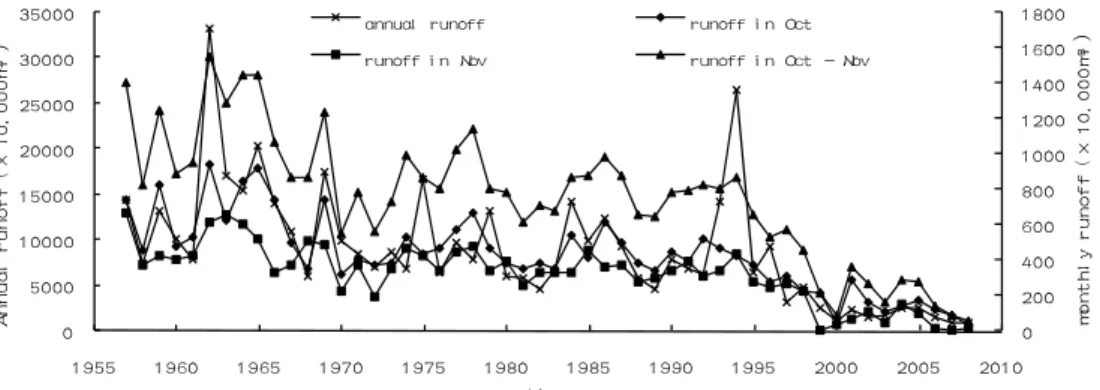
The results of the correlation analysis between the annual and monthly runoffs show that the runoffin July accounted for 30.19 % of the annual runoff, and had the maximum correlation coefficient of 0.814. Although the runoff in October and November were responsible for only 4.82 % and 3.63 % of the annual runoff, the annual runoffcoefficient ranked only second to July; the coefficients were 0.755 and 0.699, respectively, ranking
15
second and third. Based on the contrast curve among the annual runoff, runoff in October, runoff in November, and runoff in October to November (Fig. 3), the four curves were concluded to have basically the same trend. Therefore, using a rebuilding chronology for the October–November runoffto analyze wet and dry season changes, cycle changes, which can represent the changes in annual runoff to some degree,
20
HESSD
9, 65–91, 2012Tree ring-based reconstruction in the
Jiaolai River since 1826
L. Ma et al.
Title Page
Abstract Introduction
Conclusions References
Tables Figures
◭ ◮
◭ ◮
Back Close
Full Screen / Esc
Printer-friendly Version Interactive Discussion
Discussion
P
a
per
|
Dis
cussion
P
a
per
|
Discussion
P
a
per
|
Discussio
n
P
a
per
3.2 Physiological mechanism explanation on the relationship between trees and runoff
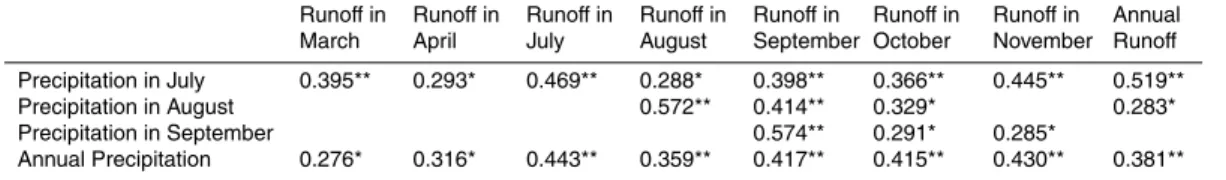
The main supply source of runoffformation is precipitation. In different seasons and at different times, the groundwater comes from direct precipitation or snowmelt, and then supplies the runoff. According to the correlation between the precipitation
se-5
quence in the Horqin Sand Land and the runoffseries in the XiaWa station (Table 2), the precipitation in July, August, and September, as well as the annual precipitation significantly correlated with the March to April, July to November, and annual runoffs. Among them, the precipitation in July had a significant correlation with the March to April, July to November, and annual runoffs, respectively. The runoffin July accounted
10
for 30.19 % of the annual runoff, whereas precipitation in July was 32.18 % of the total annual precipitation, which was the largest contribution to the runoff. Rainfall in Au-gust was significantly related to the AuAu-gust to October runoff, and the August runoff
accounted for 24 % of the annual runoff. On the other hand, the precipitation in Au-gust accounted for 21.46 % of the annual precipitation, and ranks second in terms of
15
runoffcontribution. The precipitation in September had a significant correlation with the September to November runoff, and the runoffin September was 7.51 % of the annual runoff. In contrast, precipitation in September accounted for 8.84 % in the total annual precipitation. Annual precipitation was significantly related to the March to April, July to November, and annual runoffs. When precipitation transforms, some of it directly forms
20
surface runoff, and some permeates the ground to supply surface runoffin the under-ground runoffform. Based on a combination of the above relationship, the formation of precipitation runoffcan be concluded to have some lag. Therefore, the precipitation in July, August, as well as September, was greater, and accounted for a significant proportion in the annual precipitation. The precipitation not only plays an important
25
HESSD
9, 65–91, 2012Tree ring-based reconstruction in the
Jiaolai River since 1826
L. Ma et al.
Title Page
Abstract Introduction
Conclusions References
Tables Figures
◭ ◮
◭ ◮
Back Close
Full Screen / Esc
Printer-friendly Version Interactive Discussion
Discussion
P
a
per
|
Dis
cussion
P
a
per
|
Discussion
P
a
per
|
Discussio
n
P
a
per
|
Precipitation also plays an important role in the growth of trees, especially the precip-itation in July, August, and Sep, which were significantly correlated with the chronology (Ma et al., 2011). Summer was the peak of elm growth. At that time, elm growth de-pended most on water. Good water conditions during this period effectively and rapidly promoted elm growth. This phenomenon was the same in September
5
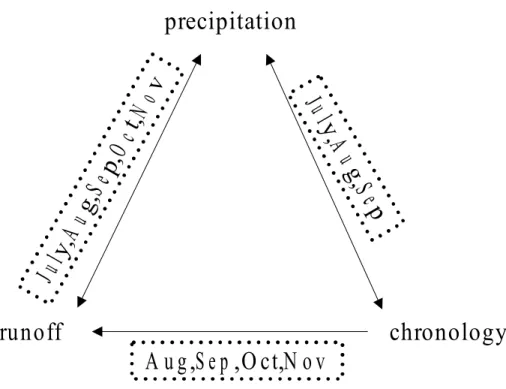
Considering the comprehensive situations in Tables 1 and 2, Fig. 4 shows that pre-cipitation played a major role in runoffformation and tree growth. In July, August, and September, the precipitation not only played an important role on tree growth, but also on runoffformation. Changes in the runoffalso represented changes in precipitation. Considering the lag effect, the precipitation in July, August, and September had a
sig-10
nificant impact on the runoffin October to November This phenomenon explained the good relationship between the chronology and the August to November runoff. The good relationship among the chronology sequences in yearst+1,t+2, andt+3 with the runoffalso fully illustrated the delayed runoffresponse.
4 Reconstruction runoff
15
From the above response relationship, the standard sequence and standard chronol-ogy in yearst+1,t+2, andt+3 were used to reconstruct runoffin the XiaWa station of the JiaoLai River from October to November since 1826 to 2005. The following equation was adopted:
Rt=−800.79+438.43×It+98.01×It+1+231.54×It+2+818.15×It+3
20
N=49,r=0.74,R2=0.54,R2
adj=0.51,F(4,44)=13.05,P <0.001
(1)
where Rt is the runoff from October to November in year t, It denotes the index of standard tree ring chronology in yeart (dimensionless), It+1 is the index of standard tree ring chronology in year t+1 (dimensionless), It+2 is the index of standard tree ring chronology in yeart+2 (dimensionless), andIt+3is the index of standard tree ring
25
HESSD
9, 65–91, 2012Tree ring-based reconstruction in the
Jiaolai River since 1826
L. Ma et al.
Title Page
Abstract Introduction
Conclusions References
Tables Figures
◭ ◮
◭ ◮
Back Close
Full Screen / Esc
Printer-friendly Version Interactive Discussion
Discussion
P
a
per
|
Dis
cussion
P
a
per
|
Discussion
P
a
per
|
Discussio
n
P
a
per
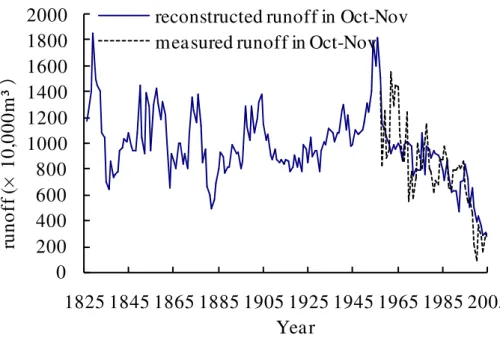
Compared with the reconstructed sequence exhibiting the same trend as the cor-responding sequence of the measured value (shown in Fig. 5), some extreme values cannot be completely consistent with the reconstructed values. In other words, part of the tree ring reconstruction results underestimates extreme hydrology and climate events (Fritts, 1976). However, the reconstruction equation yielded good results for
5
the reconstruction of the average minimum winter temperature. The reconstructed and measured values demonstrated good synchronization.
Additional tests on the stability and reliability of the reconstruction equation are nec-essary to ensure the credibility of the reconstruction value when a value generated beyond the calibration period is used. According to common international practice,
10
the reduction error RE, S1 (sign test), S2 (first difference symbols for the test), and t (average test value for the product) were calculated. An RE of 0.54, which was obvi-ously greater than 0.3, was obtained. When RE is higher than 0.3, the reconstruction value is considered credible (Li et al., 2000). The values of the sign test results and first-difference symbols for the test results were 33/49 and 31/48, respectively. These
15
were significant at the 0.05 level, indicating that the reconstructed and measured value sequences were in good agreement with the changes in high-low frequencies. The average test value for the product was 2.91, which was significant at the 0.01 level, indicating a significant difference between the identical and opposing serial number sequences. All parameters indicated that the reconstruction equation was stable and
20
reliable. The reconstruction results for the runoffderived from this equation were also credible.
Consequently, the runoffseries for the XiaWa Station of the JiaoLai River in October to November from 1826 to 2006 was rebuilt according to the reconstruction equation. The reconstruction sequence is shown in Fig. 5.
HESSD
9, 65–91, 2012Tree ring-based reconstruction in the
Jiaolai River since 1826
L. Ma et al.
Title Page
Abstract Introduction
Conclusions References
Tables Figures
◭ ◮
◭ ◮
Back Close
Full Screen / Esc
Printer-friendly Version Interactive Discussion
Discussion
P
a
per
|
Dis
cussion
P
a
per
|
Discussion
P
a
per
|
Discussio
n
P
a
per
|
5 Characteristics of runoff
5.1 Changes in wet and dry seasons
According to the reconstructed runoffseries, the average runoffin the XiaWa station of the JiaoLai River in October to November from 1826 to 2006 was 9.7238 million m3, with the maximum being 18.5171 million m3(occurred in the year 1829). The minimum
5
was 2.8576 million m3(occurred in the year 2005). The extreme value was 6.48, which illustrated that the runoffin the JiaoLai River had greater amplitudes between years.
Reconstructing the sequence in mean runoffchanges can reflect wet and dry season changes between years. The mean changes are shown in Table 3. These data showed the wet periods were more obvious in the 1820s, 1850s, 1900s, and 1950s during the
10
era of scale changes, whereas dry periods were remarkable in the 1880s, 1910s, and 1970s–2000s.
For further quantitative analysis of the reconstructed sequences in wet and dry sea-son changes, the coefficient ratioKp, which is the ratio of the runoffto the mean runoff
for many years, was calculated. The following definitions were made for different Kp
15
values: more than 1.16, special wet years; between 1.06 and 1.16, partial wet years; between 0.95 and 1.06, flat water years; between 0.84 and 0.95, partial dry years; and less than 0.84, special dry years. The reconstruction sequence is shown in Fig. 6. This sequence indicated that the years of reconstructed sequences in special wet, partial wet, flat water, partial dry, and special dry years were 40, 23, 40, 30, and 47,
account-20
ing for 22.22 %, 12.78 %, 22.22 %, 16.67 %, and 26.11 % of the total number of years. The proportions of special wet, flat water, and special dry years were large, with the largest being that of special dry years. This result revealed that the runoffin the JiaoLai River had a negative contribution to the reconstruction period.
According to the principle of at least 5 continuous years, special and partial wet years
25
HESSD
9, 65–91, 2012Tree ring-based reconstruction in the
Jiaolai River since 1826
L. Ma et al.
Title Page
Abstract Introduction
Conclusions References
Tables Figures
◭ ◮
◭ ◮
Back Close
Full Screen / Esc
Printer-friendly Version Interactive Discussion
Discussion
P
a
per
|
Dis
cussion
P
a
per
|
Discussion
P
a
per
|
Discussio
n
P
a
per
1905, 1938 to 1943, and 1946 to 1960. The durations ranged from 6 to 15 yr, and the total was 51 yr. Of these 51 yr, 24 occurred in the 19th century, and the remaining 27 occurred in the 20th century (mainly in the 1960s). The longest wet period occurred from 1946 to 1960, a total of 15 yr, with the mean annual runoffat 12.9962 million m3, which was 1.33 times the average runoff for the entire reconstruction period. There
5
were four periods of continuous dry years, namely, 1835 to 1840, 1880 to 1885, 1912 to 1922, and 1982 to 2005. The durations ranged from 6 to 24 yr, and the total was 47 yr. Of these 47 yr, only 12 occurred in the 19th century, and the remaining 30 oc-curred in the 20th century (mainly in the 1980s to the late 20th century). The five years in the early 21st century were continuous dry years (from 1982 to 2005). The
10
continued dry time reached 24 yr, and the mean annual runoffwas 6.1823 million m3, which was only 63.58 % of the average runofffor the entire reconstruction period. The continuous dry periods occurred not only in the 1980s, but also from the early 1960s to 2005. The overall runofftrend was decreasing. During the 1950s to 2000s, the runoff decreased from 14.1031 million m3to 3.4435 million m3, with drop rate of 1.7766
mil-15
lion m3/10 yr. The runoffsignificantly declined, which fully illustrated that the runoffin the JiaoLai River had been gradually decreasing for nearly 50 yr, thereby forming the longest continuous dry season during the reconstruction period.
5.2 Periodic changes
An analysis of the runoff reconstruction with the power spectrum revealed that the
20
HESSD
9, 65–91, 2012Tree ring-based reconstruction in the
Jiaolai River since 1826
L. Ma et al.
Title Page
Abstract Introduction
Conclusions References
Tables Figures
◭ ◮
◭ ◮
Back Close
Full Screen / Esc
Printer-friendly Version Interactive Discussion
Discussion
P
a
per
|
Dis
cussion
P
a
per
|
Discussion
P
a
per
|
Discussio
n
P
a
per
|
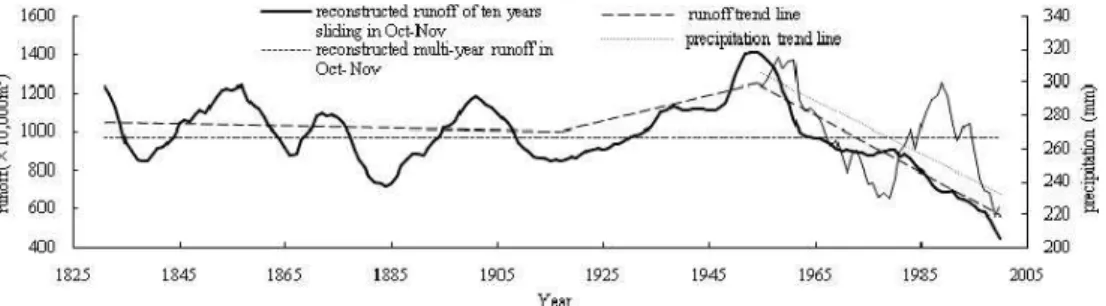
5.3 Variation trends
The runoffsequence was reconstructed for a 10-yr moving average, as shown in Fig. 7. As can be seen from the trend line, the runoffchange was gentler from 1826 to 1917 (92 yr) in the JiaoLai River during the 180 yr. Subsequently, the runoff increased in 1956, and then for nearly 50 yr, significant decreased. This finding was consistent with
5
the aforementioned wet and dry seasonal changes.
6 Discussion and conclusion
The present study used a comprehensive timeline for the regional tree wheel width of the Horqin Sandy Land to reconstruct the runoffsequences in the XiaWa station of the JiaoLai River during the months of October to November from 1826 to 2005. The
re-10
constructed sequence exhibited the same trend as the corresponding sequence of the measured value. The calculated results of various tests showed that the reconstruction result was stable and reliable.
There were greater amplitudes in runoffs in the JiaoLai River between years. The reconstruction sequence had six continuous wet period years, a total of 51 yr, including
15
27 yr that occurred in the early 20th century to the early 1960s. The multi-year average runoffin the wet period from 1946 to 1960 was 1.33 times the entire reconstruction period mean annual runoff. The runoffalso went through four continuous dry periods, a total of 47 yr, which had 30 yr occurring in the 1980s to the late 20th century. The multi-year average runoff from 1982 to 2005 was only 63.58 % of the entire reconstruction
20
period. Overall, the runoffgradually decreased for nearly 50 yr, from the early 1960s to the present, and the drop rate in runoffwas 1.7766 million years m3/10 yr. This result indicated that the runoffsignificantly decreased, and the total reduction was 75.58 %of the initial value.
Runoffin the JiaoLai River had 3-, 11-, 15-, 24-, and 30-yr quasi-periodic variations.
25
HESSD
9, 65–91, 2012Tree ring-based reconstruction in the
Jiaolai River since 1826
L. Ma et al.
Title Page
Abstract Introduction
Conclusions References
Tables Figures
◭ ◮
◭ ◮
Back Close
Full Screen / Esc
Printer-friendly Version Interactive Discussion
Discussion
P
a
per
|
Dis
cussion
P
a
per
|
Discussion
P
a
per
|
Discussio
n
P
a
per
30-yr cycles were also consistent with the precipitation cycle. This result fully explained that the runoffchange in the JiaoLai River followed certain rules, with varying degrees of change similar with other areas around the globe.
Overall, during the nearly 180 yr in the JiaoLai River, the change in runoffwas gentler from 1917 to 1826. Then, in 1956, the runoffgradually decreased. In nearly 50 yr, the
5
runoffhad a significant decreasing trend. A comparison with the ten year sliding curve of precipitation in the Horqin Sandy measured in July to November (Fig. 7) revealed that the precipitation decreased for nearly 50 yr, i.e. from 296.10 mm to 207.67 mm in the 1950s to 2000s, with the decreased rate of 14.74 mm/10 yr. The overall decrease accounted for 29.86 % of the initial value, which is a significant amount. In contrast,
10
the proportional decrease in precipitation accounted for the initial value being much smaller than the proportion of runoff reduction, accounting for about half. In other words, a slight decrease in precipitation may lead to a significant reduction in runoff. Zhang et al. (2007) have drawn relatively similar conclusion. They propose that in the past 50 yr, the relationship between runoffand precipitation had an overall downward
15
trend. The results of the present study provide further references on runoffchanges in the Liaohe River, as well as possible strategies for ecological environmental protection and catchment economy progress.
Acknowledgements. This research was supported by National natural science funds projects (Grant No: 50869005) , Inner Mongolia natural science fund projects(Grant No: 2010BS0608) 20
and Inner Mongolia Agricultural University of “cold-dry water resources utilization” innovation team to plan funding.
References
Battipaglia, G., Frank, D., B ¨untger, U., Dobrovoln´y, P., Br ´azil, R., Pfister, C., and Esper, J.: Five centuries of Central European temperature extremes reconstructed from tree-ring density 25
HESSD
9, 65–91, 2012Tree ring-based reconstruction in the
Jiaolai River since 1826
L. Ma et al.
Title Page
Abstract Introduction
Conclusions References
Tables Figures
◭ ◮
◭ ◮
Back Close
Full Screen / Esc
Printer-friendly Version Interactive Discussion
Discussion
P
a
per
|
Dis
cussion
P
a
per
|
Discussion
P
a
per
|
Discussio
n
P
a
per
|
twentiet h-century summer warmt hin a 1000-year temperature record f rom Siberia, Nature., 376, 156–159, 1995.
Clevel, M. K.: A 963-year reconstruction of summer (JJA) stre-amflow in theWhite River, Arkansas, USA, from tree-rings, The Holocene, 10, 33–41, 2000.
Cook, E. R. and Jacoby, G. C.: Potomac River stream flow since 1730 as reconstruction tree 5
rings, J. Clim. Appl. Meteorol., 22, 1659–1672, 1983.
Dong, G. R., Jin, H. L., and Chen, H. Z.: Geneses of desertification in semiarid and subhumid regions of northern China, Quaternary Sci., 2, 136–144, 1998.
Eryuan, L., Shao, X. M., and Qin, N. S.: Tree-ring based summer temperature reconstruction for the source region of the Yangtze River on the Tibetan Plateau, Global Planet. Change., 10
61, 313–320, 2008.
Esper, J., Cook, E. D., and Schweingruber, F. H.: Test of the RCS met hod for preserving low-frequency variability in long tree-ring chronologies, Tree-Ring Res., 59, 81–98, 2003. Fang, X. Q., Ren, L. L., and Li, Q. F.: Variations of hydrological elements in Laohahe River
Basin, Journal of Hohai University (Natural Sciences), 37, 620–624, 2009. 15
Fritts, H. C.: Tree ring and climate,London: Academic Press., 6–8, 1976.
Gou, X. H., Yang, M. X., Peng, J. F., and Li, Q. F.: Maximun temperature reconstruction for Animaqing mountain over past 830 yeara based on tree-ring records, Quaternary Sci., 26, 991–998, 2006.
Gu, Y., Wang, X. L., and Lin, J.: Analysis on change and trend of dry season runofffor major 20
rivers in china since past 60 years, Water Resources and Hydropower Engineering, 4, 131– 137, 011.
Hao, L., Wang, J. A., Gao, L., and Shao, X. M.: On the runoffin Laohahe river basin in the last 40 years, Journal of Beijing Normal University(Natural Science), 44, 629–633, 2008. Helama, S., Sepp ¨a, H., Birks, H. J. B., and Bjune, A. E.: Reconciling pollen-stratigraphical and 25
tree-ring evidence for high- and low-frequency temperature variability in the past millennium, Quaternary Sci. Rev., 29, 3905–3918, 2010.
Hughes, M. K., Leggett, P., Gray, B., Chen, H. Z., and Qin, N. S.: Climatic signals in Briti Isles tree-ring chronologies, Nature, 72, 605–606, 1978.
Jiang, S. H., Ren, L. L., Yong, B., Yang, M. X., and Ren, L. L.: The effects of climate variabil-30
ity and human activities on runoff from the Laohahe River Basin in Northern China, Water Resources Protection, 26, 1–15, 2010.
HESSD
9, 65–91, 2012Tree ring-based reconstruction in the
Jiaolai River since 1826
L. Ma et al.
Title Page
Abstract Introduction
Conclusions References
Tables Figures
◭ ◮
◭ ◮
Back Close
Full Screen / Esc
Printer-friendly Version Interactive Discussion
Discussion
P
a
per
|
Dis
cussion
P
a
per
|
Discussion
P
a
per
|
Discussio
n
P
a
per
in recent 523 years at Huayuankou station in Yellow River, Journal of Water Resources and Water Engineering., 19, 10–13, 2008.
Kang, X. C., Chen, G. D., Kang, E. S., Shao, X. M., and Qin, N. S.: Reconstruction the export runoffin the Black River using tree rings in nearly thansoud years, Science in China, Ser. D., 32, 675–685, 2002.
5
Law, B. E., Turner, D., Lefsky, M., Yang, M. X., and Peng, J. F.: Carbon fluxes across regions: Ob-servational constraints at multiple scales, in: Scaling and Uncertainty Analysis in Ecol-ogy: Methods and Appli-cations, edited by: Wu, J., Jones, B., and Li, H., and Yong, B., New York: Columbia University Press, 167–190, 2006.
Li, A. M., Han, Z. W., Huang, C. H., and Chen, G. D.: Remote sensing monitoring on dynamic of 10
sandy desertification degree in Horqin Sandy Land at the beginning of 21st century, Journal of Desert Research, 27, 546–551, 2006.
Li, J. F., Yuan, Y. J., You, X. R., and Huang, C. H.: A-360 years′ runoffreconstruction in the
RMQI river basin using tree rings, China Quaternary Sciences, 2, 131–137, 1997.
Li, J. F., Yuan, Y. J., You, X. R., and Huang, C. H.: The research and application in tree-ring 15
hydrology, Beijing, Science, 4, 106–107, 2000.
Li, Q., Feng, Q., and Zhai, L. X.: Study of the height growth dynamic based on tree-ring data in Populus euphratica from the lower reach of the Heihe River, China, Dendrochronologia, 28, 49–64, 2010.
Liu, P. X., Chen, F. H., Jin, L. Y., and Zhai, L. X.: About 100-year reconstruction of spring 20
streamflow based on tree rings in the lower reaches of Heihe River, Arid Land Geography, 30, 696–700, 2007.
Liu, X. H., Qin, D. H., Shao, X. M., Yuan, Y. J., and You, X. R.: Temperature changes in the middle Qilian Mountain over the last millennium using tree-rings record, Science in China, Ser. D., 34, 89–95, 2004.
25
Liu, Y., Tian, H., Song, H. M., and Jin, L. Y.: Tree ring based reconstruction of the May-June mean temperature since A.D.1884, in WeiChang, HeBei province, China Quaternary Sci-ences., 29, 896–904, 2009a.
Liu, Y., Yang, Y. K., Cai, Q. F., and Song, H. M.: Tree ring based reconstruction of the June-July runoffin HuangShui since past 248 years, Journal of Arid Land Resources and Environment, 30
20, 69–73, 2009b.
HESSD
9, 65–91, 2012Tree ring-based reconstruction in the
Jiaolai River since 1826
L. Ma et al.
Title Page
Abstract Introduction
Conclusions References
Tables Figures
◭ ◮
◭ ◮
Back Close
Full Screen / Esc
Printer-friendly Version Interactive Discussion
Discussion
P
a
per
|
Dis
cussion
P
a
per
|
Discussion
P
a
per
|
Discussio
n
P
a
per
|
Loso, M. G., Anderson, R. S., Anderson, S. P., and Reimer, P. J.: A 1500-year record of tem-perature and glacial response inferred from varved Iceberg Lake, southcentral Alaska, Qua-ternary Res., 66, 12–24, 2006.
Ma, L. and Liu, T. X.: Relationship of Elm growth and hydrometeorological factors of Horqin Sandy Land and climatic series reconstruction, Journal of Glaciology and Geocryology, 29, 5
802–807, 2009.
Ma, L., Liu, T. X., Jin, H. L., and Song, H. M.: Reconstruction in elm tree-ring width chronologies and precipitation in Horqin sandySince 1826, China Quaternary Sciences, 31, 360–369, 2011.
Magda, V. N., Zelenova, A. V., and Andreev, S. G.: A 280-year reconstruction of Baikal Lake 10
water level from treerings, Confercnce “Tree Rings and Peopl”, 22–26, 2001.
Martinelli, N.: Climate from dendrochronology: Latest developments and results, Global Planet Change., 40, 129–139 ,2004.
McAuliffe, J. R., Scuderi, L. A., and McFadden, L. D.: Tree-ring record of hillslope erosion and valley floor dynamics:Landscape responses to climate variation during the last 400yr in the 15
Colorado Plateau, northeastern Arizona, Global Planet. Change, 50, 184–201, 2006. Meko, D. M., Therrell, M. D., Baisan, C. H., and Hughes, M. K.: Sacramento River flow
recon-structed to A.D. 869 from tree rings, J. Am. Water Resour. As., 37, 1029–1040, 2001. Qin, N. S., Jin, L. Y., Shi, X. H., and Jin, H. L.: A 518-year runoff reconstruction of Tongtian
river basin using tree-ring width chronologies, Acta Geogr. Sinica, 59, 550–556, 2004. 20
Rickebusch, S., Lischke, H., Bugmann, H., Guisan, A., and Zimmermann, N. E.: Understand-ing the low-temperature limitations to forest growth through calibration of a forest dynamics model with tree-ring data, Forest Ecol. Manage., 246, 251–263, 1997.
Shao, X. M.: Some development of chronology round the tree, Quaternary Sci., 3, 265–271, 1997a.
25
Shao, X. M., Huang, L., Liu, H. B., and Shi, X. H.: Precipitation in Qinghai Millennium Delhi region using tree-ring record, Science in China, Ser. D., 34, 145–153, 1997b.
Shao, X. M., Wang, S. Z., Xu, Y., and Shi, X. H.: A 3500-year master tree-ring dating chronology from the northeast part of the Qaidam Basin, Quaternary Sci., 27, 477–485, 1997c.
Stockton, C. W. and Meko, D. M.: A long-term history of drought occur-rence in western United 30
States as inferred from tree rings, Weatherwise, 28, 245–249, 1975.
HESSD
9, 65–91, 2012Tree ring-based reconstruction in the
Jiaolai River since 1826
L. Ma et al.
Title Page
Abstract Introduction
Conclusions References
Tables Figures
◭ ◮
◭ ◮
Back Close
Full Screen / Esc
Printer-friendly Version Interactive Discussion
Discussion
P
a
per
|
Dis
cussion
P
a
per
|
Discussion
P
a
per
|
Discussio
n
P
a
per
Geology, 31, 109–115, 2011.
Van, R. B., Stahle, D. W., and Cleaveland, M. K.: Earthquake signals in tree-ring data from the New Madrid Seismic zone and implications for paleoseimicity, Geology, 26, 515–518, 1998. Wang, G. Q., Jin, J. L., Wang, J. X., Liu, Y., and Cai, Q. F.: Study on hydrological characteristics
of Liaohe River basin in response to climate change, Adv. Earth Sci., 26, 433–440, 2011. 5
Wang, T. and Zhu, Z. D.: The desertification problems of northern China, Quaternary Sci., 21, 56–65, 2004.
Wang, T., Zhu, Z. D., and Wu, W.: Sandy desertification in the north China, Science in China, Ser. D., 45, 23–34, 2002.
Wang, T., Wu, W., Xue, X., and Zhu, Z. D.: Spatial-temporal changes of sandy desertified Land 10
during Last five decades in northern china, Acta Geogr. Sinica, 59, 203–212, 2004a. Wang, T., Wu, W., Zhao, H. L., Xue, X., and Chen, G. T.: Analyses on driving factors to sandy
desertification process in Horqin region, China Journal of Desert Research, 24, 519–528, 2004b.
Wang, T., Chen, G. T., Zhao, H. L., and Wu, W.: Research progress on aeolian desertification 15
process and controlling in north of china, Journal of Desert Research, 226, 507–516, 2011. Wang, Y. J., Chen, F. H., Gou, X. H., and Zhu, Z. D.: Change in runoff. During March to June in
Heihe since 230-year ago, China Journal of Desert Research, 26, 202–206, 2004.
Woodhouse, C. A.: A tree-ring reconstruction of streamflow for the Colorado FrontRange, J. Am. Water Resour. As., 37, 561–570, 2001.
20
Wu, X. D., Sun, L., and Zhan, X. Z.: The initial attempt on past climate in central Tibet use of tree-ring reconstruction, Acta Geogr. Sinica., 44, 334–341, 2001.
Yang, H. S., Liu, J., and Liang, H. Y.: Change characteristics of climate and water resources in west Liaohe River Plain, Chinese Journal of Applied Ecology., 20, 84–90, 2009.
Zhang, J. and He, J. S.: Analysis of runoffseries characteristics in the Liaohe Basin, China 25
Rural Water and Hydropower, 4, 10–13, 2011.
Zhang, J. Y., Zhang, S. L., Wang, J. X., and He, J. S.: Study on runofftrends of the six larger basins in China over the past 50 years, Adv. Water Sci., 18, 230–234, 2011.
Zhao, H. L., Zhou, R. L., and Liang, H. Y.: Effects of human activity and climate changes on vegetation in Horqin Sandy grassland, Inner Mongolia, Adv. Earth Sci., 23, 408–414, 2008. 30
HESSD
9, 65–91, 2012Tree ring-based reconstruction in the
Jiaolai River since 1826
L. Ma et al.
Title Page
Abstract Introduction
Conclusions References
Tables Figures
◭ ◮
◭ ◮
Back Close
Full Screen / Esc
Printer-friendly Version Interactive Discussion
Discussion
P
a
per
|
Dis
cussion
P
a
per
|
Discussion
P
a
per
|
Discussio
n
P
a
per
|
Table 1.Correlation coefficient of standard chronology and runoff.
Runoffin March
Runoffin April
Runoffin August
Runoffin September
Runoffin October
Runoffin November
Annual Runoff
Standard chronology 0.365** 0.296* 0.455** 0.512** 0.549** 0.281* Standard chronology in yeart+1 0.384** 0.491** 0.298* 0.483** 0.545** 0.277* Standard chronology in yeart+2 0.301* 0.374** 0.449** 0.520** 0.584** 0.454** Standard chronology in yeart+3 0.444** 0.558** 0.386** 0.368** 0.566** 0.626** 0.455**
HESSD
9, 65–91, 2012Tree ring-based reconstruction in the
Jiaolai River since 1826
L. Ma et al.
Title Page
Abstract Introduction
Conclusions References
Tables Figures
◭ ◮
◭ ◮
Back Close
Full Screen / Esc
Printer-friendly Version Interactive Discussion
Discussion
P
a
per
|
Dis
cussion
P
a
per
|
Discussion
P
a
per
|
Discussio
n
P
a
per
Table 2.Correlation coefficients of runoffand precipitation.
Runoffin March
Runoffin April
Runoffin July
Runoffin August
Runoffin September
Runoffin October
Runoffin November
Annual Runoff
Precipitation in July 0.395** 0.293* 0.469** 0.288* 0.398** 0.366** 0.445** 0.519**
Precipitation in August 0.572** 0.414** 0.329* 0.283*
Precipitation in September 0.574** 0.291* 0.285*
Annual Precipitation 0.276* 0.316* 0.443** 0.359** 0.417** 0.415** 0.430** 0.381**
HESSD
9, 65–91, 2012Tree ring-based reconstruction in the
Jiaolai River since 1826
L. Ma et al.
Title Page
Abstract Introduction
Conclusions References
Tables Figures
◭ ◮
◭ ◮
Back Close
Full Screen / Esc
Printer-friendly Version Interactive Discussion
Discussion
P
a
per
|
Dis
cussion
P
a
per
|
Discussion
P
a
per
|
Discussio
n
P
a
per
|
Table 3.Mean runoffchanges in the reconstruction sequence.
Mean runoff Mean runoff
Times (×10 000 m3) Times (×10 000 m3)
1820s 1415.61 1920s 911.33
1830s 1017.40 1930s 1019.15
1840s 975.48 1940s 1119.74
1850s 1225.76 1950s 1410.31
1860s 961.44 1960s 972.87
1870s 1088.97 1970s 887.31
1880s 719.28 1980s 824.57
1890s 971.15 1990s 635.25
1900s 1127.83 2000s 344.35
HESSD
9, 65–91, 2012Tree ring-based reconstruction in the
Jiaolai River since 1826
L. Ma et al.
Title Page
Abstract Introduction
Conclusions References
Tables Figures
◭ ◮
◭ ◮
Back Close
Full Screen / Esc
Printer-friendly Version Interactive Discussion
Discussion
P
a
per
|
Dis
cussion
P
a
per
|
Discussion
P
a
per
|
Discussio
n
P
a
per
|
Fig. 1. Location of the Horqin Sandy Land: meteorological station and runoff stand distribution
Fig. 1.Location of the Horqin Sandy Land: meteorological station and runoffstand distribution.
HESSD
9, 65–91, 2012Tree ring-based reconstruction in the
Jiaolai River since 1826
L. Ma et al.
Title Page
Abstract Introduction
Conclusions References
Tables Figures
◭ ◮
◭ ◮
Back Close
Full Screen / Esc
Printer-friendly Version Interactive Discussion
Discussion
P
a
per
|
Dis
cussion
P
a
per
|
Discussion
P
a
per
|
Discussio
n
P
a
per
|
27
-0
50
100
150
200
250
1820
1850
1880
1910
1940
1970
2000
Year
Sa
mp
le
s
iz
e
0.4
0.6
0.8
1.0
1.2
1.4
1.6
1.8
ST
D
Sample size
STD
Fig. 2. Regional elm STD chronologies and sample size.
Fig. 2.Regional elm STD chronologies and sample size.
HESSD
9, 65–91, 2012Tree ring-based reconstruction in the
Jiaolai River since 1826
L. Ma et al.
Title Page Abstract Introduction Conclusions References Tables Figures ◭ ◮ ◭ ◮ Back Close
Full Screen / Esc
Printer-friendly Version Interactive Discussion Discussion P a per | Dis cussion P a per | Discussion P a per | Discussio n P a per 0 200 400 600 800 1 000 1 200 1 400 1 600 1 800 0 5000 1 0000 1 5000 20000 25000 30000 35000
1 955 1 960 1 965 1 970 1 975 1 980 1 985 1 990 1 995 2000 2005 201 0
m o n t h l y r u n o f f ( × 1 0, 000m ³) A n n u a l r u n o f f ( × 1 0, 000m ³ ) Year
annual runoff runoff i n Oct runoff i n Nov runoff i n Oct - Nov
HESSD
9, 65–91, 2012Tree ring-based reconstruction in the
Jiaolai River since 1826
L. Ma et al.
Title Page
Abstract Introduction
Conclusions References
Tables Figures
◭ ◮
◭ ◮
Back Close
Full Screen / Esc
Printer-friendly Version Interactive Discussion
Discussion
P
a
per
|
Dis
cussion
P
a
per
|
Discussion
P
a
per
|
Discussio
n
P
a
per
|
29
-chronology
runoff
precipitation
A u g,S e p ,O ct,N o v
Ju
ly
,A
ug
,S
ep
,O
ct
,N
ov
July
,A
ug
,Se
p
Fig. 4. Correlation of precipitation, runoff, and chronology.
Fig. 4.Correlation of precipitation, runoff, and chronology.
HESSD
9, 65–91, 2012Tree ring-based reconstruction in the
Jiaolai River since 1826
L. Ma et al.
Title Page
Abstract Introduction
Conclusions References
Tables Figures
◭ ◮
◭ ◮
Back Close
Full Screen / Esc
Printer-friendly Version Interactive Discussion
Discussion
P
a
per
|
Dis
cussion
P
a
per
|
Discussion
P
a
per
|
Discussio
n
P
a
per
0
200
400
600
800
1000
1200
1400
1600
1800
2000
1825 1845 1865 1885 1905 1925 1945 1965 1985 2005
runof
f (
×
10,
000m
³
)
Yea r
reconstructed runoff in Oct-Nov
mea sured runoff in Oct-Nov
HESSD
9, 65–91, 2012Tree ring-based reconstruction in the
Jiaolai River since 1826
L. Ma et al.
Title Page
Abstract Introduction
Conclusions References
Tables Figures
◭ ◮
◭ ◮
Back Close
Full Screen / Esc
Printer-friendly Version Interactive Discussion
Discussion
P
a
per
|
Dis
cussion
P
a
per
|
Discussion
P
a
per
|
Discussio
n
P
a
per
|
HESSD
9, 65–91, 2012Tree ring-based reconstruction in the
Jiaolai River since 1826
L. Ma et al.
Title Page
Abstract Introduction
Conclusions References
Tables Figures
◭ ◮
◭ ◮
Back Close
Full Screen / Esc
Printer-friendly Version Interactive Discussion
Discussion
P
a
per
|
Dis
cussion
P
a
per
|
Discussion
P
a
per
|
Discussio
n
P
a
per