SCALABLE EVOLUTIONARY COMPUTATION FOR EFFICIENT INFORMATION
EXTRACTION FROM REMOTE SENSED IMAGERY
L. M. Almutairia, S. Shetty a, H. G. Momm b a
Dept. of Electrical and Computer Engineering, Tennessee State University, Nashville, TN 37209 USA- (lalmutai ,sshetty)@tnstate.edu
b
Department of Geosciences, Middle Tennessee State University, Murfreesboro, TN 37132 USA- [email protected]
KEY WORDS: genetic programming, cloud computing, Hadoop, MapReduce, Hadoop Distributed File System.
ABSTRACT:
Evolutionary computation, in the form of genetic programming, is used to aid information extraction process from high-resolution satellite imagery in a semi-automatic fashion. Distributing and parallelizing the task of evaluating all candidate solutions during the evolutionary process could significantly reduce the inherent computational cost of evolving solutions that are composed of multi-channel large images. In this study, we present the design and implementation of a system that leverages cloud-computing technology to expedite supervised solution development in a centralized evolutionary framework. The system uses the MapReduce programming model to implement a distributed version of the existing framework in a cloud-computing platform. The proposed system has two major subsystems; (i) data preparation: the generation of random spectral indices; and (ii) distributed processing: the distributed implementation of genetic programming, which is used to spectrally distinguish the features of interest from the remaining image background in the cloud computing environment in order to improve scalability. The proposed system reduces response time by leveraging the vast computational and storage resources in a cloud computing environment. The results demonstrate that distributing the candidate solutions reduces the execution time by 91.58%. These findings indicate that such technology could be applied to more complex problems that involve a larger population size and number of generations.
1. INTRODUCTION
Remote sensing can aid studies on earth surface processes, homeland security, disaster response, agricultural and environmental resource management, weather forecasting and global change research (Momm & Easson, 2011a). However, as a result of significant advances in technology, many organizations face the challenge developing timely and cost-effective techniques that can successfully identify certain types of features from remotely sensed imagery (Momm & Easson, 2011a). The main challenge lies in analysing a large number of images over a long period of time and converting image data into actionable intelligence by extracting specific features. In addition, the relationship between the different image regions is too complex to be solved by explicit programming (Momm & Easson, 2011a). Evolutionary computation is one of methods that can be used to improve feature extraction. However, this technique suffers from heavy computational overheads, as multi-channel images have to be processed thousands of times during the evolutionary process (Momm & Easson, 2011b).
Cloud computing has emerged as a popular platform with availability of elastic on-demand computation, storage and networking resources. The platform provides benefits to applications by offering large storage capabilities that allow huge amounts of data to be collected and managed together with vast computational resources that allow the effective implementation of cost-effective computation in a timely fashion (Hwang et al., 2012). In this paper, we present the design and implementation of a scalable genetic algorithm in the cloud-computing platform to accelerate the evolutionary computation process for feature extraction from remotely sensed imagery. The paper provides an overview of the design and implementation of a system that leverages cloud-computing technology to develop a scalable genetic algorithm that is capable of expediting the feature extraction process in an
evolutionary framework. The scalable genetic algorithm was designed using the distributed Hadoop/MapReduce environment. The proposed system has two major subsystems; (i) data preparation: the generation of random image band combinations; and (ii) distributed processing: the distributed implementation of genetic programming, which can be employed to spectrally distinguish the feature of interest from the remaining image background of remote sensed imagery in a cloud computing environment in order to improve scalability. The proposed system reduces response time by leveraging the vast computational and storage resources available in a cloud computing environment. This manuscript is organized as follows: section 2 contains an overview of the remote sensing, genetic programming, cloud-computing platform and Hadoop/MapReduce programming environment; section 3 provides details of the design and implementation of the system, while section 4 involves the performance evaluation of the system. Finally, section 5 presents the conclusion and an overview of the main findings of the study.
2. BACKGROUND
2.1 Remote Sensing Data
Remote sensed data comprises of most digital images, captured by sensors that record electromagnetic energy reflected and/or emitted by features. The processing of remote sensing data can be divided into three stages: pre-processing, processing and post-processing. Pre-processing operations prepare the input data for the actual image processing stage by minimizing the distortions and/or errors in an image that could prevent successful classification, or by extracting the most critical information from an image (Momm & Easson, 2011a; Khorram et al., 2012). Algebraic spectral band combinations (referred to as spectral indices), such as division, addition, subtraction, or
multiplication, are examples of the way in which images can be pre-processed in order to enhance information. Furthermore, different spectral indices are used for improved change detection and spectral enhancement studies. For instance, infrared band over red band is used for vegetation distribution, green band over red band is used for mapping surface water bodies and wetland delineation, red band over infrared band is used for mapping turbid waters, and red band over green band is used for mineral mapping (Momm & Easson, 2011a; Khorram et a.l, 2012). After pre-processing, satellite images are ready for image classification process that converts the original spectral data, which are variable and may show complex relationships across several image bands, into a simple thematic map for end users (Khorram et al., 2012). The classification procedure extracts important and valid information from multidimensional data set that is otherwise difficult to understand. Each pixel in an image is assigned to a particular category in a set of categories of interest such as a set of land cover types. In the proposed system, K-means was the classification algorithm used to automatically cluster image pixels with similar spectral characteristics (Momm & Easson, 2011a). The selection of the K-means algorithm was based on its simple implementation and low computational cost. Any other classification algorithm could have been employed instead.
The quantitative measure of the classification accuracy constitutes a post-processing step. In this step, accuracy is calculated by comparing the resultant thematic image with user provided reference information (Momm & Easson, 2011b). Kappa coefficient (K) is a common metric that is used to measure the agreement between thematic maps by accounting for any agreement due to random chance of agreement (Momm & Easson, 2011a). Kappa coefficient lies on a scale between -1 and 1, where 1 indicates complete agreement beyond random chance and 0 indicates agreement solely by chance. Kappa values greater than 0.80 represent strong agreement beyond the random change of agreement, values between 0.40 and 0.80 represent moderate agreement beyond the random change of agreement, and values below 0.40 represent poor agreement beyond the random change of agreement (Momm & Easson, 2011a; Gong, 2003). Kappa statistics can be computed as: The observed proportional agreement between two images
� =�∑��= ��� (1)
the expected agreement by chance is:
��=
�2∑��= ��+�+� (2)
��+ is the total of the it row, f+is the total for the it column. The kappa statistic is:
� =�0−��
−�� (3)
2.2 Genetic Programming
Genetic programming (GP) is an automated method for generating computer programs that solve specific problems based on principles of natural selection (Robinson, 2001; (Abraham et al., 2006). Genetic programming starts with thousands of randomly created computer programs where the only successful individuals are progressively evolved over a series of generations. Fitness function in genetic programming
created based on mutation and crossover operations. Mutation is the operation where a function is replaced by another function in a solution, while the crossover operation means two solutions are combined to form two new solutions or offspring (Robinson, 2001). Table 1 shows genetic programming steps (Robinson, 2001; Abraham et al., 2006; Koza, 1992). In the proposed system, solutions are images that are created based on one satellite image.
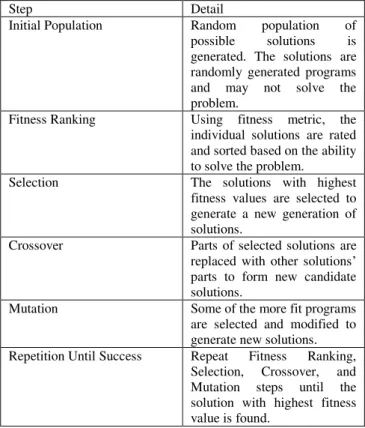
Step Detail
Initial Population Random population of possible solutions is generated. The solutions are randomly generated programs and may not solve the problem.
Fitness Ranking Using fitness metric, the individual solutions are rated and sorted based on the ability to solve the problem.
Selection The solutions with highest fitness values are selected to generate a new generation of solutions.
Crossover Parts of selected solutions are replaced with other solutions’ parts to form new candidate solutions.
Mutation Some of the more fit programs are selected and modified to generate new solutions. Repetition Until Success Repeat Fitness Ranking,
Selection, Crossover, and Mutation steps until the solution with highest fitness value is found.
Table 1. Genetic programming steps
2.3 Cloud Computing
Cloud computing allocates dynamic computing, storage and network resources to deliver large numbers of services to end-users and enable them to share access to these resources from anywhere, at any time, through their connected devices (Hwang et al., 2012). Cloud data storage services provide large disk capacity and service interfaces that allow users to place and fetch data. Furthermore, cloud infrastructure provides thousands of computing nodes for any application, which allows programmers to use the power of these machines without considering infrastructure management issues such as handling network failure. Providers of cloud computing have developed workflow and data query platforms to support distributed computing and storage applications. Runtime support of cloud computing providers includes distributed monitoring services, a distributed task scheduler, distributed locking and other services (Hwang et al., 2012). One of the popular distributed programming models on the cloud computing platform is MapReduce/Hadoop. This model is commonly employed to process large data sets in distributed mode over the cloud (Apache, 2014). It is mainly used in data analytics, indexing, reputation systems, and data mining.
2.4 Hadoop
expand to store and process petabytes of data on a thousand or more client machines (Apache, 2014; White, 2012). Some features of Hadoop are:
Scalable: New nodes can be added to the Hadoop cluster when needed.
Flexible: It can join multiple data sets in different ways to analysis them easily.
Fault tolerant: When a node fails, the system replicates data to another node in the cluster and continues processing data.
Hadoop has two major subprojects: MapReduce and Hadoop Distribute File System (HDFS). MapReduce is a programming model that understands and allocates work to the nodes in the cloud. The map function within MapReduce divides the input dataset into distinct blocks and then generates a set of intermediate key/value pairs. Next, Reduce function merges all intermediate values with the same intermediate key and sorts the complete job output. HDFS is the distributed file system that includes all the nodes in a Hadoop cluster for data storage. HDFS has master/workers architecture including a master node called NameNode and a number of workers called DataNode (Apache Software, 2014; White, 2012).
2.5 MapReduce
MapReduce is parallel programming that was developed by Google for large-scale data processing in distributed environment. As described in the previous subsection, MapReduce involves two main functions that are map and reduce. The mechanism of the MapReduce framework (Dean & Ghemawat, 2004 copies the MapReduce job into all cluster nodes (Figure 1). The input data set is then divided into smaller segments that are assigned into individual map tasks. Each map task takes a set of input <key,value> pairs and performs operations that were written by the user to produce a set of intermediate <key,value> pairs. Then, the MapReduce library merges all intermediate values that have the same intermediate key to send them into the Reduce function that written by the programmers. Reduce function performs programmer’s predefined operations on all values to produce a new set of <key,value> pairs, which will be the final output of the MapReduce job. Sometimes, programmers need to perform a partial merge of the map tasks outputs before reduce stage. In this case, combiner function can be used where its output is passed to reduce function through an intermediate file (Miner & Shook, 2012; (Apache Software, 2013).
Figure 1. Diagram of MapReduce programming model.
3. PROPOSED SYSTEM
We developed a system based on distributed genetic programming technology on a cloud-computing platform to efficiently extract features for high-resolution remote sensing. The proposed system has two subsystems:
Data Preparation: Data preparation subsystem is representing the input data in the format expected by the distributed processing subsystem.
Distributed Processing: Distributed processing subsystem is responsible for performing evolutionary computation and identifies the feature of interest from the remote sensed image.
3.1 Data Preparation:
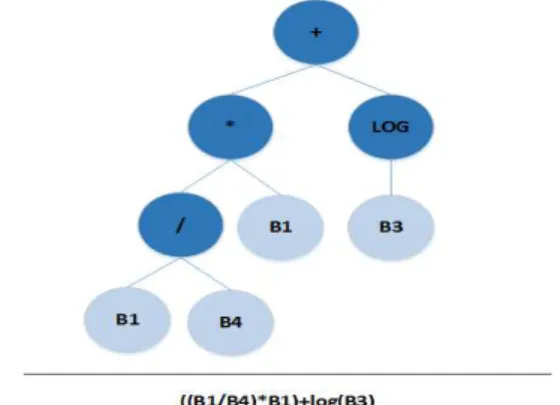
The first step of identifying and distinguishing certain types of features from multispectral images is preparing image for processing. Multispectral image includes multiple spectral bands, and spectral band indices are the most common spectral transformations used in remote sensing. These spectral indices apply pixel-to-pixel operations to create a new value for individual pixels according to some pre-defined function of spectral values (Momm & Easson, 2011a). These operations enhance the image and some features become more discernible. A set of candidate solutions is randomly generated to initiate the genetic programming procedure. These candidate solutions are stored in hierarchical tree structures (Figure 2). The candidate solutions are created such that they meet the requirements of image bands combinations. The candidate solutions are internally stored as hierarchical expression trees and externally represented as computer programs (Momm & Easson, 2011a). The leaves of these binary expression trees are image spectral bands, and the nodes are operands such as summation, subtraction, multiplication, division, logarithms, and square root. The proposed system generates the number of candidate solutions with predefined heights and stores them in one or more text files in the Hadoop Distributed File System on the cloud (HDFS). Figure 3 shows the data flow for the data preparation subsystem.
Figure 2. Example of candidate solution represented as hierarchical tree expression (internally) and computer program
(externally).
Figure 3. Data flow for data preparation subsystem.
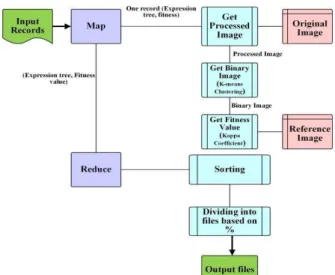
3.2 Distributed processing:
The distributed processing subsystem employs a MapReduce programming model to implement and process operations of feature extraction in the HDFS. The proposed system applies each candidate solution independently to the original multi-spectral image, which is stored in the cache distributed memory and contains the interested feature, in order to produce transformed images (processed image). Each processed image produces a two-class binary image using the K-means clustering method, which is one of the simplest unsupervised learning algorithms for the purposes of attempting to identify hidden structures in unidentified data (Moore, 2011). The two classes in the binary images indicate the presence and absence of the target feature (Momm & Easson, 2011b). Then, the system individually compares each binary image to the reference image, which is stored in the cache distributed memory and consists of both positive examples (where the feature is found) and negative examples (where the feature is not found), to produce fitness value using Kappa coefficient of agreement. All candidate solutions are sorted according to their fitness values and stored in HDFS to produce the next generation of candidate solutions. The system stops and outputs the most fitting solution if the criteria are met, which are the highest fitness value and the maximum number of generations. If none of these criteria are met, the system will apply the genetic operations on top most fit candidate solutions. The genetic operations used were mutation that was applied on the highest 3% and the crossover operation that was applied on the next highest 20% of the generation (Momm & Easson, 2011a; 2001b). The system iteratively repeats until the stop criteria are met. The proposed system employs two MapReduce jobs: one for the first generation of candidate solutions and one for the following generations. The first MapReduce receives the first population input from the data preparation subsystem and automatically generates the number of map tasks required to handle the input records (candidate solutions). The map tasks emit the original candidate solutions with the fitness values. Then, the reducer task reads all records from the map tasks and sorts them according to their fitness values. The output files from the reducer are categorized as follows: 3% for mutation, 20% for crossover, and 77% for replication (remaining individuals of the population). The output files from the first job will be stored in HDFS to be used as input files for the next MapReduce job. Figure 4 shows the first MapReduce job that contains Map and Reduce stages.
Figure 4. Main steps in the first MapReduce job used to create the first generation.
The second MapReduce job involves mutation and crossover operations that are required to evolve next generations. Map tasks send each candidate solution and its fitness value to the combiner, which implements the genetic operations and generates the new processed and binary images with the new fitness value. The combiner sends the results to the reducer, which sorts and produces the new candidate solutions and fitness values. The second MapReduce job will be repeated iteratively until the stopping criteria are met. Figure 5 shows the second MapReduce job and figure 6 shows the complete system, including the two MapReduce jobs. The final result of the system represents the optimal candidate solution to spectrally identify the target feature in the original image.
Figure 5. Main steps in the second MapReduce job designed to perform the evolutionary process.
Figure 6. Diagram of the proposed system.
4. PERFORMANCE EVALUATION
We implemented our system on a Hadoop-based cloud computing environment that consisted of 15 Dell blade servers, with each server consisting of two CPU, six core-Intel Xeon processors and two TB internal memory size. The total number of processing cores available was 90. The operating system was the Ubuntu 12.04 with 14 lives nodes and 6395 blocks. The original satellite image used for the performance evaluation was acquired with the QuickBird sensor of Oxford, Mississippi, USA, and was composed of four spectral bands: Blue (485 nm), Green (560 nm), Red (660 nm), and Near Infra-red (830 nm) (Momm et al., 2008). The system was evaluated based on three performance benchmarks: number of distributed map tasks, size of population and number of generations.
4.1 Number of distributed map tasks
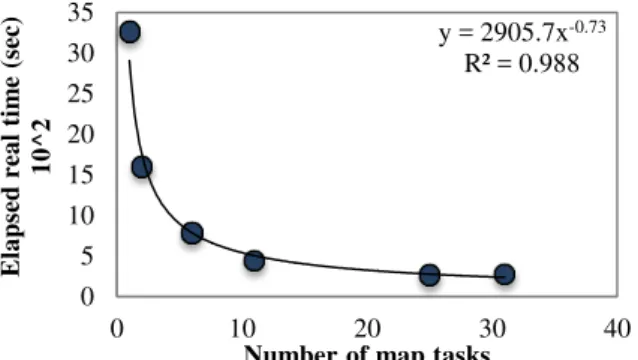
Hadoop automatically allocates input, after dividing it into blocks, with map tasks. Since the number of map tasks cannot be controlled, the number of input files can be used to define the number of input blocks. Therefore, a different number of input files (1, 2, 5, 10, 20, and 25) were used to test time and memory size. The average number of map tasks automatically generated by Hadoop increased in accordance with the number of input files (Figure 7). In addition, when the number of distributed map tasks increased the actual time decreased by 91.58% (Figure 8). There is an optimal number of map tasks (around 10) that beyond that does not reduce the time much. However, the relationship between the number of distributed Map tasks and memory size was linear. If the average number of distributed Map tasks increased from 1 to 31, the total memory size used for the job increased by 95.25% (physical memory) and 92.90% (virtual memory). Figures 9 and 10 show the relationship between increasing the average number of map tasks and physical and virtual memory sizes respectively.
Figure 7. Number of input files versus number of generated Map tasks by Hadoop.
Figure 8. Number of map tasks versus elapsed real time of the job.
Figure 9. Number of Map tasks versus physical memory size (GB).
Figure 10. Number of map tasks versus virtual memory size (GB).
y = 1.2604x - 0.5674 R² = 0.9983
0 5 10 15 20 25 30 35
0 10 20 30
Nu m b e r o f M a p ta sk s
Number of input files
y = 2905.7x-0.73 R² = 0.988
0 5 10 15 20 25 30 35
0 10 20 30 40
Ela p se d r e a l tim e (se c ) 1 0 ^ 2
Number of map tasks
y = 0.6052x + 0.5819 R² = 0.996 0 5 10 15 20 25
0 10 20 30 40
Ph y sic a l m e m o r y siz e (G B )
Number of map tasks
y = 2.5771x + 3.2251 R² = 0.9981 0 10 20 30 40 50 60 70 80 90
0 10 20 30 40
V irtu a l m e m o r y siz e (G B )
Number of map tasks The International Archives of the Photogrammetry, Remote Sensing and Spatial Information Sciences, Volume XL-1, 2014
4.2 Size of Population
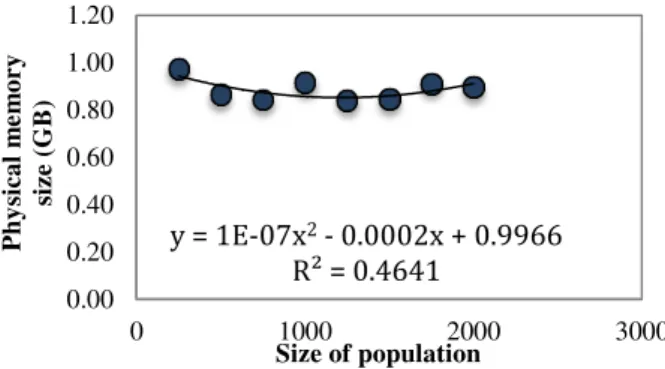
Testing the performance of the MapReduce job for the first generation of candidate solutions involved studying eight test cases of various sizes (250, 500, 750, 1000, 1250, 1500, 1750, and 2000). We chose 10 as the average number of map tasks since it is an optimal number. The average elapsed time increased when the size of the population increased to reach 1.67 hour for 2000 candidate solutions (Figure 11), while the CPU time increased to reach approximately the same amount of real time (Figure 12). Furthermore, the physical memory size oscillated between 0.8 GB and 1 GB for all population sizes (Figure 13), and 5-8 GB with a slight increase in the virtual memory size (Figure 14).
Figure 11. Size of population versus average versus elapsed real time of the job.
Figure 12. Relationship between the size of population and average CPU time of the job.
Figure 13. Relationship between the size of population and average physical memory size (GB).
Figure 14. Size of population versus average virtual memory size (GB).
4.3 Number of Generations
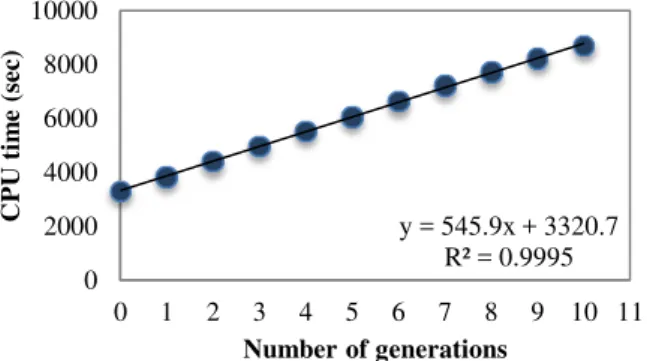
Testing the performance of the MapReduce job involves varying the number of generations. The test cases include from two generations to 101 generations. The result indicated that increasing the number of generations increased the elapsed real time required to accomplish the complete job. The total time for the highest test case (101 generations) was 5.45 hours (Figure 15). In addition, the test cases from one generation to ten generations showed that the real time increased by 73.1% and the CPU time also increased by 55.85%, as shown in Figures 16 and 17 respectively.
Figure 15. Number of generations versus average elapsed real time.
Figure 16. Relationship between the number of generations (1-10) and average elapsed real time.
y = 2.8881x + 164.04 R² = 0.9971 0 1000 2000 3000 4000 5000 6000 7000
0 500 1000 1500 2000 2500
Ela p se d r e a l tim e (se c )
Size of population
y = 3.0401x + 107.78 R² = 0.9968 0 1000 2000 3000 4000 5000 6000 7000
0 500 1000 1500 2000 2500
CPU ti m e (se c )
Size of population
y = 1E-07x2 - 0.0002x + 0.9966
R² = 0.4641 0.00 0.20 0.40 0.60 0.80 1.00 1.20
0 1000 2000 3000
Ph y sic a l m e m o r y siz e (G B )
Size of population
y = 2.4655x0.15 R² = 0.7531 0 2 4 6 8 10
0 500 1000 1500 2000 2500
V ir tu a l m em o ry s iz e (G B )
Size of population
y = 190.81x + 123.46 R² = 0.9976 0 5 10 15 20 25
0 50 100 150
Ela p se d r e a l tim e (se c ) 1 0 ^ 3
Number of generations
y = 161.06x + 413.07 R² = 0.9994 0 500 1000 1500 2000 2500
0 1 2 3 4 5 6 7 8 9 10 11
Ela p se d r e a l tim e (se c )
Number of generations The International Archives of the Photogrammetry, Remote Sensing and Spatial Information Sciences, Volume XL-1, 2014
Figure 17. Relationship between the number of generations (1-10) and the average CPU time.
5. CONCLUSION
A distributed programming model can be used within a cloud computing environment to improve the performance of the genetic programming-based feature extraction system. MapReduce is a distributed programming model that can be successfully used to speed up the implementation of the genetic algorithm in a Hadoop-based cloud computing environment. The results show that speedup is achieved by dividing the input data into several blocks to decrease the execution time. Dividing the input data (the candidate solutions population) forces Hadoop to handle these data blocks by generating the approximate number of map functions. These map functions handle these blocks in a distributed manner. However, the system has one Reduce function that is pre-defined to handle all candidate solutions forwarded from the map functions. The reason for using one Reduce function is to sort all candidate solutions on one machine. Moreover, because implementing the MapReduce job requires an initial input data, the data preparation subsystem cannot be implemented using the MapReduce model. The results show that increasing the number of distributed map tasks decreased the average elapsed real time by 91.58%, while increasing the population size and number of generations increased the time. Therefore, we suggest improving the algorithm to find the optimal population size and number of generations to handle the increasing in execution time. The system could be improved to include more than six mathematical operations that used to in bands combinations to enhance the results. The performance of the system could be improved by including multithreads that may increase distributing tasks among cluster nodes.
The results produced in this pilot study demonstrate the potential of leveraging distributed-cloud computing technology to address remote sensing problems arising from the ever growing number of imagery data being produced. The developed technology provides the basic infrastructure to additional research in converting large mounts of image data into actionable intelligence in a cost-effective way.
ACKNOWLEDGEMENTS
This work is supported in part by a National Science Foundation (NSF) Grant HRD-1137466, Department of Homeland Security (DHS) SLA grant 2010-ST-062-0000041, 2011-ST- 062-0000046 and 2014-ST-062-000059. Laila Almutairi would like to acknowledge the financial support from Saudi Arabian Cultural Mission (SACM).
REFERENCES
Abraham, A., Nedjah, N. and Mourelle, L. D. M., 2006. Evolutionary Computation: from Genetic Algorithms to Genetic Programming. In: Genetic Systems Programming: Theory and
Experiences, Vol. 13, pp 1-20.
http://www.softcomputing.net/gpsystems.pdf (July 2014).
Dean, J. and Ghemawat, S., 2004. “MapReduce: Simplified Data Processing on Large Clusters”. In: Sixth Symposium on Operating System Design and Implementation, San Francisco CA.https://www.usenix.org/legacy/event/osdi04/tech/full_paper s/dean/dean.pdf (Oct 2013).
Gong, P., 2003. “Information Extraction: In Remote Sensing and Image Analysis,” University of California at Berkeley http://nature.berkeley.edu/~penggong/textbook/chapter7/html/se ct73.htm (Sept. 2013).
Hwang, K., Dongarra, J. and Fox, G. C., 2012. Distributed and Cloud Computing: Clusters, Grids, Clouds, and the Future Internet. Morgan Kaufmann, Watham, MA.
Khorram S., Nelson S. A.C., Koch, F. H. and Van Der Wiele, C. F., 2012. Remote Sensing, Springer-Verlag, US, pp: 17-28. 39-56.
Koza, J. R., 1992. On the Programming of Computers by Means of Natural Selection, Cambridge, MA: The MIT Press.
http://www.ru.lv/~peter/zinatne/ebooks/MIT%20-%20Genetic%20Programming.pdf (Sept. 2013).
Miner, D. and Shook, A., 2012. MapReduce Design Patterns: Building Effective Algorithms and Analytics for Hadoop and Other Systems. O'Reilly Media.
Momm, H. and Easson, G., 2011a. Feature Extraction from High-Resolution Remotely Sensed Imagery using Evolutionary Computation. In: Evolutionary Algorithms, Prof. Eisuke Kita, Ed..
Momm, H. and Easson, G., 2011b. Evolving spectral transformations for multitemporal information extraction using evolutionary computation. Journal of Applied Remote Sensing, 5(1).
Momm, H., Easson, G. and J. Kuszmaul, 2008. Uncertainty analysis of an evolutionary algorithm to develop remote sensing spectral indices, in Image Processing: Algorithms and Systems VI, edited by Jaakko T. Astola, Karen O. Egiazarian, Edward R. Dougherty, Proceedings of SPIE-ISandT Electronic Imaging, SPIE Vol. 6812, 68120A.
Moore, A., (2001). “K-means and Hierarchical Clustering–
Tutorial Slides,”
http://www-2.cs.cmu.edu/~awm/tutorials/kmeans.html (Jan 2014).
Robinson, A., 2001. Division III thesis “Genetic Programming: Theory, Implementation, and the Evolution of Unconstrained Solutions”, Hampshire College, Amherst, MA. http://faculty.hampshire.edu/lspector/robinson-div3.pdf (Sept. 2013).
The Apache Software Foundation, 2013. “MapReduce
Tutorial,”http://hadoop.apache.org/docs/r1.2.1/mapred_tutorial. html (Oct. 2013).
y = 545.9x + 3320.7 R² = 0.9995 0
2000 4000 6000 8000 10000
0 1 2 3 4 5 6 7 8 9 10 11
CPU ti
m
e
(se
c
)
Number of generations
The Apache Software Foundation, 2014. “Apache Hadoop,” http://wiki.apache.org/hadoop/ (Jan. 2014).
White, T., 2012. Hadoop: The Definitive Guide. 3rd edition, O'Reilly Media / Yahoo Press.