Lysine Content Determination
in Xianyu 335 Corn and Its Uncertainty Assessment
Chen Ying, Zhang Min*
Ginseng and Antler Products Testing Center of the Ministry of Agriculture Jilin Agricultural University
Xincheng Street 2888, Changchun 130118, China
E-mails: [email protected],[email protected]
*
Corresponding author
Received: March 21, 2013 Accepted: June 14, 2013
Published: July 29, 2013
Abstract: [Objective] To establish a mathematical model of uncertainty assessment for lysine content in Xianyu 335 corn by the amino acid assay, completely concerning the sources of uncertainty in the measurement process. [Methods] Analyze and measure the main source of uncertainty, and evaluate and calculate the each component of uncertainty. [Results] For 0.1055 g sample, the lysine determination in Xianyu 335 showed a good linear relationship. [Conclusion] This method is suitable for the Uncertainty Evaluation of lysine measurement in Xianyu335 by amino acid assay.
Keywords: Xianyu 335, Amino acids, Uncertainty, Assessment.
Introduction
Corn Xianyu 335 has many good characteristics, such as the higher and more stable yield, lodging resistance, wide adaptability, appropriate mature period, reasonable plant shape, etc., Corn is a very important ingredient in the animal feed, and Xianyu 335 has a higher content of lysine, sometime it can replace lysine additive, fish meal, soybean meal and so on. For a long time, the main methods for determination of lysine are amino acid assay, and the experimental procedures have been very mature. But the results of the same sample showed a certain error, which because those experiments are performed by different labs or different people in same lab. We analyzed the causes of error through the determination of lysine, evaluated the uncertainty assessment of these quantitative results, and found that the quantification of lysine have a certain confidence interval which play the role of the correction result on the measurement of lysine.
Materials and methods
Xianyu 335 samples were purchased in Jilin Province, China, dried at 60°C after mashing using organizations broken machine, filtered with 60 mesh sieve after crushing by pulverizer, and then mixed, separately stored in bottle for detection.
Lysine reference substance were purchased from the Beijing Academy of Agricultural Sciences, 14.62 mg/L, 6.0 mol/L hydrochloric acid solution, guarantee reagent, Beijing Chemical industry; MCI Buffer L-8500-PH Kit for Mitsubishi Chemical Corporation; Coloration liquid: R1, R2 is Japan, and by Wako Pure Chemical Industries Co., Ltd. All glassware and experimental apparatus are immersed by concentrated sulfuric acid, washed with deionized water.
The temperature of the laboratory (20±5)°C; volumetric flask, pipettes and other glass container are according to the JJG196-2006 test procedures [1]. Class B equipment standards; 0.1mg division balance was used according to JJG 1036-2008 requirements of Electronic balance [2]; testing instruments (Agilent1200) meet JJG705-2002 test requirements liquid chromatographs [3]. Methanol and other reagents meet the analytical criteria, water is pure water, Hangzhou Wahaha Group Co., Ltd.
0.1 g of Xianyu 335 powder were weighed by 0.1 mg precision balance accurately and placed in the hydrolysis tube added 10.00 ml 6.0 mol/L hydrochloric acid, N2 flowed through for 1min, and covered with rubber plug. This hydrolysis tube was sealed after vacuumed by vacuum pump, placed in a 110°C thermostatic oven, hydrolyzed for 22 h. When the hydrolysis ended, hydrolysis solution was filtered and transferred to a 50.00 ml volumetric flask and add deionized water to a constant volume. 1.00 ml filtrate was put into the beaker, and evaporated to dryness in a vacuum dryer, and then 1~2 ml of water was dissolved and then evaporated to dryness and repeated 2 times, and finally the residue was dissolved with 1.00 ml of 0.02 mol/L hydrochloric acid, filtered with 0.22 μm polyethylene ether sulfone membrane filtration then for determination on the machine.
Japan's Hitachi L-8800 amino acid analyzer; electronic analytical balance: 1712mp8 oven thermostat: DG 30/14-II. Chromatographic column: Elipses XDB C18 (4.6×250 mm, 4.6 μm); buffer: PH1, PH2, PH3 and PH4, pH 5; detection wavelength for reaction solution: R1, R2; 570 nm (visible light); buffer flow rate was 4.0 ml/min, the flow rate of reaction liquid was 4.0 ml/min; column temperature: 57°C; injection volume was 20 μl.
Results and discussion
Preparation of standard curve
Take exactly 0.1, 0.2, 0.3, 0.4, 0.6 ml reference substance Radix angelicae dahuricae with a 1 ml single channel pipette. Get constant volume to 1ml and place in an automatic sampling bottle. According to above “chromatographic condition” to test peak area, using the least square method with the peak area A and Radix angelicae dahuricae standard concentration
C (mg/ml) were for linear fit. The Radix angelicae dahuricae graticule is:
A = 0.2088 + 44.9649C, r = 0.9999.
Determination of sample
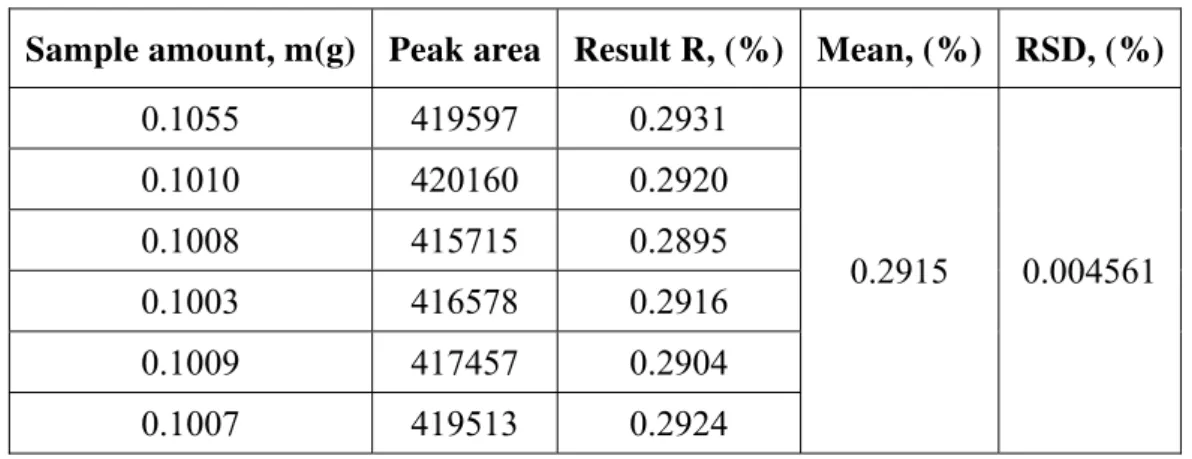
Filtrate the sample solution with 0.22 μm nylon membrane, according to 2 “chromatographic condition”, determine on the machine. The peak area of the sample area was measured, and the results were shown in Table 1.
Table 1. The content of lysine in different volume injection sample (n = 6)
Sample amount, m(g) Peak area Result R, (%) Mean, (%) RSD, (%)
0.1055 419597 0.2931
0.2915 0.004561
0.1010 420160 0.2920
0.1008 415715 0.2895
0.1003 416578 0.2916
0.1009 417457 0.2904
0.1007 419513 0.2924
Evaluation of uncertainty
Mathematical model
Mathematical calculation formula for Lysine content measurement:
6
10
standard sample load volume
standard removal
C A V V
R
A m V
× × ×
=
× × × , (1)
where R is the lysine content in the sample, %; Cstandard means reference sample
concentration, mg/L; Vvolume is the final volume of the sample, mL; Asample means peak area of
a sample mAu; Astandard means the peak area of the reference substance, mAu; m is the sample
weight, g; the volume of the sample Vload is the sample volume loaded on the machine, mL;
Vremoval is the sample volume removed.
The major source of measurement uncertainty
The method of GB / T 5009.124-2003A [4] for determination of the lysine content there are the following mainly sources of uncertainty: (1) samples weighing introduced uncertainty; (2) the final volume of samples introduces uncertainty; (3) sample process introduces uncertainty; (4) sample peak area measurement introduced uncertainty; (5) the nonlinear standard curve introduced uncertainty.
Evaluation of measurement uncertainty
The samples weighing introduced uncertainty [u(m)]
The balance calibration uncertainty introduced: the balance test showed analytical balance error is 0.1 mg, according to rectangular distribution ( k= 3 ), uncertainty component introduced by the balance calibration:
2 2
( ) 2[(0.00005) (0.00005) ] 0.0001 g
u m = + = . (2)
Weighing variability introduced uncertainty: according to Uncertainty Evaluation Guide in chemical analysis [5] the analytical balance variability is about 0.5 × the final significant figure, and the final significant figure of the analysis balance in our laboratory was 0.1 mg. So, weighing variability introduced the uncertainty components:
2( ) 0.5 0.1 mg 0.00005 g
u m = × = . (3)
Weighing by the difference method should calculated uncertainty twice, so the uncertainty introduced by the weighing scales:
2 2
( ) 2[(0.00005) (0.00005) ] 0.0001g
u m = + = . (4)
The sample weighted m = 0.1055 g, the relative standard uncertainty introduced by weighing:
( ) 0.0001 g / 0.1055 g 0.000947
rel
u m = = . (5)
The final volume of samples introduced uncertainty [u(V)]
50 mL volumetric flask bring uncertainty: the uncertainty brought by the volume container includes the following four sources:
Uncertainty introduced by the calibration error: 50 mL A grade volumetric flask error allowed
± 0.05 mL [1] rectangular distribution ( k= 3 ), 50 mL volumetric flask calibration introduced uncertainty:
1( volume50) 0.05 mL / 3 0.0288 mL
u V = = . (6)
Repeatability: filled 10 times to 50 mL volumetric flask in one experiments, the standard deviation 0.02 mL can be directly as uncertainty, namely: u2(Vvolume50) = 0.02 mL.
Uncertainty introduced by the temperature: the temperature range is ± 5°C, in the manual, water expansion coefficient is 2.1×10⁻⁴ mL °C-1, then 50 mL volumetric flask volume change were:
4
50 50 2.1 10 5 0.0525 mL
volume
V −
Δ = × × × = (7)
in the confidence level of 0.95, contains the factor K = 1.96, the uncertainty introduced by the temperature change:
3( volume50) 0.0525 mL / 1.96 0.0267 mL
u V = = . (8)
Uncertainty components caused by reading: relative standard uncertainty introduced from 50 mL volumetric flask:
3( volume50) 0.0525 mL / 1.96 0.0267 mL
u V = = . (9)
Simple processing introduced uncertainty [u(rep)]
Repeatable measurement introduced uncertainty the lysine content repeatable measurement results are shown in Table 1, the standard deviation obtained by Bessel formula:
2 1
( )
0.00133% 1
i i n x
x x
S
n
=
−
= =
−
∑
, (10)
repeatability uncertainty:
( ) x/ 0.00133 / 6 0.000542%
u rep =S n= = , (11)
0.000542%
( ) ( ) / 0.00185
0.2915%
rel
u rep =u rep R= = . (12)
Sample peak area measurement introduced uncertainty [u(As)]
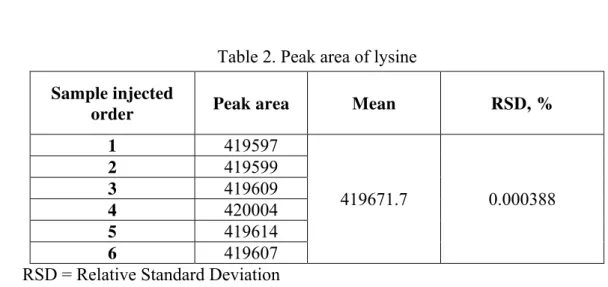
Generated uncertainty of peak area by repeated measurements
Because there is only 6 data in the Table 2, so use range method for evaluation referring to [6], in which n = 6, C = 2.53.
range A
difference coefficient R
u C
= ; Lysine: 160.869 0.000383
419671.7
A rel
u u
A
= = = . (13)
Table 2. Peak area of lysine
Sample injected
order Peak area Mean RSD, %
1 419597
419671.7 0.000388
2 419599
3 419609
4 420004
5 419614
6 419607
RSD = Relative Standard Deviation
Instrumental data processing system introduced uncertainty
Analysis based on the instrument manual and the general performance of integrator, so far, for liquid chromatograph peak area integration processing, the maximum error is from 0.2% to 1%, then the peak area relative uncertainty components:
0.01
0.00577 3
Area
u = = . (14)
The uncertainty cause by sample loading via micro-injector specially for liquid chromatography is up to 1%, so whose relative uncertainty:
0.01
0.00577 3
load
u = = . (15)
The uncertainty introduce by data-processing system:
2 2
0.0082
process Area load
u = u +u = . (16)
So, we can get the evaluation of the uncertainty introduced by sample peak area measurement:
2
( )
rel S process rel
u A = u +u2 . (17)
Lysine:
2 2
( ) 0.000383 0.0082 0.00820%
rel S
u A = + = ,
( )
0.00820%
( ) / 0.0281
0.2915%
rel S rep
u A =u R= = .
The nonlinear standard curve introduced uncertainty [u(line)]
The preparation concentration 0, 0.1, 0.2, 0.3, 0.4, 0.6 mL five lysine standard solutions, measured twice for each concentration. According to the measurement data using the least squares method to prepare standard working curve equation [6]: A = 71215.85c − 1.1837, correlation coefficient r = 0.9999. The standard deviation of the standard curve equation was calculated, i.e. residual standard deviation. The peak area measured values by instruments and that calculated according to the linear equation are all shown in Table 3.
Table 3. The results of residual calculation for standard curve
n Concentration C0j (mg/l)
Response value
A0j
Calculated value
a + bC0j
[A0j - ( a + bC0j)]2 C0j - C0 (C0j - C0 )2
1 0 0
0 -1.1837
1.4011
1.4011 -3.8986 15.1990
2 1.462 104116.2
104118.3 104116.389
0.03572
3.6519 -2.4366 5.9370
3 2.924 208234.1
208235.7 208233.961
0.01932
3.0241 -0.9746 0.9498
4 4.386 312351.7
312355.4 312351.534
0.02755
14.9459 0.4874 0.2375
5 5.848 416469.2
416467.3 416469.107
0.008649
3.2652 1.9494 3.8001
6 8.772 624704.2
624708.9 624704.252
0.002704
21.6039 4.8734 23.7500
0
C = 3.8986 ∑ 49.3871 ∑ 49.8734
Standard curve residual standard deviation
2 0 0 1 [ ( )] 3.513 mg/L 2 n j j j R
A a bC S n = − + = = −
∑
. (18)The uncertainty introduced by standard curve fitting:
2 0
2 0 0 1
2
1 1 ( )
( )
( )
3.513 1 1 (5.87185 3.8986)
0.0000282 mg/L,
71215.85 6 12 49.8734
R
n j j
S C C
u line
b p n
C C
=
−
= + + =
−
−
= + + =
∑
(19)where SR is residual standard deviation of standard curve (residual standard deviation);
b is slope; p is repeatable times for the measurement of samples; n is the points of standard curve; C is the mean of the sample concentration; C0 is the mean of the each points
concentration on standard curve; C0jis the concentration of each standard solution. So the
uncertainty introduce by standard curve:
( ) 0.0000282 mg/L
( ) 0.00000480
5.87185 mg/L
rel
u line u line
C
= = = . (20)
Composition uncertainty, expanded uncertainty and their results
expression
The above uncertainties are separated, so the composition relative uncertainty is:
[
] [
2] [
2] [
2] [
2]
50
2 2 2 2 2
( ) ( ) ( ) ( ) ( ) ( )
0.000947 0.00156 0.00185 0.0279 0.0000048 0.0282.
rel rel rel volume rel rel rel
u R = u m + u V + u rep + u As + u line
= + + + + =
2
=
=
(21)
Composition uncertainty:
( ) rel( ) 0.0282 0.2195% 0.00618%
u R =u R × =R × = (22)
in which, inclusion factor k = 2; so the expended uncertainty:
( ) 2 0.00614% 0.0123%
U =ku R = × = . (22)
Finally, the content of lysine expressed as following:
(0.2195 0.0123)%, 2
R= ± k .
Conclusion
As can be seen from the whole evaluation process of the uncertainty, when lysine in Xianyu 335 was determined by amino acids assay, whose uncertainty comes mainly from the sample peak area. So, the uncertainty introduced by the sample peak area is the largest component uncertainty. So, for the determination of lysine in corn Xianyu 335, the control of the instrument sensitivity could reduce the uncertainty components. To reduce this component is the efficient way to reduce the measurement uncertainty.
Acknowledgments
This work was supported by the Jilin Agricultural University Ph.D. Fund (201109).
90
References
1. Du Shuli, Zhangzhiqing, Xie Junyan, et al. (2006). JJG 196-2006 People's Republic of China National Metrological Verification Regulation of Working Glass Container, China Metrology Press, Beijing, China, 2-8, (in Chinese).
2. Ding Jingan, Huang Jian, Li Yong, et al. (2008). JJG 1036-2008 People's Republic of China National Metrological Verification Regulation for Electronic Balance, China Metrology Press, Beijing, China, 1-8, (in Chinese).
3. Zhao Min, Wu Fangdi, He Yajuan (2002). JJG 705-2002 People's Republic of China
National Metrological Verification Regulation of Liquid Chromatographs, China Metrology Press, Beijing, China, 1-15, (in Chinese).
4. Jia Jianbin, Zhao Xihe (2003). GB/T 5009. 124-2003 Determination of Amino Acids in Foods, China Standard Publishing House, Beijing, China, 115-119. (in Chinese)
5. Wei Hao, Qiao D. (2002). Guidance on Evaluating the Uncertainty in Chemical Analysis. China Metrology Press, Beijing, China, 100-129, (in Chinese).
6. Sha Dingguo (2003). Errors Analysis and Measurement Uncertainty Evaluation, China Metrology Publishing House, Beijing, China, 174-181, (in Chinese).
Assoc. Prof. Ying Chen, Ph.D.
E-mail: [email protected]
Mrs. Ying Chen, Ph.D., Associate professor, pursuing Instrumental Analysis and Biochemistry Research at Ginseng and Antler Products Centre of the Ministry of Agriculture PRC, Jilin Agricultural University, Changchun, China. Graduate from Jilin Agricultural in 2007. Research directions for effective components of traditional Chinese medicine analysis, proficient in instrument analysis, for example LC, GC, AA and so on.
Min Zhang, Ph.D.
E-mail: [email protected]
![Table 3. The results of residual calculation for standard curve n Concentration C 0j (mg/l) Response value A 0j Calculatedvalue a + bC0j [A 0j - ( a + bC 0j )] 2 C 0j - C 0 (C 0j - C 0 ) 2 1 0 0 0 -1.1837 1.4011 1.4011 -3.8986 15.1990 2 1](https://thumb-eu.123doks.com/thumbv2/123dok_br/17196873.242641/6.892.126.769.527.890/table-results-residual-calculation-standard-concentration-response-calculatedvalue.webp)
