Suppression of Adipocyte Differentiation by
Foenumoside B from
Lysimachia
foenum-graecum
Is Mediated by PPAR
γ
Antagonism
Hyun Jeong Kwak1‡, Hye-Eun Choi1‡, Jinsun Jang1, Soo Kyoung Park1, Byoung
Heon Cho2, Seul Ki Kim2, Sunyi Lee3, Nam Sook Kang4, Hyae Gyeong Cheon1,5*
1Department of Pharmacology, Gachon University School of Medicine, Incheon, Republic of Korea, 2Natural Substance Research Team, Pharmaceutical R&D center, Kolmar Korea Co. Ltd., Sejong, Republic of Korea,3Department of Systems Biology, Sookmyung Women’s University, Seoul, Republic of Korea, 4Graduate School of New Drug Discovery and Development, Chungnam National University, Daejeon, Republic of Korea,5Gachon Medical Research Institute, Gil Medical Center, Incheon, Republic of Korea
‡These authors are joint first authors on this work. *[email protected]
Abstract
Lysimachia foenum-graecumextract (LFE) and its active component foenumoside B (FSB) have been shown to inhibit adipocyte differentiation, but their mechanisms were poorly defined. Here, we investigated the molecular mechanisms responsible for their anti-adipo-genic effects. Both LFE and FSB inhibited the differentiation of 3T3-L1 preadipocytes induced by peroxisome proliferator-activated receptor-γ(PPARγ) agonists, accompanied by reductions in the expressions of the lipogenic genes aP2, CD36, and FAS. Moreover, LFE and FSB inhibited PPARγtransactivation activity with IC50s of 22.5μg/ml and 7.63μg/
ml, respectively, and showed selectivity against PPARαand PPARδ. Rosiglitazone-induced interaction between PPARγligand binding domain (LBD) and coactivator SRC-1 was blocked by LFE or FSB, whereas reduced NCoR-1 binding to PPARγby rosiglitazone was reversed in the presence of LFE or FSB.In vivoadministration of LFE into either ob/ob mice or KKAy mice reduced body weights, and levels of PPARγand C/EBPαin fat tissues. Furthermore, insulin resistance was ameliorated by LFE treatment, with reduced adipose tissue inflammation and hepatic steatosis. Thus, LFE and FSB were found to act as PPARγ
antagonists that improve insulin sensitivity and metabolic profiles. We propose that LFE and its active component FSB offer a new therapeutic strategy for metabolic disorders including obesity and insulin resistance.
Introduction
Lysimachia foenum-graecumextract (LFE) has been used as a traditional oriental medicine to treat various diseases, such as, colds, rheumatism, headaches, toothaches, and digestive
dys-functions [1,2]. However, the active component responsible for these wide ranging
pharmaco-logical properties has not been identified. Nevertheless, anti-oxidant effects have been
a11111
OPEN ACCESS
Citation:Kwak HJ, Choi H-E, Jang J, Park SK, Cho BH, Kim SK, et al. (2016) Suppression of Adipocyte Differentiation by Foenumoside B fromLysimachia foenum-graecumIs Mediated by PPARγAntagonism.
PLoS ONE 11(5): e0155432. doi:10.1371/journal. pone.0155432
Editor:Jonathan M Peterson, East Tennessee State University, UNITED STATES
Received:January 6, 2016
Accepted:April 28, 2016
Published:May 13, 2016
Copyright:© 2016 Kwak et al. This is an open access article distributed under the terms of the
Creative Commons Attribution License, which permits unrestricted use, distribution, and reproduction in any medium, provided the original author and source are credited.
Data Availability Statement:All relevant data are within the paper.
associated with phenolics and flavonoids in LFE, and one of its triterpene glycosides,
foenumo-side E has been reported to have anti-inflammatory effects [2]. Recently, LFE was found to
have anti-adipogenic effects by high throughput screening of natural product extract library, and FSB was found to be the active component responsible for the inhibitory effects of LFE
during adipocyte differentiation [3,4]. However, how FSB suppresses adipocyte differentiation
at the molecular level was not determined.
Adipocyte differentiation is critical for energy and endocrine homeostasis and is a
multi-step process that requires the strict control of several transcription factors [5–7]. Peroxisome
proliferator-activated receptor-γ(PPARγ) is a member of the nuclear receptor superfamily of
ligand-activated transcription factors, and regulates glucose and lipid homeostasis [8,9].
PPARγis also a master regulator of adipocyte differentiation, which is achieved by modulating
gene transcription resulting from the recruitments of various transcriptional coactivators and
corepressors. Moreover, specific interactions between these coactivators and PPARγcause
dif-ferential effects in response to a variety of their ligands. Members of the p160 family, such as,
steroid receptor coactivator-1 (SRC-1) [10], transcriptional intermediatory factor-2, and
TRAP/DRIP [11] are known to interact directly with PPARγ. On the other hand, nuclear
receptor corepressors such as NCoR downregulated PPARγ-mediated transcriptional activity
[12]. The other master regulator gene that determines adipocyte differentiation is C/EBPα
(CCAAT/enhancer-binding protein-α), which acts to maintain PPARγexpression and
pro-mote adipogenesis in association with PPARγ[13,14].
The PPARγagonists rosiglitazone and pioglitazone were developed as insulin sensitizers to
treat type 2 diabetes mellitus. However, when PPARγagonists were used clinically, unwanted
side effects, including weight gain, were reported, possibly because of the hyperactivation of
PPARγ[15,16]. In addition, PPARγagonists were associated with the development of hepatic
steatosis in rodents [17], whereas several PPARγantagonists were shown to ameliorate insulin
resistance and hepatic steatosis, accompanied by reduced body weights [18,19]. However, the
effects of PPARγactivation on insulin resistance produced inconsistent results. Heterozygous
PPARγdeficient mice display improved insulin resistance and dyslipidemia induced by a
high-fat diet, but body weights similar to mice on a normal diet [15,16,20]. On the contrary, gradual
reduction of PPARγas well as PPARγmutation resulted in insulin resistance, in association
with lipodystrophy [21,22]. Thus, the extent of PPARγactivation may produce differential
effects with regard to the treatment of metabolic disorders.
Based on previous findings that LFE and FSB exhibit anti-adipogenic effects, and that
PPARγplays a key role in adipocyte differentiation, we investigated whether PPARγ
antago-nism is responsible for the anti-adipogenic actions of LFE and FSB. We further extended our
research to examine thein vivoeffects of LFE using ob/ob mice and KKAy mice, both of which
are well-known models of metabolic diseases.
Materials and Methods
Chemicals
Dulbecco's modified Eagle's medium (DMEM) containing low or high glucose levels, fetal bovine serum (FBS), fetal calf serum (FCS), penicillin, and streptomycin were obtained from
GIBCO (Grand Island, NY). Antibodies against C/EBPα, PPARγ, andβ-actin were from Santa
Cruz Biotechnology (Santa Cruz, CA). The RNA extraction kit was from Intron Biotechnology
(Seoul, Korea). PPARγ, aP2, CD36, FAS, LPL, and GAPDH oligonucleotide primers were from
Bioneer Co. (Daejeon, Korea). Rosiglitazone, pioglitazone, GW0742, GW7647, protein inhibi-tor cocktail, phenylmethyl sulfonylfluoride, hematoxylin,eosin and all other chemicals were data collection and analysis, decision to publish, or
preparation of the manuscript.
from Sigma (St. Louis, MO). LFE and FSB were isolated fromLysimachia foenum-graecumas
previously described [3,4].
Animals
Male ob/ob mice (5 weeks old) were purchased from the Korea Research Institute of Bioscience and Biotechnology (Ochang, Korea). Male KKAy mice (5 weeks old) were purchased from CLEA (Tokyo, Japan). Animals were acclimated for one week and maintained under constant
conditions (temperature: 20 ± 2°C, humidity: 40–60%, light/dark cycle: 12 h) for 8 weeks or
more. For experiments, mice were divided into three groups (n = 10 each group): Group 1 (the control group) animals were treated with vehicle solution containing 0.5% CMC; Group 2 treated with LFE (100 mg/kg); Group 3 treated with LFE (300 mg/kg) by oral gavage once daily for 8 weeks. Body weights, food intake and blood glucose were measured weekly at the same time every week (between 10:00 and 11:00 AM) for 8 weeks. Food intake was determined by measuring the difference between the preweighed original amount of food and the weight of the food left in each cage (n = 5 in each cage). Blood glucose concentrations were determined in tail vein using Allmedicus Gluco Dr. Plus (Seoul, Korea) in fed state. All animal procedures were performed in accordance with the Guide for the Care and Use of Laboratory Animals published by the US National Institute of Health (NIH Publication No. 8523, revised 2011) and approved by the Animal Care and Use Committee of Gachon University.
Cell culture and adipocyte differentiation
The 3T3-L1 preadipocytes and HEK293T cells were obtained from the Korean Cell Line Bank (Seoul, Korea). Cells were grown in DMEM-high glucose (3T3-L1) or DMEM-low glucose (HEK293T) containing 10% heat-inactivated FBS, penicillin (100 units/ml) and streptomycin
sulfate (100μg/ml) in a humidified 5% CO2atmosphere at 37°C. To induce adipocyte
differen-tiation, 3T3-L1 cells were cultured until 100% confluent, and then maintained in culture medium for 2 days. Differentiation was induced by exposing cells to either rosiglitazone
(50μM) or pioglitazone (10μM) in DMEM containing 10% FBS and 1μg/ml insulin for 2 days
in the presence or absence of the indicated concentrations of LFE or FSB. Medium were then replaced with DMEM-high glucose without rosiglitazone or pioglitazone but in the presence or absence of LFE or FSB. Media were then changed every two days for 6 days.
Oil Red O staining
Differentiated 3T3-L1 cells were fixed with 10% formalin for 10 min and then stained with 0.3% Oil Red O/60% isopropanol solution for 20 min, which was then removed by washing with distilled water. Lipid droplets were visualized and images were captured by phase contrast microscopy. To quantify cellular triglyceride (TG) levels, stained cells were eluted with isopro-panol and OD values were determined using a Perkin Elmer VictorX4 (Waltham, MA) at 490 nm.
Western blot analysis
Cells were harvested in PRO-PREP™protein extraction solution (Intron Biotechnology) and
incubated for 30 min at 4°C. Cell debris was removed by microcentrifugation, and supernatants containing proteins were collected. Protein concentrations were determined using Bio-Rad
protein assay reagent, according to the manufacturer's instructions. Briefly, proteins (30μg)
solution (4% BSA) at 4°C, incubated overnight with a primary antibody against PPARγand C/
EBPα, washed four times with Tween 20/Tris-buffered saline (T-TBS), and incubated with
horseradish peroxidase-conjugated secondary antibody (1:1000) for 1 h at room temperature. Blots were then washed three times with T-TBS, and developed using an enhanced chemilumi-nescence kit (Amersham Life Science, Buckinghamshire, UK).
RNA Preparation and Real-time PCR
Total cellular RNA was isolated using Easy Blue1
kits (Intron Biotechnology). Oneμg of RNA
per sample was reverse transcribed using ReverTra Ace qPCR RT master mix (Toyobo, Japan). Quantitative real-time PCR (qPCR) was performed using incorporation of SYBR green
(Toyobo, Japan). The mouse primers used were as follows; PPARγ:50-CAT CCA AGA CAA
CCT GCT GC-30(F) and50-TGT GACGAT CTG CCT GAG GT-30(R), aP2:50-ATT TCC TTC AAA CTG GGC GT-30(F) and50-GGT CGA CTT TCC ATC CCA CT-30(R), CD36:50-ATG ACG TGG CAA AGA ACA GC T-30(F) and50-AAG GCT CAA AGA TGG CTC C-30(R), fatty
acid synthase (FAS):50-TAC TGC GAT TTC TCC TGG CTG-30(F) and50-AAC CAT AGG CGA
TTT CTG GG-30(R), lipoprotein lipase (LPL):50-CGC TCT CAG ATG CCC TAC AA-30(F)
and50-GAG AAA TCT CGA AGG CCT GG-30(R), IL-6:50-GAG GAT ACC ACT CCC AAC AGA
CC(F) and50-AAG TGC ATC ATC GTT GTT CAT AC(R), IL-1β:50-CAG GAT CAG GAC ATG
AGC ACC(F) and50-CTC TGC AGA CTC AAA CTC CAC(R), TNF-α:50-ATG AGC ACA GAA AGC ATG AT -30(F) and50-TAC AGG CTT GTC ACT CGA AT -30(R), iNOS:50-GGT GTT GAA GGC GTA GCT GA -30(F) and50-ATC ATG GAC CAC CAC ACA AGC -30(R),GAPDH:
50-TTC ACC ACC ATG GAG AAG GC-30(F) and50-GGC ATG GAC TGT GGT CAT GA-30(R).
The mRNA levels were determined using a Roche Light cycler 2.0 (Roche Bio Inc., Bazel, Swit-zerland). Results were expressed as ratios versus GAPDH.
Cell transactivation and mammalian two-hybrid assay
pFA-Gal4-PPARα-LBD, pFA-Gal4-PPARδ-LBD, pFA-Gal4-PPARγ-LBD and pM-SRC-1
plas-mids were kindly donated by Dr. Young Yang (Sookmyung Women’s University, Seoul,
Korea), and pBIND-NCoR-1 by Dr. Jerrold M. Olefsky (University of California, San Diego).
pVP-PPARγand pFR-Luc was kindly provided by Dr. Jung Hyeong Lee (Kangwon National
University, Chuncheon, Korea). HEK 293T cells (1.5×10⁵) were seeded in 12-well plates,
grown for 24 h, and then transiently co-transfected with pFA-Gal4-PPARα,β, orγLBD
expression vectors and pFR-Luc reporter vector using X-tremeGENE9 DNA transfection reagent (Roche Diagnostics, Mannheim, Germany), according to the manufacturer's instruc-tions. After 16 h of incubation, cells were treated with the indicated concentrations of LFE or
FSB in the presence of rosiglitazone (1μM), GW7647 (a PPARαagonist, 1μM) or GW0742 (a
PPARδagonist, 1μM) for 18 h. To perform two-hybrid assay, either coactivator pM-SRC-1
vector or corepressor pBind-NCoR-1 (aa 1803–2439), in the presence of pVP-hPPAR and
pFR-Luc reporter vectors, was transiently co-transfected into HEK293T cells using X-treme-GENE9 DNA transfection reagent. After 16 h of incubation, cells were treated with the
indi-cated concentrations of LFE or FSB in the presence or absence of rosiglitazone (1μM) for 18 h,
washed with cold-PBS, lysed, and then, luciferase activity was determined using the Dual lucif-erase assay system kit (Promega, Madison, WI).
Molecular docking study between FSB and PPAR
γ
LBD
The docking study using the released crystal complex structure (pdb id: 4Y292) of PPARγfrom
the RCSB protein databank was carried out. The protein was subjected to the“Prepare protein”
a receptor for the docking calculation. And then we defined the expanded binding site based
on the original ligand of 4Y29, having 16.77Åbinding sphere. To prepare the input molecules,
each conformation of FSB was confirmed by Cambridge structure data base (CSD;www.ccdc.
cam.ac.uk) and RCSB protein databank site, and then energy minimization was conducted
under CHARMm forcefield. Then FSB was docked into the binding site of the PPARγby the
CDOCKER protocol of Discovery Studio4.2. For flexible docking, we selected R357, K358, P359, F360, G361, D362, F363, M364 and E365 in Helix 11 and L452, L453, N454, V455, I456, K457, K458 in Helix 7 residues as flexible residues. Each of the docked conformations was eval-uated and ranked using the interaction energy.
Oral glucose tolerance test (OGTT) and insulin tolerance test (ITT)
OGTT and ITT were conducted after 8 weeks of LFE treatment. For OGTT, mice were fasted for 16 h (from 5:00 PM to 9:00 AM of next day, only water was supplied for all mice) prior to testing and then given an oral injection of d-glucose (2 g/kg). Blood glucose was measured by tail bleeds at the indicated time points for up to 120 min after glucose administration. After 3 days, ITT was done similarly, except the mice were fasted for only 4 h (from 9:00 AM to 1:00 PM, only water was supplied for all mice) and 0.75 IU/kg insulin (Sigma) was administered by
i.p. injection. Blood samples were taken from tail veins at the indicated times for up to 120 min
after insulin administration, and blood glucose levels were measured using an Allmedicus Gluco Dr. Plus (Seoul). The area under the curve (AUC) for glucose was calculated for the OGTT or ITT using software OriginPro 6.1 (Origin, Northampton, MA).
Histopathology
Liver tissues were fixed in 4% paraformaldehyde overnight and embedded in OCT solution. To
detect fat deposition, 10μm liver sections were rinsed with distilled water, stained with H&E or
0.3% Oil Red O in 60% isopropanol for 20 min at 37°C, rinsed with distilled water, and exam-ined under an optical microscope.
Biochemical analysis
Biochemical parameters were measured using tail blood samples. After centrifugation at 8,000 rpm at 4°C for 5 min, serum levels of TG, alanine aminotransferase (ALT), and aspartate trans-aminase (AST) were analyzed using commercial kits (Cayman Chemical, Ann Arbor, MI). Hepatic TG was extracted from whole liver homogenates using a modified Folch extraction
method [23]. Briefly, lipids were extracted from frozen liver tissues by thawing and
homogeniz-ing in a mixture of chloroform, isopropanol, and NP40 (7: 11: 0.1). The tissue homogenates were centrifuged (at 15,000 ×g, 10 min, 4°C) and the resulting supernatants (organic phase)
were subject to TG analysis using a kit according to the manufacturer’s instruction. Plasma
lev-els of TNF-α, IL-1βand IL-6 were measured using ELISA kits (Becton Dickinson, Franklin
Lakes, NJ).
Statistical analysis
Results are shown as the means ± SD. Groups were compared by one-way analysis of variance
(ANOVA) followed by Tukey’spost hoctest. P<0.05 was considered statistically significant.
Results
Effects of LFE and FSB on PPAR
γ
agonist-induced 3T3-L1
preadipocyte differentiation
To determine whether LFE is capable of blocking PPARγ-induced adipocyte differentiation,
3T3-L1 preadipocytes were differentiated in the presence of rosiglitazone (50μM) or
pioglita-zone (10μM), and the effects of LFE were examined. As shown inFig 1A, LFE (10μg/ml)
reduced accumulations of lipid droplets induced by both PPARγagonists, and this was
con-firmed by the reduced absorbance values of eluted Oil Red O solutions (65.3 ± 4.43% reduction in rosiglitazone-induced adipogenesis; 86.6 ± 1.21% reduction in pioglitazone-induced
adipo-genesis) (Fig 1B). At the same time, the mRNA expressions of PPARγtarget genes involved in
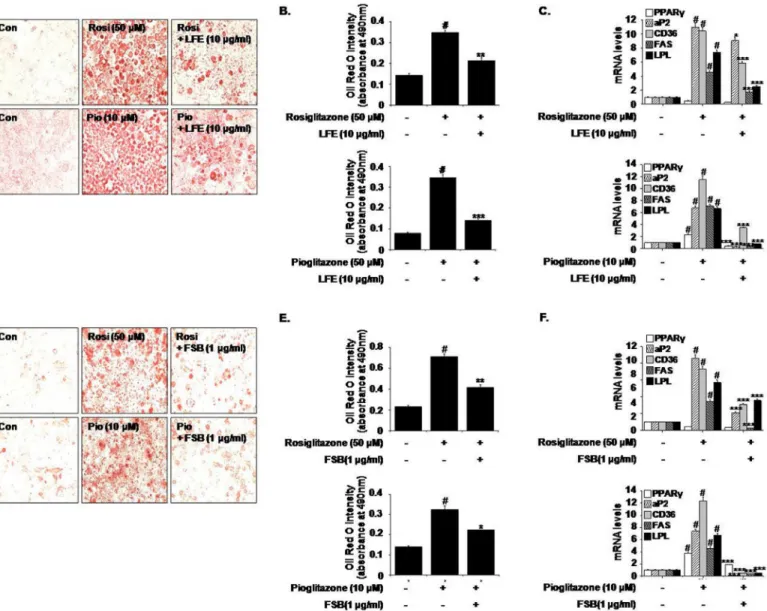
Fig 1. Effects of LFE or FSB on rosiglitazone- and pioglitazone-induced adipocyte differentiation.3T3-L1 cells were treated with rosiglitazone (50μM) or pioglitazone (10μM) in the presence or absence of LFE (10μg/ml, A-C) or FSB (1μg/ml, D-F). Six days after the induction of adipocyte differentiation, cells were stained with Oil Red O solution and visualized under an optical microscope (A and D). Absorbance at 490 nm of solutions eluted after Oil Red O staining was used to quantify the extent of adipocyte differentiation (B and E). The mRNA expressions of PPARγtarget genes were determined by qPCR (C and F). Experiments were repeated three times in triplicate, and results are presented as means±SDs. #P<0.05 vs. control; *P<0.05,**P<0.01,***P<0.001 vs. rosiglitazone or pioglitazone alone.
adiposity and fatty acid metabolism (aP2, CD36, FAS, and LPL), which were markedly
increased during PPARγ-induced adipogenesis, were downregulated by LFE as determined by
qPCR (Fig 1C), suggesting that LFE antagonizes PPARγactivation. FSB (1μg/ml) showed
simi-lar effects, that is, it inhibited PPARγ-induced adipocyte differentiation (66.3 ± 5.12%
reduc-tion in rosiglitazone-induced adipogenesis; 53.3 ± 2.53% reducreduc-tion in pioglitazone-induced
adipogenesis) (Fig 1D and 1E) and target gene expressions (Fig 1F). Neither LFE nor FSB had
any cytotoxic effect at the concentrations examined (data not shown).
Effects of LFE and FSB on PPAR
γ
transactivation
Next, we evaluated the effects of LFE and FSB on PPARγtransactivation activity to explore
their action mechanisms with respect to PPARγantagonism. HEK293T cells were
cotrans-fected with pFA-Gal4-PPARγ-LBD with pFR-Luc, and then incubated with different
concen-trations of LFE or FSB in the presence or absence of rosiglitazone (1μM). It was observed
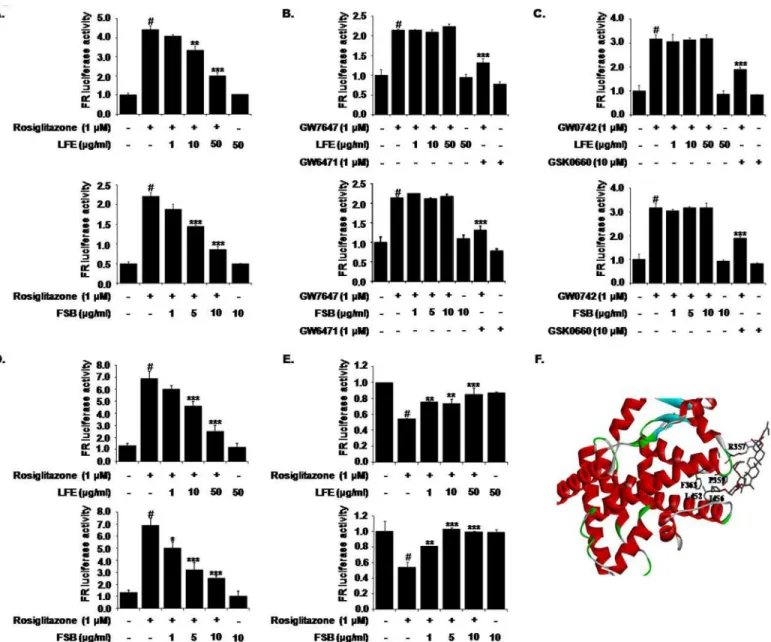
rosiglitazone induced PPARγtransactivation and that this activity was inhibited
concentra-tion-dependently by LFE or FSB (Fig 2A).
The IC50values of LFE and FSB were estimated to be 22.5μg/ml and 7.63μg/ml,
respec-tively, which are somewhat similar to previously reported IC50values (2.5μg/ml for LFE and
0.2μg/ml for FSB) as determined using an adipocyte differentiation assay [3,4]. In contrast to
their potent inhibition of PPARγtransactivation, neither LFE nor FSB had any inhibitory effect
on PPARα(Fig 2B) or PPARδtransactivation (Fig 2C). The selective PPARαantagonist
GW6471 (10μM) and the PPARδantagonist GSK0660 (10μM) were employed as positive
controls. These results show that LFE and FSB act as selective PPARγantagonists.
Effects of LFE and FSB on coactivator/corepressor recruitments
SRC-1 is a critical transcription coactivator of PPARγ, and it has been previously suggested its
interaction with PPARγcould be enhanced by the binding of rosiglitazone to PPARγLBD [10,
24]. To confirm the PPARγantagonistic activities of LFE and FSB, we used a mammalian
two-hybrid assay. HEK293T cells were co-transfected with pM-SRC-1, pVP-PPARγand pFR-Luc
as a reporter plasmid. As was expected, rosiglitazone enhanced the interaction between PPARγ
and SRC-1, and LFE or FSB efficiently antagonized rosiglitazone-stimulated recruitment of
SRC-1 to PPARγin a concentration-dependent manner (Fig 2D), further demonstrating the
antagonistic effects of LFE and FSB on PPARγ. The IC50values of LFE and FSB were estimated
to be 16.6μg/ml and 2.85μg/ml, respectively.
Previously, it was shown that recruitment of NCoR to PPARγwas reduced by PPARγ
ago-nists, and this reduction was reversed in the presence of PPARγantagonists, leading to the
sup-pression of PPARγtranscriptional activity [12]. As shown inFig 2E, addition of either LFE or
FSB increased the interaction of PPARγwith NCoR-1 (aa 1803–2439), further suggesting that
LFE and FSB act as PPARγantagonists.
Molecular docking study between FSB and PPAR
γ
To further validate the binding between PPARγand FSB, we carried out docking study by
CDOCKER [25] interfaced with DiscoveryStudio 4.2 using default parameter comparing with
4Y29 structure [26]. As shown inFig 2F, FSB bound to the PPARγLBD. The
((2S,6R)-6-methyl-6-methyltetrahydro-2H-pyran-2-yl)oxy group of FSB was positioned the hydrophobic pocket surrounded by side chains of F363, R357 and P359 in Helix 11, and L452 and I456 in Helix 7,
which indirectly contributes to the dynamics of AF-2 within PPARγLBD. Also, guanidium
group R357 formed hydrogen bonding with enoate group of FSB. These results are in agreement
In vivo
effects of LFE in ob/ob mice
To examine thein vivoeffects of LFE, we orally administrated LFE (100 or 300 mg/kg) to ob/
ob mice once daily for 8 weeks. Starting after 6 weeks of LFE treatment, decreased body weight gains were observed at 300 mg/kg compared with vehicle treatment (7.94 ± 1.54% reduction at
Fig 2. Effects of LFE or FSB on PPARγtransactivation activity and cofactor recruitment.HEK293T cells were transfected with pFA-Gal4-PPARγ-LBD and pFR-Luc reporter vector, and incubated with rosiglitazone (1μM) with or without LFE or FSB at different concentrations for 18 h.
Transactivation activities were assessed by measuring luminescence (A). The effects of LFE or FSB on PPARαand PPARδwere examined after cotransfecting HEK293T cells with pFA-Gal4-PPARα-LBD or pFA-Gal4-PPARδ-LBD. Transactivation was stimulated with the selective PPARαagonist GW7647 or the selective PPARδagonist GW0742; GW6741 (a selective antagonist of PPARα) and GSK0660 (a selective antagonist of PPARδ) were used as positive controls (B, C). To examine the profiles of cofactor recruitments, HEK293T cells were transiently cotransfected with either pM-SRC-1 (D) or pBind-NCoR-1 (E) together with pVP-PPARγand pFR-Luc using X-tremeGENE9 DNA transfection reagent. Cells were grown for 24 h in the presence or absence of rosiglitazone with LFE or FSB. The recruitments of the cofactor and corepressor are expressed as fold induction relative to luciferase activity. Experiments were repeated three times in triplicates, and results are presented as means±SDs. #P<0.05 vs. control;*P<0.05, **P<0.01,***P<0.001 vs. rosiglitazone alone. The binding mode of FSB on PPARγwas presented (F). FSB was represented gray elementary color.
The red line is the hydrogen binding between the side chain of R357 and FSB. The protein molecule is shown as ribbon cartoon except the interacting residues with FSB.
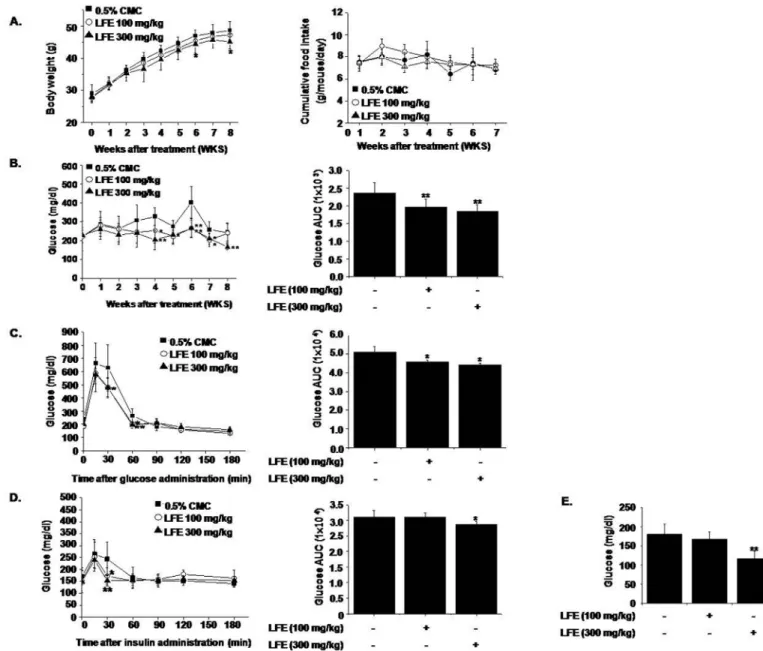
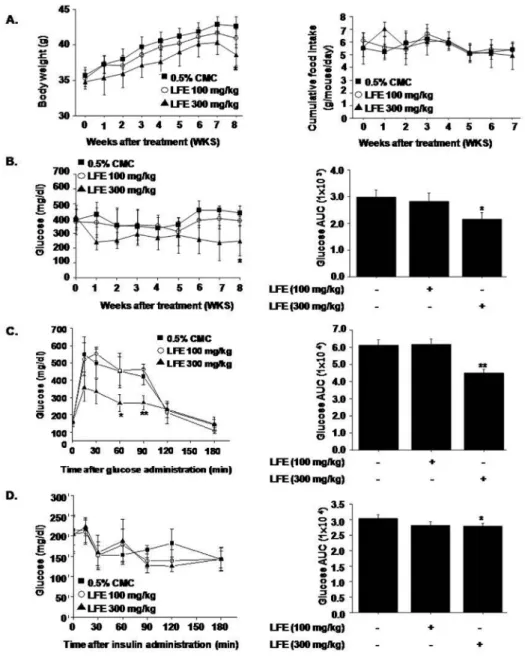
8 weeks), without significant changes in food intake (Fig 3A). As shown inFig 3B, LFE also lowered blood glucose levels as compared with vehicle controls (AUC analysis showed 21.9 ± 5.54% inhibition at 300 mg/kg LFE), in parallel with improved glucose intolerance as
determined by OGTT and ITT (Fig 3C and 3D). Based on AUC analysis of OGTT and ITT
curves, inhibition levels at 300 mg/kg LFE were 13.1 ± 1.54% and 7.71 ± 3.03%, respectively. Taken together, these results suggest that LFE improved insulin sensitivity in ob/ob mice and reduced body weight gain.
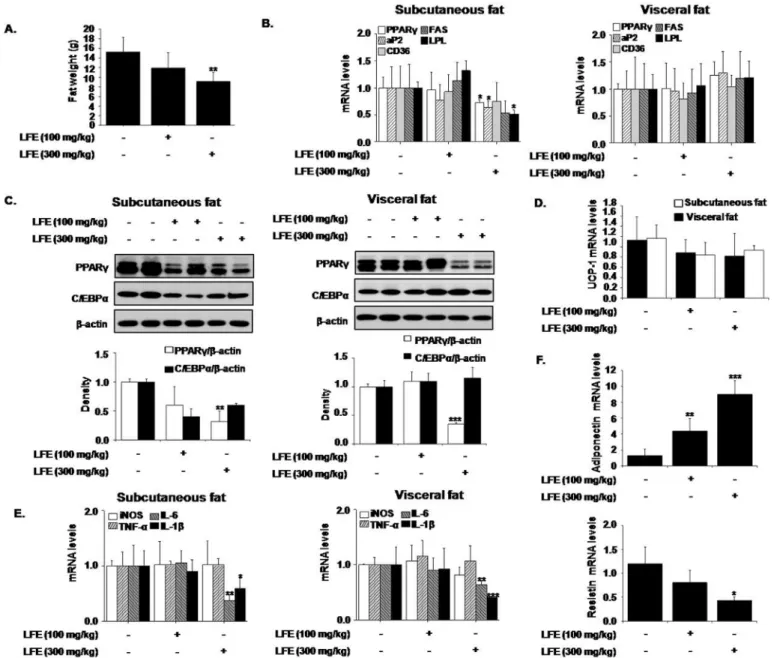
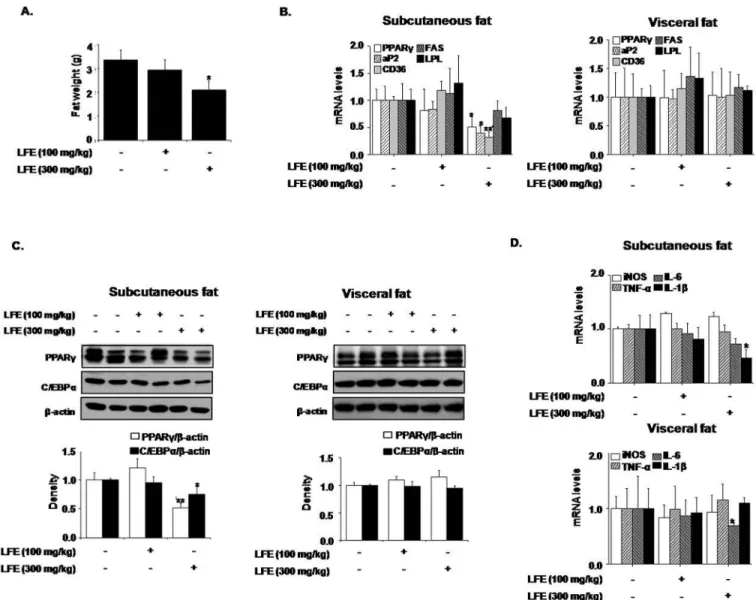
Next, we examined the effects of LFE on fat tissues isolated from different locations. Weights of subcutaneous and visceral fat tissues were significantly decreased by LFE
(59.4 ± 15.4% and 35.9 ± 12.7%, respectively, at 300 mg/kg LFE), and more prominent effects
Fig 3. In vivo effects of LFE on ob/ob mice.LFE (100 or 300 mg/kg; n = 10 per group) was orally administered once daily for 8 weeks to 6-week-old ob/ob mice. Body weights (A left), food intakes (A right), and plasma glucose levels (B) were measured weekly. After 8 weeks of treatment, OGTT (C) and ITT (D) were carried out. Fasting plasma glucose levels after 8 weeks treatment were measured (E). Experiments were repeated twice, and results are presented as means±SDs.*P<0.05,**P<0.01 vs. vehicle (0.05% CMC).
were observed in subcutaneous fat tissues (Fig 4A). However, no weight differences in other tis-sues, including reproductive tistis-sues, were detected. We also analyzed the mRNA levels of
PPARγtarget genes in subcutaneous and visceral adipose tissues. In agreement with ourin
vitroresults, the mRNA levels of PPARγ, aP2, and LPL in subcutaneous fats were significantly reduced by LFE at 300 mg/kg, and CD36 and FAS mRNA expressions were non-significantly
reduced. However, these mRNA expression reductions were not detected in visceral fat (Fig
4B). In addition, LFE treatment reduced the protein levels of PPARγand C/EBPα, which are
both well-known regulators of adipocyte differentiation in subcutaneous fat, but only PPARγ
Fig 4. Effects of LFE on fat tissues in ob/ob mice.After 8 weeks of LFE administration, total fat weights were measured (A). The mRNA
expressions of PPARγtarget genes were determined by qPCR in subcutaneous and visceral fats (B). The protein levels of PPARγand C/EBPαwere detected by western blotting of subcutaneous and visceral fats (C). The mRNA expressions of UCP-1 in subcutaneous and visceral fats were determined by qPCR (D). The mRNA levels of proinflammatory markers, adiponectin and resistin were determined by qPCR (E and F).*P<0.05, **P<0.01,***P<0.001 vs. vehicle (0.05% CMC).
levels decreased in visceral fat (Fig 4C). The expression of UCP-1, a well-known browning
marker was unaltered (Fig 4D), suggesting that weight loss by LFE is not likely related with
browning effect. Since chronic low-grade inflammation in adipose tissue plays a key role in the
development of insulin resistance [27], we examined the effects of LFE and FSB on adipose
tis-sue inflammation. LFE treatment into ob/ob mice reduced the mRNA expression of IL-6 and
IL-1βin subcutaneous and visceral fats (Fig 4E). In addition, mRNA expressions of resistin
decreased with increased adiponectin mRNA expression by LFE administration, further sup-ports the insulin sensitizing effects of LFE. Together these results indicated LFE reduced body
weight gains and improved glucose intolerance, possibly via PPARγantagonism, and that its
effects were more significant in subcutaneous adipose tissues.
In addition, we examined whether LFE had a beneficial effect on hepatic steatosis. LFE (300 mg/kg) lowered serum AST and ALT levels (by 28.9 ± 8.54% and 33.9 ± 9.35%, respectively)
and TG levels (by 52.1 ± 12.1%) (Fig 5A). Lipid accumulation in liver was also attenuated by
LFE as determined by H&E and Oil Red O staining (Fig 5B). The hepatic TG content was
Fig 5. Effects of LFE on hepatic steatosis in ob/ob mice.After 8 weeks of LFE administration, plasma levels of ALT and AST, and TG were determined using commercial kits (A). Liver tissues were frozen and tissue sections were stained with either H&E or Oil Red O, and visualized under an optical microscope (B). Hepatic TG contents were measured using commercial kit (C). Plasma levels of proinflammatory cytokines (IL-1β, IL-6, and TNF-α) were measured using ELISA kits (D). Hepatic mRNA levels of IL-1βand IL-6 were measured (E).*P<0.05,**P<0.01,***P<0.001 vs. vehicle (0.05% CMC).
significantly reduced by LFE treatment relative to vehicle control (by 35.4 ± 8.94% reduction at
300 mg/kg LFE) (Fig 5C). Since insulin resistance and metabolic dysfunction are closely related
to inflammatory status, we checked proinflammatory cytokine levels in plasma, and found
plasma levels of IL-1βand IL-6 were reduced by LFE treatment (300 mg/kg) (by 98.2 ± 12.0%
and 35.3 ± 8.96%, respectively) (Fig 5D). Moreover, hepatic mRNA levels of IL-1βand IL-6
were also reduced by LFE (300 mg/kg) (by 79.2 ± 8.18% and 27.1 ± 11.0%, respectively) (Fig
5E). These results are in agreement with previous reports of the anti-inflammatory effects of
LFE [2]. However, LFE had no effect on plasma TNF-α. Thus, it appears the anti-inflammatory
activities of LFE may also contribute to its beneficial effect on hepatic steatosis.
In vivo
effects of LFE in KKAy mice
To confirm the beneficial effects of LFE on metabolic disorders, we treated KKAy mice, a het-erozygote for the yellow spontaneous mutation (Ay) displaying hyperglycemia, hyperinsuline-mia, glucose intolerance, and obesity, with LFE for 8 weeks. The results obtained concurred with those observed in ob/ob mice. LFE (at 300 mg/kg daily) reduced body weight gain (9.46 ± 3.26%) and plasma glucose levels (27.5 ± 6.59%), and improved insulin resistance
(26.4 ± 3.52% reduction in OGTT AUC; 8.07 ± 2 69% reduction in ITT AUC) (Fig 6A–6D).
Consistent with the obtained results from ob/ob mice, mRNA levels of PPARγ, aP2, LPL, IL-6
and IL-1β, and protein levels of PPARγand C/EBPαwere reduced in subcutaneous fat by LFE
at this dosage (Fig 7A–7D). In particular, LFE treatment was found to markedly improve liver
dysfunction, as assessed by serum analysis (ALT, AST and TG levels) and microscopic
observa-tions after H&E and Oil Red O staining (Fig 8A and 8B). No obvious phenotype of fatty liver
was observed, in parallel with reduced hepatic TG content compared with vehicle treatment
although statistically insignificant (Fig 8C). Additionally, plasma levels of IL-1βand IL-6
(90.0 ± 18.2% and 30.1 ± 4.28% inhibition, respectively) as well as their hepatic mRNA levels (66.5 ± 6.23% and 24.9 ± 6.60% inhibition, respectively) were also reduced by LFE (300 mg/kg) (Fig 8D and 8E).
Discussion
Present study demonstrates that LFE and its active component FSB act as selective PPARγ
antagonists and reduce body weights and hepatic steatosis, and improve insulin resistance in ob/ob mice and KKAy mice. In particular, both suppressed the adipocyte differentiation of
3T3-L1 cells via selective PPARγantagonism but had little effect on PPARαor PPARδ.
Evi-dence that LFE and FSB are PPARγantagonists is based on the results of the PPARγ-driven
adipocyte differentiation and luciferase assay, and the mammalian two-hybrid assay, all
sup-port their key action mechanism involves selective PPARγantagonism.
PPARγis a master regulator of adipocyte differentiation, and its activation is necessary and
sufficient for adipogenesis. It has been shown the ectopic expression and activation of PPARγ
in fibroblasts are sufficient to induce an adipogenic response [28], and that PPARγis involved
in adipogenesisin vivoin genetically manipulated chimeric mice [29]. Furthermore, PPARγ
plays important roles in glucose and lipid homeostasis, and several PPARγagonists have been
developed to ameliorate imbalances in glucose and lipid metabolism [8,9]. However, increased
adipocyte differentiation leads to excessive TG accumulation, and chronic hyperactivation of
PPARγappears to be associated with increased body weight as has been reported for
rosiglita-zone [15,16]. Therefore, moderate degrees of PPARγblockade may provide better metabolic
profiles by reducing obesity. In support of this, partial inactivation of PPARγin PPARγ
hetero-zygotes was found to increase insulin sensitivity, and several pharmacological agents
In the present study, LFE and FSB suppressed the adipocyte differentiation of 3T3-L1 cells,
and their suppressive effects were associated with marked reductions in PPARγtarget genes,
such as, aP2, CD36, FAS, and LPL, which are all positively associated with adipogenesis. To
confirm the antagonistic effects of LFE and FSB on PPARγ, transactivation assays were
con-ducted in cells cotransfected with PPARγ-LBD plasmid and pFR-Luc reporter vector, and LFE
and FSB were observed to concentration dependently inhibit the rosiglitazone-induced
trans-activation of PPARγ. These results strongly indicate that the LFE- and FSB-induced
suppres-sions of adipocyte differentiation are mediated by PPARγantagonism. Similar inhibitory
Fig 6. In vivo effects of LFE on KKAy mice.LFE (100 mg/kg, 300 mg/kg; n = 10 per group) was administered once daily for 8 weeks to 6-week-old KKAy mice. Body weights (A left), food intakes (A right), and plasma glucose levels (B) were measured weekly. After 8 weeks of treatment, OGTT (C) and ITT (D) were carried out. Experiments were repeated twice, and results are presented as means±SDs.*P<0.05, **P<0.01 vs. vehicle (0.05% CMC).
effects on adipocyte differentiation have been reported for PPARγantagonists, such as,
BADGE and SR202 [19,30].
PPARγligand binding increases its affinity for a number of coactivators and facilitates
chro-matin remodeling and target gene transcription [31–33]. The cofactors that interact with
PPARγinclude SRC-1/NCoA1, TIF2/GRIP1/NCoA2/SRC-2, and pCIP/ACTR/AiB1/SRC-3,
and rosiglitazone and pioglitazone induce the recruitments of SRC-1, CBP or PGC-1αwhen
bound to PPARγ[34]. Hence, we further evaluated the recruitment of the representative
coacti-vator SRC-1 to PPARγLBD after rosiglitazone treatment. Results indicated that both LFE and
FSB antagonized the rosiglitazone-induced recruitment of SRC-1 to PPARγ. Further studies to
define the profiles of diverse coactivator recruitments would provide better understanding of the action mechanisms of LFE and FSB. In addition, LFE and FSB antagonized the suppressive
Fig 7. Effects of LFE on fat tissues in KKAy mice.After 8 weeks of LFE administration, total fat weights were measured (A). The mRNA expressions of PPARγtarget genes were determined by qPCR in subcutaneous and visceral fats (B). The protein levels of PPARγand C/EBPα were detected by western blotting of subcutaneous and visceral fats (C). The mRNA levels of proinflammatory markers were determined by qPCR in subcutaneous and visceral fats (D).*P<0.05,**P<0.01 vs. vehicle (0.05% CMC).
effects of rosiglitazone on the recruitment of corepressor NCoR-1 to PPARγ, further
support-ing that both act as PPARγantagonists [12].
Rosiglitazone, a PPARγagonist, produced potent insulin sensitizing effects, but at the
expense of increased body weight, whereas PPARγantagonists improve insulin sensitivity
without increasing body weight. In the present study, in ob/ob mice, LFE (at 300 mg/kg) not only reduced body weights but also improved glucose tolerance and insulin sensitivity without affecting food intake. Although total weight loss by LFE appears to be mild (~8% reduction), weight reduction is primarily attributed to fat reduction (~37% reduction of fat weights), with especially remarkable reductions in subcutaneous adipose tissue weights. These results suggest
LFE attenuates the expressions of PPARγand its downstream genes more specifically in
subcu-taneous adipose tissues. The explanation for the relatively selective action of LFE is unclear, but
it may be related with the previous findings that PPARγactivation induces increase in
subcuta-neous fat in human and rodent diabetic models [35,36]. Previous study on the quantitative
chemical analysis showed that the content of FSB, an active component of LFE was about 2.3%
Fig 8. Effects of LFE on hepatic steatosis in KKAy mice.After 8 weeks of LFE administration, plasma levels of ALT and AST, and TG were determined using commercial kits (A). Liver tissues were frozen and tissue sections were stained with H&E or Oil Red O, and examined under an optical microscope (B). Hepatic TG contents were measured using commercial kit (C). Plasma levels of proinflammatory cytokines (IL-1β, IL-6, and TNF-α) were measured using ELISA kits (D). Hepatic mRNA levels of IL-1βand IL-6 were measured (E).*P<0.05,**P<0.01,***P<0.001 vs. vehicle (0.05% CMC).
of LFE extract [37], and the effectivein vivodose in the present study (300 mg/kg)
approxi-mated to be 10 mg/kg of FSB, consistent with previous reports [3]. To delineate the mechanism
responsible for the glucose lowering effects of LFEin vivo, we examined the effects of LFE and
FSB on insulin-stimulated glucose uptake in fully differentiated 3T3-L1 adipocytes and in C2C12 differentiated myotubes, and LFE was found to increase insulin-stimulated glucose uptake in C2C12 myotubes, but not in 3T3-L1 adipocytes (results not shown). Further studies are needed to elucidate the reasons for these differential effects and to determine whether
PPARγantagonism by LFE is involved in increased glucose uptake.
Recent studies indicate that elevated adiposity is associated with increased plasma
pro-inflammatory cytokine levels [38–40], and insulin resistance is induced by chronic low grade
inflammation of adipose tissue, accompanied by infiltration of inflammatory macrophages
into adipose tissue [26]. On the other hand, weight loss is known to improve obesity-associated
metabolic disorders, particularly chronic low grade inflammation [41]. In the present study, we
found that LFE reduced proinflammatory cytokine levels, such as, IL-1βand IL-6, in plasma,
subcutaneous and visceral fats and liver tissues in ob/ob mice. Furthermore, oral LFE adminis-tration for 8 weeks had beneficial effects on hepatic steatosis in ob/ob mice as evidenced by reduced TG accumulation in livers and improved hepatic morphology, which suggests the inflammatory properties of LFE improve metabolic profiles. However, whether this
anti-inflammatory action is linked to PPARγantagonism needs to be determined. Interestingly, the
novel PPARγantagonist protopanaxatriol isolated from Panax ginseng improved liver steatosis
in ob/ob mice [18].
KKAy mice offer another animal model featuring hyperphagia with increased fat mass and
insulin resistance due to the presence of the yellow spontaneous mutation (Ay) [42]. LFE (at
300 mg/kg daily) suppressed body weight increases after 8 weeks of treatment, and this was paralleled by reductions in subcutaneous fat weights. Furthermore, improvement on glucose intolerance and insulin sensitivity as well as amelioration of hepatic steatosis was also observed. These results are comparable to those reported previously using high fat diet-induced obese
mice [4].
In conclusion, our results demonstrate that LFE and FSB both inhibit PPARγ-stimulated
adipocyte differentiation via PPARγantagonism, and have beneficial effects on body weight,
insulin resistance, and hepatic steatosis in ob/ob and KKAy mice. Although we identified
PPARγantagonism as being critical for the mode of action of FSB, additional mechanisms
might also be implicated in the anti-adipogenic effects of FSB. Collectively, our results show LFE and FSB are potential therapeutic agents for the treatment of obesity and metabolic diseases.
Author Contributions
Conceived and designed the experiments: HGC. Performed the experiments: HJK HEC JJ SKP NSK. Analyzed the data: HJK HEC HGC. Contributed reagents/materials/analysis tools: BHC SKK SL. Wrote the paper: HJK HGC.
References
1. Shen YH, Weng ZY, Zhao S, Zeng YQ, Ríos JL, Xiao WL et al. Five new triterpene glycosides from Lysimachia foenum-graecum and evaluation of their effect on the arachidonic acid metabolizing enzyme. Planta Med. 2005; 71: 770–775. PMID:16142644
3. Seo JB, Park SW, Choe SS, Jeong HW, Park JY, Choi EW et al. Foenumoside B from Lysimachia foe-num-graecum inhibits adipocyte differentiation and obesity induced by high-fat diet. Biochem. Biophys. Res. Commun. 2012; 417: 800–806. doi:10.1016/j.bbrc.2011.12.039PMID:22197824
4. Seo JB, Choe SS, Jeong HW, Park SW, Shin HJ, Choi SM et al. Anti-obesity effects of Lysimachia foe-num-graecum characterized by decreased adipogenesis and regulated lipid metabolism. Exp. Mol. Med. 2011; 43: 205–215. PMID:21389766
5. Farmer SR. Transcriptional control of adipocyte formation. Cell Meta. 2006; 4: 263–273.
6. Cristancho AG, Lazar MA. Forming functional fat: a growing understanding of adipocyte differentiation. Nat. Rev. Mol. Cell. Biol. 2011; 12: 722–734. doi:10.1038/nrm3198PMID:21952300
7. Siersbæk R, Nielsen R, Mandrup S. Transcriptional networks and chromatin remodeling controlling adi-pogenesis. Trends Endocrinol. Metab. 2012; 23: 56–64. doi:10.1016/j.tem.2011.10.001PMID:
22079269
8. Evans RM, Barish GD, Wang YX. PPARs and the complex journey to obesity. Nat. Med. 2004; 10: 355–361. PMID:15057233
9. Pakal R, Rha SW, Kuchulakanti PK, Cheneau E, Baffour R, Waksman R. Peroxisome proliferator-acti-vated receptor gamma; Its role in atherosclerosis and restenosis. Cardiovasc. Radiat. Med. 2004; 5: 44–48. PMID:15275632
10. DiRenzo J, Söderstrom M, Kurokawa R, Ogliastro MH, Ricote M, Ingrey S et al. Peroxisome prolifera-tor-activated receptors and retinoic acid receptors differentially control the interactions of retinoid X receptor heterodimers with ligands, coactivators, and corepressors. Mol. Cell. Biol. 1997; 17: 2166– 2176. PMID:9121466
11. Kang YK, Guermah M, Yuan CX, Roede RG. The TRAP/Mediator coactivator complex interacts directly with estrogen receptors alpha and beta through the TRAP220 subunit and directly enhances estrogen receptor function in vitro. Proc. Natl. Acad. Sci. U S A 2002; 99: 2642–2647. PMID:11867769
12. Yu C, Markan K, Temple KA, Deplewski D, Brady MJ, Cohen RN. The nuclear receptor corepressors NCoR and SMRT decrease peroxisome proliferator-activated receptorγtranscriptional activity and repress 3T3-L1 adipogenesis. J. Biol. Chem. 2005; 280: 13600–13605. PMID:15691842
13. Mukherjee R, Hoener PA, Jow L, Bilakovics J, Klausing K, Mais DE et al. A selective peroxisome prolif-erator-activated receptor-gamma (PPARgamma) modulator blocks adipocyte differentiation but stimu-lates glucose uptake in 3T3-L1 adipocytes. Mol. Endocrinol. 2000; 14: 1425–1433. PMID:10976920
14. Yeh WC, Bierer BE, McKnight SL. Rapamycin inhibits clonal expansion and adipogenic differentiation of 3T3-L1 cells. Proc. Natl. Acad. Sci. U S A 1995; 92: 11086–11090. PMID:7479942
15. Kubota N, Terauchi Y, Miki H, Tamemoto H, Yamauchi T, Komeda K et al. PPAR gamma mediates high-fat diet-induced adipocyte hypertrophy and insulin resistance. Mol. Cell 1999; 4: 597–609. PMID:
10549291
16. Miles PD, Barak Y, He W, Evans RM, Olefsky JM. Improved insulin-sensitivity in mice heterozygous for PPAR-gamma deficiency. J. Clin. Invest. 2000; 105: 287–292. PMID:10675354
17. Inoue M, Ohtake T, Motomura W, Takahashi N, Hosoki Y, Miyoshi S et al. Increased expression of PPARgamma in high fat diet-induced liver steatosis in mice. Biochem. Biophys. Res. Commun. 2005; 336: 215–222. PMID:16125673
18. Zhang Y, Yu L, Ca W, Fan S, Feng L, Ji G et al. Protopanaxatriol, a novel PPARgamma antagonist from Panax ginseng, alleviates steatosis in mice. Sci. Rep. 2014; 4: 1–12.
19. Rieusset J, Touri F, Michalik L, Escher P, Desvergne B, Nieso E et al. A new selective peroxisome pro-liferator-activated receptor gamma antagonist with antiobesity and antidiabetic activity. Mol. Endocrinol. 2002; 16: 2628–2644. PMID:12403851
20. Yamauchi T, Waki H, Kamon J, Murakami K, Motojima K, Komeda K et al. Inhibition of RXR and PPAR-gamma ameliorates diet-induced obesity and type 2 diabetes. J. Clin. Invest. 2001; 108: 1001–1013. PMID:11581301
21. Tsai YS, Tsai PJ, Jiang MJ, Chou TY, Pendse A, Kim HS et al. Decreased PPAR gamma expression compromises perigonadal-specific fat deposition and insulin sensitivity. Mol. Endocrinol. 2009; 23: 1787–1798. doi:10.1210/me.2009-0073PMID:19749155
22. Wernstedt Asterholm I, Tao C, Morley TS, Wang QA, Delgado-Lopez F, Wang ZV et al. Adipose inflam-mation is essential for healthy adipose tissue expansion and remodeling. Cell Metab. 2014; 20: 103– 118. doi:10.1016/j.cmet.2014.05.005PMID:24930973
23. Folch J, Lees M, Sloane Stanley GH. A simple method for the isolation and purification of total lipids from animal tissues. J. Biol. Chem. 1957; 226: 497–509. PMID:13428781
25. Wu G, Robertson DH, Brooks CL 3rd, Vieth M. Detailed analysis of grid-based molecular docking: A case study of CDOCKER—A CHARMm-based MD docking algorithm. J. Comp. Chem. 2003; 24: 1549–1562.
26. Zheng W, Qiu L, Wang R, Feng X, Han Y, Zhu Y et al. Selective targeting of PPARγby the natural prod-uct chelerythrine with a unique binding mode and improved antidiabetic potency. Sci. Rep. 2015; 5: 1– 12.
27. Olefsky JM, Glass CK. Macrophages, inflammation, and insulin resistance. Annu. Rev. Physiol. 2010; 72: 219–246. doi:10.1146/annurev-physiol-021909-135846PMID:20148674
28. Tontonoz P, Hu E, Spiegelman BM. Stimulation of adipogenesis in fibroblasts by PPAR gamma 2, a lipid-activated transcription factor. Cell 1994; 79: 1147–1156. PMID:8001151
29. Mortensen RM. PPAR gamma is required for the differentiation of adipose tissue in vivo and in vitro. Mol. Cell 1999; 4: 611–617. PMID:10549292
30. Wright HM, Clish CB, Mikami T, Hauser S, Yanagi K, Hiramatsu R et al. A synthetic antagonist for the peroxisome proliferator-activated receptor gamma inhibits adipocyte differentiation. J. Biol. Chem. 2000; 275: 1873–1877. PMID:10636887
31. Hermanson O, Glass CK, Rosenfeld MG. Nuclear receptor coregulators: multiple modes of modifica-tion. Trends Endocrinol. Metab. 2002; 13: 55–60. PMID:11854019
32. Westi S, Rosenfeld MG, Glass CK. Nuclear receptor coactivators. Adv. Pharmacol. 2000; 47: 89–112. PMID:10582085
33. Xu L, Glass CK, Rosenfeld MG. Coactivator and corepressor complexes in nuclear receptor function. Curr. Opin. Genet. Dev. 1999; 9: 140–147. PMID:10322133
34. Leo C, Chen JD. The SRC family of nuclear receptor coactivators. Gene 2000; 245: 1–11. PMID:
10713439
35. Okuno A, Tamemoto H, Tobe K, Ueki K, Mori Y, Iwamoto K et al. Troglitazone increases the number of small adipocytes without the changes of white adipose tissue mass in obese Zucker rats. J. Clin. Invest. 1998; 101: 1354–1361. PMID:9502777
36. Akazawa S, Sun F, Ito M, Kawasaki E, Eguchi K. Efficacy of troglitazone on body fat distribution in type 2 diabetes. Diabetes Care 2000; 23: 1067–1071. PMID:10937499
37. Um YR, Mok SY, Shin JH, Kim SK, Cho BH, Cho YB. Study on contents comparison of foenumoside B in different parts of Lysimachia foenum-graecum. Kor. J. Pharmacogn. 2014; 45: 88–92.
38. Olson NC, Callas PW, Hanley AJ, Fest A, Haffner SM, Wagenknecht LE et al. Circulating levels of TNF-alpha are associated with impaired glucose tolerance, increased insulin resistance, and ethnicity: the insulin resistance atherosclerosis study. J. Clin. Endocrinol. Metab. 2012; 97: 1032–1040. doi:10. 1210/jc.2011-2155PMID:22238388
39. Bose KS, Gupta SK, Vyas P. Adipocytokine levels in genetically high risk for type 2 diabetes in the Indian population: a cross-sectional study. Exp. Diabetes Res. 2012; 2012: 1–6.
40. Gelaye B, Revilla L, Lopez T, Suarez L, Sanchez SE, Hevner K et al. Association between insulin resis-tance and c-reactive protein among Peruvian adults. Diabetol. Metab. Syndr. 2010; 2: 30–37. doi:10. 1186/1758-5996-2-30PMID:20482756
41. Jellema A, Plat J, Mensink RP. Weight reduction, but not a moderate intake of fish oil, lowers concentra-tions of inflammatory markers and PAI-1 antigen in obese men during the fasting and postprandial state. Eur. J. Clin. Invest. 2004; 34: 766–773. PMID:15530150