by FAIRE-seq Reveals the Regulatory Role of the NFI
Family in Adipocyte Differentiation
Hironori Waki1,2., Masahiro Nakamura1., Toshimasa Yamauchi1.*, Ken-ichi Wakabayashi3., Jing Yu1 , Lisa Hirose-Yotsuya1, Kazumi Take1, Wei Sun1, Masato Iwabu1,4, Miki Okada-Iwabu1,5, Takanori Fujita3, Tomohisa Aoyama1, Shuichi Tsutsumi3, Kohjiro Ueki1, Tatsuhiko Kodama6, Juro Sakai7*, Hiroyuki Aburatani3*, Takashi Kadowaki1*
1Department of Diabetes and Metabolic Diseases, Graduate School of Medicine, University of Tokyo, Tokyo, Japan,2Functional Regulation of Adipocytes, Graduate School of Medicine, University of Tokyo, Tokyo, Japan,3Genome Science Division, Laboratory of Systems Biology and Medicine, Research Center for Advanced Science and Technology, University of Tokyo, Tokyo, Japan,4Department of Integrated Molecular Science on Metabolic Diseases, 22nd Century Medical and Research Center, University of Tokyo, Tokyo, Japan,5Molecular Medicinal Sciences on Metabolic Regulation, Graduate School of Medicine, University of Tokyo, Tokyo, Japan,6Systems Biology and Medicine Division, Laboratory of Systems Biology and Medicine, Research Center for Advanced Science and Technology, University of Tokyo, Tokyo, Japan,
7Metabolic Medicine Division, Laboratory of Systems Biology and Medicine, Research Center for Advanced Science and Technology, University of Tokyo, Tokyo, Japan
Abstract
Identification of regulatory elements within the genome is crucial for understanding the mechanisms that govern cell type– specific gene expression. We generated genome-wide maps of open chromatin sites in 3T3-L1 adipocytes (on day 0 and day 8 of differentiation) and NIH-3T3 fibroblasts using formaldehyde-assisted isolation of regulatory elements coupled with high-throughput sequencing (FAIRE-seq). FAIRE peaks at the promoter were associated with active transcription and histone modifications of H3K4me3 and H3K27ac. Non-promoter FAIRE peaks were characterized by H3K4me1+/me3-, the
signature of enhancers, and were largely located in distal regions. The non-promoter FAIRE peaks showed dynamic change during differentiation, while the promoter FAIRE peaks were relatively constant. Functionally, the adipocyte- and preadipocyte-specific non-promoter FAIRE peaks were, respectively, associated with genes up-regulated and down-regulated by differentiation. Genes highly up-down-regulated during differentiation were associated with multiple clustered adipocyte-specific FAIRE peaks. Among the adipocyte-specific FAIRE peaks, 45.3% and 11.7% overlapped binding sites for, respectively, PPARcand C/EBPa, the master regulators of adipocyte differentiation. Computational motif analyses of the adipocyte-specific FAIRE peaks revealed enrichment of a binding motif for nuclear family I (NFI) transcription factors. Indeed, ChIP assay showed that NFI occupy the adipocyte-specific FAIRE peaks and/or the PPARcbinding sites near PPARc, C/EBPa, and aP2 genes. Overexpression of NFIA in 3T3-L1 cells resulted in robust induction of these genes and lipid droplet formation without differentiation stimulus. Overexpression of dominant-negative NFIA or siRNA–mediated knockdown of NFIA or NFIB significantly suppressed both induction of genes and lipid accumulation during differentiation, suggesting a physiological function of these factors in the adipogenic program. Together, our study demonstrates the utility of FAIRE-seq in providing a global view of cell type–specific regulatory elements in the genome and in identifying transcriptional regulators of adipocyte differentiation.
Citation:Waki H, Nakamura M, Yamauchi T, Wakabayashi K-i, Yu J, et al. (2011) Global Mapping of Cell Type–Specific Open Chromatin by FAIRE-seq Reveals the Regulatory Role of the NFI Family in Adipocyte Differentiation. PLoS Genet 7(10): e1002311. doi:10.1371/journal.pgen.1002311
Editor:Jason D. Lieb, The University of North Carolina at Chapel Hill, United States of America
ReceivedApril 17, 2011;AcceptedAugust 9, 2011;PublishedOctober 20, 2011
Copyright:ß2011 Waki et al. This is an open-access article distributed under the terms of the Creative Commons Attribution License, which permits unrestricted use, distribution, and reproduction in any medium, provided the original author and source are credited.
Funding:This work was supported by a Grant-in-Aid for Young Scientists (B) from the Japan Society for the Promotion of Science (JSPS) (#20890055, #21790864, H Waki, http://www.jsps.go.jp/english/), funds from the Kanae Foundation for the Promotion of Medical Science (H Waki, http://kanae sanofi-aventis. c /en/index.html), Senri Life Science Foundation (H Waki, http://www.senri-life.or.jp/), Takeda Science Foundation (H Waki, http://www.takeda-sci.or.jp/), Japan Foundation for Applied Enzymology (H Waki, http://www.mt-pharma.co.jp/jfae/index.html), Sankyo Foundation of Life Science (H Waki, http://www. sankyo-fdn.or.jp/), Banyu Life Science Foundation International (H Waki, http://www.banyu-zaidan.or.jp/index.html), and by a Grants-in-Aid for Scientific Research (S) from the Ministry of Education, Culture, Sports, Science, and Technology (#20221009, H Aburatani, http://www.jsps.go.jp/english/), and Grant-in-Aid for Scientific Research on Innovative Areas (Research in a proposed research area) "Molecular Basis and Disorders of Control of Appetite and Fat Accumulation (to T Yamauchi), Funding Program for Next Generation World-Leading Researchers (NEXT Program) (to T Yamauchi). These institutions had no role in study design, data collection and analysis, decision to publish, or preparation of the manuscript.
Competing Interests:The authors have declared that no competing interests exist.
* E-mail: [email protected] (T Kadowaki); [email protected] (H Aburatani); [email protected] (J Sakai); [email protected] (T Yamauchi)
.These authors contributed equally to this work.
Introduction
Sequencing allowed identification and mapping of the human genome [1]. Transcriptional regulation of genes is essential for manifesting cellular phenotypes and complex biological processes.
Coordinated actions of transcription factors and cofactors on regulatory DNA sequences produce transcriptional activation of the eukaryotic gene. Therefore, identification and mapping of the genome’s regulatory elements is critical for understanding how cell-type-selective regulation of genes in the genome is achieved.
o.jp
Traditionally, regulatory elements have been identified by DNase I hypersensitivity assay combined with Southern blot analysis [2]. That assay coupled with microarray or high-throughput sequencing (DNase-Chip or DNase-seq) were effec-tively applied in genome-wide identification of open chromatin regions [3,4,5,6]. Lieb and his colleagues recently developed formaldehyde-assisted isolation of regulatory elements (FAIRE) as a simple procedure to isolate nucleosome-depleted DNA from chromatin [7,8]. FAIRE detects open chromatin structure much the way the DNase I hypersensitivity assay does [8,9]—but with advantages, like obviating the need for clean nuclei preparation and laborious enzyme titrations [7,8]. Coupled with high-throughput sequencing (FAIRE-seq), FAIRE allows unbiased identification of potential regulatory elements without requiring prior knowledge of (or about) binding factors. FAIRE-seq’s genome-wide detection of open chromatin genomic regions in human pancreatic islets was successfully used to determine a causal single nucleotide polymorphism in loci associated with type 2 diabetes development in genome-wide association studies [10].
The adipocyte is central in controlling energy balance and whole-body glucose and lipid homeostasis [11]. Advances in adipocyte research have shown that adipose tissue stores excess energy and secretes hormones and metabolites to communicate with other organs, maintaining systemic metabolic homeostasis [12]. Peroxisome proliferator-activated receptor gamma (PPARc; NR1C3) is both necessary [13,14,15] and sufficient [16] for adipocyte differentiation. Necessary for both development and maintenance of mature adipocytes, PPARcis crucial in systemic glucose and lipid homeostasis [13,14,15,17], and, importantly, is the molecular target of thiazolidinediones, widely prescribed for obese diabetics [18]. C/EBPa-b-dact with PPARc, forming the adipogenic transcription cascade [19]. C/EBPbanddare induced by adipogenic stimulus, inducing PPARc, which activates expression of C/EBPa, which binds and further activates expression of PPARc, providing a positive regulatory loop [11,20]. Genome-wide approaches now dissect the transcriptional
mechanisms of adipocyte differentiation. ChIP-chip or ChIP-seq studies of adipogenic regulators [21,22,23,24,25,26,27,28,29] have provided valuable mechanistic insights into adipogenic transcrip-tion never before gained by conventranscrip-tional experiments: New concepts include co-localization of PPARcand cell type–specific transcription factors [27], low conservation rate of PPARcbinding sites between murine and human adipocytes [28] and the role of C/EBPb as a pioneer factor that establishes ‘‘hot spots’’ where multiple adipogenic regulators cooperatively work in the very early stage of differentiation [6].
Our study took an unbiased approach to mapping adipocyte-specific regulatory elements in the genome by using FAIRE in 3T3-L1 adipocytes (on day 0 and day 8 of differentiation) and NIH-3T3 fibroblasts. We show that the FAIRE peaks contain regulatory elements such as promoters, enhancers and insulators, and that adipocyte-specific non-promoter FAIRE peaks are functionally linked to genes regulated during differentiation— about half these peaks being overlapped by PPARc. We show that highly regulated genes in adipocyte differentiation are associated with clusters of multiple adipocyte-specific non-promoter FAIRE peaks. Furthermore, because FAIRE does not require a prioi knowledge of bound transcription factors, we could employ computational motif analyses of DNA sequences from the adipocyte-specific FAIRE peaks in an unbiased manner and identify a motif for nuclear family I (NFI) transcription factors in addition to motifs for PPAR and C/EBPs. We show the functional role of NFIA and NFIB in adipocyte differentiation. We demonstrate the utility of FAIRE-seq both in providing a global view of cell type–specific cis-regulatory elements in the genome and identifying transcriptional regulators of adipocyte differenti-ation.
Results
Genome-Wide Profiling of Open Chromatin Regions in 3T3-L1 Adipocytes by FAIRE-seq
Regulatory elements in the genome are characterized by open chromatin structures accessible to regulatory factors [30]. To explore genome-wide changes in open chromatin conformation during adipocyte differentiation, we used FAIRE—a method of isolating genomic regions depleted of nucleosomes [7]—combined with high-throughput sequencing (FAIRE-seq) to identify open chromatin sites in the adipogenic cell line 3T3-L1 before (day 0) and after (day 8) differentiation and in NIH-3T3 fibroblasts, which cannot differentiate into adipocytes. This approach identified in the genome 37,781 FAIRE peaks in 3T3-L1 on day 0 and 26,611 on day 8, plus 36,111 in NIH-3T3 cells—all, with a false discovery rate of ,1024. By using ChIP-seq analyses, we also generated genome-wide maps of binding sites for PPARc, the master regulator of adipocyte differentiation, for RXRa, its heterodimer partner, for histone H3 lysine 4 trimethylation (H3K4me3), and for CCCTC-binding factor (CTCF) [31].
Figure 1 shows a representative map of results generated near Klf15and Pparg, both transcription factors up-regulated by differentiation, and both important in adipocyte differentiation [16,32]. Consistent with previous observations [10], 28% of the FAIRE peaks were detected near the transcription start sites (TSSs 6500 bp) of RefSeq genes [33] and are referred to as promoter FAIRE peaks (Figure S1A), while 72% were located outside known TSSs, and are referred to as non-promoter FAIRE peaks. Notably, only 8% of the non-promoter FAIRE peaks were located in a 25 kb proximal promoter region while the majority of non-promoter FAIRE peaks were located in introns and distal regions (Figure S1A). Average profiling revealed that a FAIRE signal, H3K4me3 Author Summary
and histone H3 lysine 27 acetylation (H3K27ac) were observed at TSSs of actively transcribed genes (Figure S1B and S1D). On the other hand, non-promoter FAIRE peaks were accompanied by monomodal enrichment of H3K4me1 and were devoid of H3K4me3 enrichment, a condition described as the signature of enhancers [34,35] (Figure S1D). CTCF binding sites are important in insulator function and high-order chromatin structure [31]. The CTCF binding sites in our study (day 0 or day 8) were largely overlapped by those in a study by Mikkelsen (day 0 or day 7) [28] (86.3% and 88.5%, respectively). CTCF binding accounted for
about one fifth of either the promoter or non-promoter FAIRE peaks (Figure 1 and Figure S1C). Collectively, these data suggest that the open chromatin sites identified by FAIRE-seq show characteristics of regulatory elements such as promoter, enhancer and insulator.
Analysis of Differentiation-Dependent Non-Promoter FAIRE Peaks
those peaks on day 0 and day 8 3T3-L1 cells and in NIH-3T3 cells were shared by all three groups (Figure 2A). In contrast, non-promoter FAIRE peaks showed dynamic change. The three
groups shared only 25%, 45%, and 26% of non-promoter FAIRE peaks in, respectively, day 0 and day 8 3T3-L1 cells and NIH-3T3 cells. This contrasts with an invariable biding pattern of CTCF in
Figure 2. Cell type– and differentiation-dependent FAIRE peaks.(A) Venn diagrams comparing the FAIRE peaks among L1 (day 0), 3T3-L1 (day 8) and NIH-3T3 at promoter (+/2500 bp from RefSeq TSS) and non-promoter regions. The promoter FAIRE peaks were relatively constant among the three cell groups while the non-promoter FAIRE peaks were highly variable. (B) The FAIRE peaks in 3T3-L1 (day 0 or day 8) were divided into tertiles by peak height and adipocyte- (red boxes) and preadipocyte-specific (green boxes) FAIRE peaks, and were defined as indicated. (C) A heat map showing enrichment of the adipocyte- and preadipocyte-specific FAIRE peaks in the vicinity (+/225 kb from TSS) of genes up-regulated or down-regulated during differentiation. The horizontal bars in the two right panels indicate each gene with Ad or pAd FAIRE peaks in the vicinity (+/ 225 kb from TSS). (D) Fractions of genes that were up-regulated (left) or down-regulated (right) more than two-fold during differentiation among genes that had the indicated number of adipocyte- (red), preadipocyte-specific (green) or invariant (blue) FAIRE peaks. (E) The number of the adipocyte- (red), preadipocyte-specific (green) or invariant (blue) FAIRE peaks associated with genes that were stratified by the ratio of the expression levels between preadipocytes and adipocytes. Each FAIRE peak was defined as associated with the nearest gene in analyses (D) and (E). (F) Ontology analysis by DAVID of genes associated (+/225 kb from TSS) with adipocyte-specific FAIRE peaks [13]. (G) Venn diagrams showing the numbers and overlap of the binding sites for PPARcand RXRain 3T3-L1, day 0 and day 8. (H, I) Fractions of the non-promoter FAIRE peaks that overlap PPARc
binding sites (day 8) (H) or C/EBPabinding sites (Schmidt et al., GSE27450 [86]) (I). PPARcand C/EBParepresented 45.3% and 11.7% of the adipocyte-specific FAIRE peaks (average of red bars).
the promoter regions; in 3T3-L1 cells, 89.5% of the non-promoter CTCF binding sites on day 0 overlapped those on day 8. What’s more, a significant proportion of the non-promoter FAIRE peaks were cell type–specific (Figure 2A), implying the role of non-promoter regulatory elements in cell type–specific transcriptional regulation. We divided the non-promoter FAIRE peaks in day 0 and day 8 3T3-L1 cells into tertiles by FAIRE signal intensity, and defined adipocyte- or preadipocyte-specific FAIRE peaks as indicated by red or green boxes in the 4-by-4 table in Figure 2B. By this definition, we judged each non-promoter FAIRE peak as adipocyte-specific, preadipocyte-specific or invariant (Figure 2B). Figure 1, Figures S2 and S3 show examples of adipocyte-specific non-promoter FAIRE peaks (indicated by asterisks) in loci near Klf15,Pparg,Cebpa[16,20],Mgll[36],Srebf1andcidec[37]—all of which are abundantly expressed in adipose tissue and induced during adipocyte differentiation (data not shown). Remarkably, multiple adipocyte-specific FAIRE peaks existed in the vicinity of these genes and included introns and downstream regions (Figure 1, Figures S2 and S3).
To determine whether non-promoter FAIRE peaks were functionally associated with cell type–specific gene expression, we analyzed the relationship between the presence of the adipocyte- or preadipocyte-specific non-promoter FAIRE peaks and the change in gene expression during adipocyte differentia-tion. Those FAIRE peaks were enriched in the vicinity of genes, expression levels of which were highly induced or suppressed during adipocyte differentiation (Figure 2C). Importantly, as the number of the adipocyte-specific FAIRE peaks associated with a gene increased, the fraction of up- or down-regulated genes increased or decreased, respectively (Figure 2D, red lines), while as the number of associated preadipocyte-specific FAIRE peaks increased, the fraction of up- or down-regulated genes decreased or increased, respectively (Figure 2D, green lines). Conversely, the more robust the induction of the expression level of a gene during adipocyte differentiation, the greater the numbers of adipocyte-specific FAIRE peaks associated with the gene (Figure 2E, red line). In contrast, the more robust the reduction of the expression levels of a gene during adipocyte differentiation, the greater the numbers of associated preadipocyte-specific FAIRE peaks that were associated (Figure 2E, green line). Invariant FAIRE peaks were associated specifically with neither up- nor down-regulated genes (Figure 2E, blue line). We next employed a gene ontology (GO) analysis tool (DAVID) [38] to determine what kind of biological processes were associated with genes bound by the adipocyte-specific FAIRE peaks. We found that biological processes (e.g., adipocyte differentiation) were significantly en-riched compared with the genomic background (Figure 2F). It was of interest that embryonic placenta development—for which PPARcis critical [13,14,15]—was enriched (Figure 2F). Together, these data highlight the role of the cell type–specific non-promoter open chromatin sites detected by FAIRE-seq in differentiation-dependent transcriptional regulation.
Analysis of Binding Sites for PPARc and RXRa in 3T3-L1 Adipocytes
PPARcis key regulator of adipocyte development [16,20]. To elucidate the contribution of PPARc to adipocyte-specific transcriptional regulation, we conducted ChIP-seq analyses using antibodies specific for either PPARc or RXRa [24] in 3T3-L1 adipocytes at 36 hours and day 8 after induction of differentiation. The number of PPARcbinding sites increased during differenti-ation while that of RXRabinding sites remained virtually constant (Figure 2G). Significant overlap between the PPARcand RXRa
binding sites was consistent with the heterodimer formation of
PPARc and RXRa [21,39] (Figure 2G). Microarray and GO analysis revealed that the PPARcbinding sites were enriched in the vicinity of genes up-regulated by adipocyte differentiation (Figure S4B) and the bound genes were associated with adipocyte differentiation and lipid metabolism (Figure S4C). Using MEME [40], we performed de novo motif analysis of genomic regions bound by PPARc, and found that the AGGTCA-n-AGGTCA (called DR-1) shown was the most over-represented one (E-value 1.36102055
) (Figure S4A). An extension AGT 59outside of DR-1 appeared to correspond to the direct interaction between the DNA and the hinge region between the DNA-binding domain and the ligand-binding domain [41].
As shown in genomic loci (Figure 1, Figures S2 and S3), a significant proportion of adipocyte-specific non-promoter FAIRE peaks overlapped the PPARc/RXRabinding sites. To determine the contribution of PPARc to the adipocyte-specific open chromatin regions, we calculated percent fractions of the FAIRE peaks that were stratified by FAIRE signal in 3T3-L1 on day 0 and day 8 (Figure 2B) —and that overlapped either the PPARc
binding sites (Figure 2G) or C/EBPa binding sites in 3T3-L1 reported by Schmidt et al. [42]. Both PPARc and C/EBPa
binding sites were enriched in the fractions of adipocyte-specific FAIRE peaks (Figure 2H and 2I), and they respectively accounted for 45.3% and 11.7% of the adipocyte-specific FAIRE peaks (averages of the red bars in Figure 2H and 2I). These data support the role of PPARcand C/EBPaas primary transcription factors that drive adipocyte-specific gene expression—although they may not explain all of it.
Clustering of Multiple Adipocyte-Specific Non-Promoter FAIRE Peaks and the PPARcBinding Sites
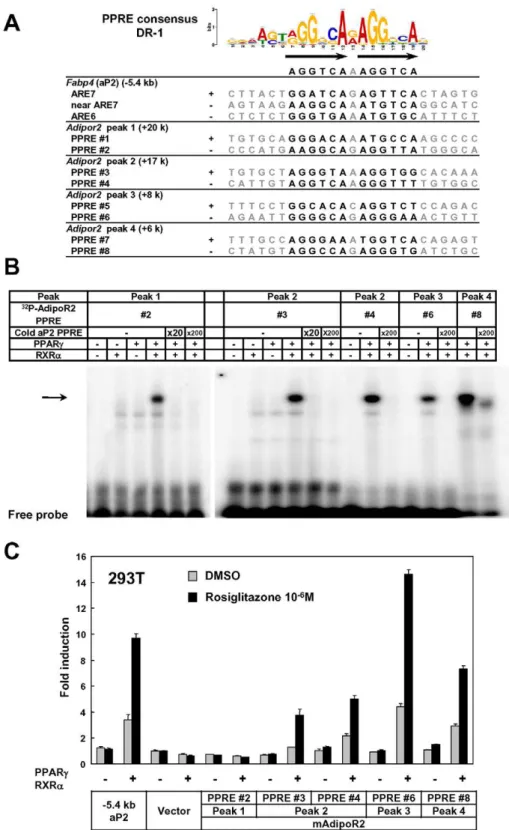
Genes that were highly induced by adipocyte differentiation often harbored multiple adipocyte-specific FAIRE peaks and/or PPARcbinding sites in their vicinity, as suggested by the linear correlation between the number of the associated adipocyte-specific FAIRE peaks and the robustness of the induction of the gene by adipocyte differentiation (Figure 2D and 2E). (See Figure 1, Figures S2 and S3 for representative genes.) To determine whether these multiple regions have functional regulatory elements, we selected AdipoR2 [43,44]. Although AdipoR2 was regulated by PPARcand PPARa([45] and data not shown), conventional22 kb promoter studies failed to identify the response element [46]. Our ChIP-seq analysis revealed a cluster of multiple PPARc/RXRabinding sites in the intron 1, downstream of the TSS of AdipoR2 (Figure S2B, arrow heads). We identified putative DR-1 motifs in these biding sites (Figure 3A) and tested them by gel-shift assay and luciferase assay. These motifs were indeed bound by the PPARc/RXRa heterodimer, and were functional in the luciferase assay (Figure 3B and 3C), suggesting the functionality of these elements and the advantage of a genome-wide approach over the conventional ‘‘promoter-bashing’’ ap-proach to identifying such response elements.
Figure 3. Identification of functional regulatory elements in the intron 1 ofAdipor2.The PPARcbinding sites in theAdipor2gene locus (Figure S2B, arrow heads) were analyzed. (A) Putative DR-1 motifs (PPAR response elements or PPREs) in the regions. ARE6 and ARE7 in the25.4 kb promoter upstream ofFabp4(aP2) were previously identified PPREs [87]. (B) Gel shift assay showing binding of the PPARc/RXR heterodimer to the motifs. An arrow indicates the PPARc/RXRaheterodimer bound by radiolabeled probe. Competition by cold oligos showed the specificity of the binding. (C) Luciferase reporter assay in HEK293T cells. Most of the motifs inserted into reporter vectors with the tk minimal promoter responded to over-expressed PPARc/RXRaand stimulation with its synthetic ligand, rosiglitazone. The25.4 kb promoter of PPARctarget geneFabp4(aP2) [84] was included as a positive control.
significantly higher number of clusters in a window size raging from 800 bp to ,30 kb. Similar results were obtained for the adipocyte-specific FAIRE peaks (Figure 4A and 4B).
On the other hand, multiple genes involved in adipocyte function [55,56,57] were often co-regulated in certain genomic regions that harbor clusters of adipocyte-specific regulatory elements (see Figure S2C, Figure 4C, and Figure S5). We therefore statistically tested—method in reference [50]—to see if neighboring genes tended to be co-regulated during adipocyte differentiation, and found that neighbors of highly induced genes (.10 fold) were indeed more likely to be up-regulated over three fold (18%, or 112 of 618 neighbors) than the 2,012 of 21,343 total genes (9%) that were up-regulated over three fold (P = 1.26610212, one-sided Fisher test). Neighbors of randomly selected genes were not significantly up-regulated (p =20.67, average of 1,000 trials, Figure 4D). Together, these data suggest that the transcriptional regulation of genes during adipocyte differentiation involves multiple adipocyte-specific regulatory elements—which tend to
form clusters—and that co-regulation of neighboring genes often occurs during adipocyte differentiation.
Sequence Motif Analyses of DNA Sequences of the Adipocyte-Specific Non-Promoter FAIRE Peaks
Next, we performed enrichment analyses of known motifs using AME in the MEME suite and the TRANSFAC [51] and JASPER [52] motif databases to identify motifs enriched in either adipocyte- or preadipocyte-specific FAIRE peaks compared with the background (statistical values shown as corrected p-value in Figure 5). We also determined the enrichment ratio (Ad/pAd) by calculating the ratio of occurrence of a motif in the adipocyte-specific FAIRE peaks and in the preadipocyte-adipocyte-specific FAIRE peaks as described in reference [28]. Using both parameters, we obtained motifs that had been significantly enriched in either kind of FAIRE peak and that occurred in significantly different number. Figure 5 shows the top of the list of TRANSFAC motifs enriched in the adipocyte- and preadipocyte-specific FAIRE Figure 4. Statistical analyses for clustering of adipocyte-specific FAIRE peaks and PPARc binding sites and co-regulation of neighbor genes during adipogenesis.(A) Histogram showing distribution of intervals (defined as distances to the nearest neighbor sites) among all PPARcpeaks (left) and among the adipocyte-specific FAIRE peaks (right). Note that there was increased occurrence of sites separated by short intervals (indicated by asterisks). See [48] for details of the method. (B) Clustering analysis of the PPARcbinding sites and the adipocyte-specific FAIRE peaks by counting the total number of clusters (defined as more than two peaks) determined for windows with indicated width. The PPARcbinding site or adipocyte-specific FAIRE peak clusters occurred more frequently in the observed data set than in random data with the same number of sites. The difference in the number of clusters was observed at window sizes ranging from 800 bp to 30,100 kb compared with the random sample. See reference [47] for details of the method. (C) Microarray analysis showing bothSlc2a4 (Glut4)andYbx2included in the adipocyte-specific FAIRE peak cluster (Figure S2C) co-regulated during differentiation. (D) Neighbors of highly induced genes (.10 fold) were more likely to be up-regulated over three fold (18%, or 112 of 618 neighbors) than the 2,012 of 21,343 total genes (9%) that were up-regulated over three fold (p = 1.26610212, one-sided Fisher test). Neighbors of randomly selected genes were not significantly up-regulated (p =20.67, average of 1,000 trials). See reference [50] for method.
peaks. The motifs for PPARc(and other DR1 motifs) and C/EBPs were among the list, consistent with their critical roles in adipogenic transcription. Motif analyses using the JASPER motif database showed enrichment of the motifs for PPARc, C/EBPs and the motif for Zfp423, a recently identified adipogenic regulator [53] (Figure S6). Motif analyses of the preadipocyte-specific FAIRE peaks showed significant enrichment of a motif for AP-1, a downstream transcription factor complex of the growth factor/MAP kinase signaling pathways, which include epidermal growth factor and c-Jun N-terminal kinases, known inhibitors of adipogenesis [54,55] (Figure 5 and Figure S6). We also performed de novo motif analysis (MEME) [40] of the adipocyte-specific FAIRE peaks, and observed significant enrichment of motifs that corresponded to those for PPARc and C/EBPs (Figure S7). Together, these instances of enrichment of known regulators indicate the validity of this approach.
Identification of NFI Family Transcription Factors as Novel Regulators of Adipocyte Differentiation
There were several other motifs for transcription factors, their functions not previously linked to adipocyte differentiation
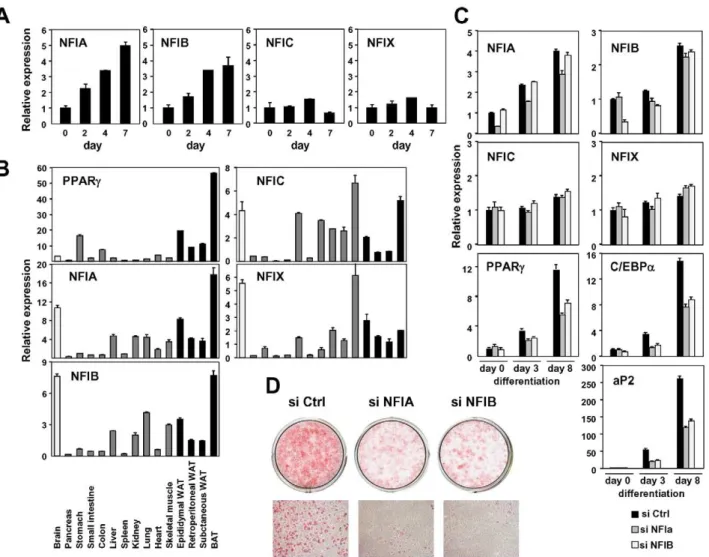
(Figure 5, Figures S6 and S7). We focused on a motif for the NFI family transcription factors. The murine NFI family consists of NFIA, NFIB, NFIC and NFIX, and was identified as a site-specific DNA-binding protein that bound to the adenovirus origin of replication [56]. It forms a dimer to bind to the symmetric consensus sequence TTGGC(N5)GCCAA [57]. We first exam-ined the expression change of these factors in in vitro adipocyte differentiation and found that the expression of NFIA and NFIB were significantly induced during differentiation of 3T3-L1 and of another adipogenic cell line, 3T3-F442A (Figure 6A and 6C). Consistent with this pattern, both NFIA and NFIB were highly expressed in a variety of adipose tissue depots in addition to the brain (Figure 6B). We next examined the effect of siRNA knockdown of NFIA and NFIB on adipogenic gene regulation and adipocyte differentiation (Figure 6C). Interestingly, induction of the expression of the adipogenic transcription factors PPARc
and C/EBPa and of downstream genes was significantly suppressed by siRNA knockdown of either NFIA or NFIB (Figure 6C). Consistent with the gene expression change, we observed significant reduction of lipid accumulation as judged by oil red O staining, suggesting physiological roles for NFIA and Figure 5. Known motif enrichment analysis of adipocyte- or preadipocyte-specific FAIRE peaks (TRANSFAC motifs).Enrichment analysis of the adipocyte- (left) and the preadipocyte-specific (right) FAIRE peaks for known motifs in the TRANSFAC database (Release 2010.4) performed by using AME in the MEME suite. After removing repeat regions with RepeatMasker [83], DNA sequences from the center 150 bp regions of the top 2,000 cell type–specific FAIRE peaks were analyzed (p-value report threshold : 0.05). Motif enrichment ratios (Ad/pAd FAIRE) for motifs in the TRANSFAC database were also determined by a method described in reference [28]. Motifs with an enrichment ratio greater than 1.20 (for the adipocyte-specific FAIRE peaks, left) or less than 0.833 (for the preadipocyte-specific FAIRE peaks, right) are shown in the table. See ‘‘Materials and Methods’’ for details.
NFIB in adipocyte differentiation (Figure 6D). We confirmed the effect of NFIA and NFIB knockdown on adipogenesis by using independent pooled siRNA (Figure S8).
We next asked whether overexpression of these factors influence adipocyte differentiation. We amplified NFIA and NFIB coding sequences from cDNA prepared from adipocytes, and cloned them into retroviral pMXs-puro vectors. We also made a dominant negative NFIA that lacks the C-terminal transactivation/repres-sion domain (NFIA-DN) [58]. Overexprestransactivation/repres-sion of NFIA—but not NFIA-DN or NFIB—resulted in robust induction of PPARc, C/ EBPa and aP2 (Figure 7A) at a basal state. Surprisingly, the induction of these factors was robust enough to make the cells to form lipid droplets visible and stainable by oil red O even before initiation of differentiation by the DMI (dexamethasone, IBMX and insulin) treatment (Figure 7B and 7C). However, after the DMI treatment, NFIA-expressing cells were overtaken by control cells, and on day 7, NFIA and NFIB overexpressing cells showed attenuated differentiation (Figure 7D and 7E). We speculate that this was caused by secondary effects of overly strong overexpression
levels (.30 fold, Figure 7A). Almost complete suppression of adipogenesis by NFIA-DN overexpression was consistent with the results of knockdown experiments (Figure 6, Figure 7D and 7E). Nevertheless, the robust induction of PPARc, C/EBPaand aP2 by NFIA overexpression at the basal state implies direct action of NFIA on transcriptional control of these factors.
To dissect the mechanism by which NFIs regulate PPARc, C/ EBPa and aP2, we examined DNA sequences of the adipocyte-specific FAIRE peaks and/or the PPARc binding sites in the vicinity of these factors and found that some of them have NFI binding motifs as listed in Figure 8A. ChIP analysis using an anti-NFI antibody confirmed actual binding of anti-NFI to these sites (Figure 8B and 8C). We extended this experiment by counting NFI motifs in the FAIRE peaks on a genome-wide scale. Interestingly, percent fractions of genes harboring NFI binding motifs in the FAIRE peaks were higher when the genes were bound by PPARc
and induced during differentiation (Figure 8D), indicating a significant degree of specificity for the NFI’s action on the adipogenic transcriptional program.
Figure 6. NFIA and NFIB are novel regulators of adipocyte differentiation.(A) Transcriptional regulation of NFI transcription factors during adipocyte differentiation (3T3-F442A). (B) Tissue distribution of the NFI family genes. Expression levels relative to 36B4 in various tissues were determined by qPCR. (C, D) Effects of siRNA-mediated knockdown of NFIA and NFIB on adipogenic gene expression (C) and lipid accumulation in 3T3-L1 adipocytes judged by oil red O staining (D). Knockdown of either NFIA or NFIB resulted in suppression of the induction of PPARc, C/EBPaand the PPARctarget gene, aP2, as well as increase in lipid accumulation during adipocyte differentiation.
Collectively, we demonstrated that the combination of FAIRE-seq and computational motif analyses is useful in identifying novel regulators of adipocyte differentiation.
Comparison of FAIRE Peaks between Undifferentiated 3T3-L1 and NIH-3T3 Cells
The 3T3-L1 adipogenic cell line was established by isolating clonal sublines of mouse fibroblast line 3T3 [59]. Lastly, we compared FAIRE peaks between ‘undifferentiated’ 3T3-L1 and NIH-3T3 cells. As shown in Figure 2A, a substantial proportion of FAIRE peaks was unique to either 3T3-L1 or NIH-3T3 cells. We defined non-promoter FAIRE peaks as specific to 3T3-L1and NIH-3T3—as we did for the adipocyte- or preadipocyte-specific FAIRE peaks in Figure 2B. The 3T3-L1- or NIH-3T3-specific FAIRE peaks were enriched in the vicinity of genes whose expression levels were higher in 3T3-L1 or NIH-3T3, respectively (Figure S9A). Motif analysis of the 3T3-L1-specific FAIRE peaks showed that the binding motif for EBF (Figure S9B) had the highest enrichment ratio (1.81) and a statistically significant p-value of 3.9E-3. Although the p-p-value of the motif for PPARc/
RXR did not reach statistical significance, that motif had an enrichment ratio of 1.84. These two factors were among the handful that were proven to transform NIH-3T3 cells into adipocytes when ectopically introduced [16,60].
Discussion
We demonstrated that genome-wide mapping of open chroma-tin regions by FAIRE-seq is a simple, accurate method that allows a snapshot view of regulatory elements in the genome. Although open chromatin regions detected by FAIRE-seq include promoters of transcribed genes, enhancers and insulators, open chromatin regions that vary in two different conditions likely contain regulatory elements that play roles in the specific biological process. By comparing open chromatin regions in preadipocytes and adipocytes, we identified the adipocyte- and preadipocyte-specific FAIRE peaks in the genome. Functionally, we demon-strated that the adipocyte-specific FAIRE peaks were associated with genes up- regulated by adipogenesis while the preadipocyte-specific FAIRE peaks were associated with genes down-regulated by adipogenesis (Figure 2C, 2D and 2E). Adipocyte gene Figure 7. Overexpression of NFIA, NFIB, and dominant negative NFIA in 3T3-L1 cells.(A) Expression analysis of overexpressed NFI factors (upper panel) and adipogenic PPARc, C/EBPaand aP2 (lower panel). Note, overexperssion of NFIA resulted in a robust induction of adipogenic factors. (B) Microscopic pictures of 3T3-L1 cells overexpressing NFI factors at confluence stained by oil red O (day 0). (C) Close examination of NFIA-overexpressing cells revealed formation of lipid droplets without adipogenic stimulus before differentiation. (D) Time course of expression levels of PPARc, C/EBPaand aP2 during differentiation. Note, the induction of these genes by NFIA overexpression was overtaken by that of control cells, and on day 7, NFIA and NFIB overexpressing cells showed attenuated differentiation. Dominant negative NFIA showed almost complete suppression. (E) Oil red O staining of 3T3-L1 overexpressing NFI factors on day 7.
expression appears mediated through multiple regulatory elements distal to transcription start sites (TSSs): greater induction of gene expression by differentiation means greater likelihood that more adipocyte-specific FAIRE peaks are associated with the gene (Figure 2D and 2E). This implies that optimal gene transcriptional regulation may require coordinated actions of multiple regulatory elements. Therefore, although valuable and informative, the proximal promoter assay may not always be sufficient (e.g., AdipoR2, see Figure S2B and Figure 3). Nevertheless, the importance of proximal promoter regions is obvious given the fact that many proximal promoter regions are successfully used to generate tissue-specific transgenic lines. Recently, Mikkelsen et al. demonstrated in adipocytes that manycis-regulatory elements are often not conserved between human and murine adipocytes even though the expression pattern of genes is conserved [28]. They observed that such motifs were located within linage-specific transposon insertions. Existence of multiple regulatory elements around biologically important genes could be a mechanism by which cells maintain key gene regulations against genomic changes during evolution. Clustering of regulatory elements could also result from an accumulative effect of such evolutional genomic changes.
Computational motif analysis is used to discover new transcrip-tion-factor binding motifs in sequences inferred from genome-wide
studies such as ChIP-seq [61]. In genome-wide ChIP analysis of transcription factors, motif analysis is used to obtain their accurate binding motifsanddiscover unknown DNA binding factors that co-localize with the transcription factors of interest, for example, see [27,62,63]. The analyses, however, relied on prior knowledge about transcription factors and the regions to be analyzed are limited to their biding sites. In contrast, the combination of motif analyses and mapping of regulatory elements by FAIRE-seq does not require such prior knowledge, hence offers a distinct advantage in unbiased screening for novel transcription factors important in given biological processes. In our study, we retrieved the motifs for PPARcand C/EBPs and for known regulators that top the list of the motifs identified in the adipocyte- or preadipocyte-specific FAIRE peaks (Figure 5, Figures S6 and S7). Furthermore, we demonstrated that NFIA and NFIB were functionally required for proper adipocyte differentiation (Figure 6). These results demonstrated that motif analyses of cell type–specific FAIRE peaks are useful in identifying regulators of a biological process in an unbiased manner.
To our knowledge, few studies have employed motif analysis and our unbiased approaches in investigating enhancer-like DNA regions. Mikkelsen et al. recently employed ChIP-seq for H3K27ac to define enhancer regions specific for adipocyte differentiation. Both studies similarly detected the motifs for PPAR, C/EBPs and Figure 8. NFI occupy the adipocyte-specific FAIRE peaks and/or the PPARcbinding sites near PPARc, C/EBPa, and aP2 genes.(A) The NFI binding motifs identified in the adipocyte-specific FAIRE peaks and/or the PPARcbinding sites in the vicinity of PPARc, C/EBPaand aP2. For site numbers, see (B). (B) Genomic location of the regions examined. B1 and B2 are unrelated genomic regions used as background negative controls. (C) ChIP-qPCR analysis using an anti-NFI antibody (H-300). (D) Percent fraction of genes harboring NFI motifs in non-promoter FAIRE peaks (within
AP-1 in the most enriched motifs. There are, however, differences. Mikkelsen discovered PLZF and SRF as novel negative regulators [28] and we found NFIA and NFIB as regulators of adipocyte differentiation—perhaps due to differences in methods. First, we directly compared FAIRE peaks and H3K27ac peaks detected in the Mikkelsen study and found considerable, but not complete, overlap especially in the non-promoter regions: 94% of 10,461 promoter FAIRE peaks and 45% of 27,320 non-promoter FAIRE peaks overlapped H3K27ac in 3T3-L1 on day 0. There may be different classes of enhancer elements that prefer either H3K27ac or open chromatin. Also, we used two parameters to sort motifs: the statistical significance of enrichment (p-value) in either kind of cell type–specific FAIRE peaks; and the motif enrichment ratio between the adipocyte- and preadipocyte-specific FAIRE peaks (see [28]). The combination guarantees significant enrichment of the peaks’ motifs and the difference in their number depending on whether they are adipocyte- or preadiocyle-specific. The motifs for PLZF and SRF were not on the top of our list since the p-values were not significant—probably due to relatively lower occurrence, although we also found a significant enrichment ratio of 0.37 and 0.50, respectively. We calculated p-values and the enrichment ratios of the top motifs in the Mikkelsen’s study by using our adipocyte- and preadipocyte-specific FAIRE peaks and found general similarity (Figure S10). Overall, both studies notably demonstrate the utility of the combining computational motif analysis and unbiased mapping of regulatory elements in identifying new regulators of adipocyte differentiation.
Siersbæk et al. recently employed DNase-seq to investigate genome-wide change in open chromatin structure at various time points during 3T3-L1 differentiation [6]. They reported dramatic increase in the number of open chromatin sites in the first hours of differentiation. Such regions included what they termed ‘‘hot spots’’ that were bound by multiple adipogenic regulators, facilitating binding of PPARcand C/EBPaduring the late stage of differentiation. We found that the DNaseI hypersensitive sites in 3T3-L1 cells on day 0 or day 6 in the Siersbaek study [6] significantly overlapped the FAIRE peaks on day 0 or day 8 in our study (78.8% and 80.9%, respectively) (Figure S11), suggesting that both methods detect similar open chromatin regions. Although limited amount of motif analyses of the DNase I sites was conducted in their study, we think a combination of motif analysis and DNase-seq should work in a similar way.
The NFI family was identified as site-specific DNA-binding protein that bound to the adenovirus origin of replication [56,57]. Although defects in development of organs such as brain, lung, tooth, bone and skeletal muscle inNfia,Nifb,NifcandNfix-deficient mice were documented [64,65,66,67,68,69], no publication has reported direct evidence that NFI family transcription factors are involved in adipogenesis, but it is a reasonable supposition since bone, muscle and adipocytes have a common mesenchymal precursor [70]. Interestingly, Graves et al. demonstrated that NFI was bound to the adipogenic25.4 kb enhancer region in the aP2 promoter [71], which is the original adipogenic enhancer region where the PPARc/RXR heterodimer was found to bind and act [72]. The NFI binding motif they examined by gel shift assay [72] was close to the best-characterized PPARc binding sites in the region, and was also in site 9 (Figure 8A, right panel, site 9), which was indeed bound by NFI in ChIP assay (Figure 8C). Forced overexpression of NFIA in 3T3-L1 cells dramatically induced expression of PPARc, C/EBPaand aP2 and caused lipid droplet formation before initiation of differentiation. Our ChIP data suggest that activation of these genes by NFIA is through direct binding of NFI to regulatory elements near these genes. In overexpression experiments, NFIB did not activate the adipogenic genes (Figure 7).
NFI factors are known to undergo extensive alternative splicing [57]. We speculate that this could be due to truncation of the C-terminus caused by lack of exons 10 and 11 in the NFIB cDNA that we cloned (NM_001113209.1) while the NFIA clone completely matched NM_010905.3. NFI was also implicated in functions of other nuclear receptors such as the androgen receptor (AR), estrogen receptor (ER) and glucocorticoid receptor [4,73,74]. Further studies are necessary to elucidate the mode of action of NFIs and positioning of NFIs in the adipogenic regulatory network.
Materials and Methods
Cell Culture
3T3-L1, NIH-3T3, 3T3-F442A and HEK293T cells were maintained in DMEM, supplemented with 10% FBS. For adipocyte differentiation, two days after confluence, 3T3-L1 cells were treated with dexamethasone (1mM), IBMX (0.5 mM), and insulin (5mg/ ml) (DMI) for 48 hours, followed by treatment with insulin alone, with medium replacement every two days thereafter. For dif-ferentiation of 3T3-F442A, cells were treated with insulin (5mg/ml) after confluence, with medium replacement every two days.
Animal Studies
All animal works have been conducted according to the institutional guidelines.
Antibodies
Generation of characterization of antibodies for human PPARc
and human RXRa was described previously [24]. Rabbit polyclonal anti-histone H3 trimethyl K4 (ab8580) was from Abcam. Antibodies against CTCF were from Upstate (#07– 729). Anti-NFI antibody (H-300) was from Santa Cruz (sc-5567).
FAIRE
FAIRE experiments were performed based on a protocol published by Giresi et al. [7]. Briefly, cells were fixed with 1% formaldehyde for five minutes at room temperature, the fixation stopped by adding 2.5 M glycine (final 125 mM). Fixed cells were scraped and collected in 15 ml tubes (4610‘6 cells/tube) and washed twice with cold PBS, then 86106cells were re-suspended in 800ml of MC lysis buffer (10 mM Tris-HCl pH 7.5, 10 mM NaCl, 3 mM MgCl2, 0.5% NP-40) and incubated on ice for ten minutes. After spinning for four minutes at 8000 rpm, the pellet was re-suspended in 400ml SDS lysis buffer (1% SDS, 10 mM EDTA, 50 mM Tris-HCl pH 8.0, proteinase inhibitor cocktail) and incubated on ice for ten minutes. Glass beads (size, 200 mg) (Polysciences Inc. #05483-250) were added and the DNA was sheared by sonicator. Next, we added 200ml cold ChIP dilution buffer (0.01% SDS, 1.1% Triton X-100, 1.2 mM EDTA, 16.7 mM Tris-HCl pH 8.0, 167 mM NaCl), and after spinning for one minute at 8,000 rpm, supernatant was transferred to a new 1.5 ml tube. Aliquote was taken, de-crosslinked, purified by phenol/chloroform extraction, and run on a gel to ensure average fragment sizes of 300 bp. Remaining samples were processed three times by phenol/chloroform extraction to recover DNA not bound by nucleosome in the water phase. The samples were de-crosslinked by overnight incubation at 65uC and purified by ethanol precipitation. They were subsequently treated with RNase A (final 50 ug/ml), purified by QIAquick PCR purification kit (Qiagen) and used for subsequent analyses.
Chromatin Immunoprecipitation (ChIP)
were cross-linked with 1% formaldehyde for ten minutes at room temperature and were prepared for ChIP as described previously. For ChIP using anti-H3K4me3 antibody, the nuclei of 3T3-L1 cells were prepared by centrifugation through a sucrose gradient and were digested with MNase (TaKaRa). After centrifugation, the supernatant was used for ChIP. Sequences of primers used for qPCR were listed in Table S1.
High-Throughput Sequencing and Peak Detection High-throughput sequencing was performed by using the Genome Analyzer System (GA II) (Illumina) as described elsewhere [76]. In short, we repaired ends of DNA samples, created 39-dA overhang, ligated Illumina adaptors, size-fractioned the samples by gel extraction and amplified them with 8 cycles of PCR according to the manufacturer’s instructions. We then purified the DNA and performed cluster generation and 36 cycles of sequencing on an Illumina cluster station and 1G analyzer following the manufacturer’s instructions. Sequences were mapped to the reference murine genome, NCBI build 37 (mm9). Peak detection was performed using Findpeaks 3.1.9.2 [77] with a false discovery rate (FDR) cut-off of 161024. Operations such as intersections, unions, and subtractions of genome regions were performed with a web-based GALAXY genome analysis tool [78,79].
Average Signal Profiling
Average profiling of FAIRE and histone modifications near transcription start sites or FAIRE peaks were generated using ‘‘sitepro’’ in the CEAS package [80].
Adipocyte- and Preadipocyte-Specific FAIRE Peaks For definition, we first ranked peaks based on signal intensity, which were detected in 3T3-L1 on either day 0 or day 8 with a FDR of 1024. We then classified each peak into tertiles (high, mid, low) for either day the peak that had the higher percentile (see also the 4-by-4 table in Figure 3B).
Gene Ontology Analysis
Gene ontology annotation analysis was performed using DAVID (ver. 6.7) [38]. The top 2,000 genes were used, sorted by the number and maximum height of the adipocyte-specific FAIRE peaks within a region625 kb from TSS. For genes bound by PPARc, we used the top 931 genes with more than three PPARcbinding sites within a region625 kb from TSS. To detect enrichment of specific—rather than general—terms, following the instructions of DAVID’s developer, we used GOTERM_BP_4 and GOTERM_BP_5, and sorted result lists by using both fold enrichment and Benjaini p-value [38,81].
Clustering Analysis
Statistical clustering analyses of the PPARcbinding sites and the adipocyte-specific FAIRE peaks were performed as described in references [47,48].
Enriched Motif Analysis
Enrichment analyses of known motifs were performed with AME ver. 4.6.0 in the MEME suite [82]. After removing repeat regions with RepeatMasker [83], DNA sequences from the center 150 bp regions of the top 2,000 cell type–specific FAIRE peaks were analyzed with a fixing partition of 2,000, dinucleotide randomiza-tion and p-value threshold of 1024and p-value report threshold of 0.05. We used the licensed version of TRANSFAC database (Release 2010.4) [51] and the JASPAR CORE database [52].
Motif enrichment ratios (adipocyte-/preadipocytes-specific FAIRE) for motifs in the TRANSFAC or JASPAR CORE database were determined by a method described in reference [28]. Instances of motifs were enumerated in the adipocyte- or preadipocytes-specific FAIRE peaks by using FIMO ver. 4.6.0 in the MEME suite, with a p-value threshold of 1024, normalized by total nucleotide length. Motif enrichment ratios were determined by dividing the normalized adipocyte enrichment values by preadipocyte values.
MEME ver. 4.3.0 [40] was used to identify de novo motifs over-represented in the adipocyte- or preadipocyte-specific FAIRE peaks and the PPARc binding sites. After removing repeat regions with RepeatMasker [83], DNA sequences from the center 150 bp regions of the top 800 cell type–specific FAIRE peaks with higher signals were used for the analyses. Identified enriched de novo motifs were next analyzed by TOMTOM in the MEME suite for comparison against a database of known motifs.
Gel Shift Assay and Reporter Assay
The Gel shift assay and luciferase reporter assay were performed as previously described [84,85]. For the luciferase assay, putative PPRE motifs were cloned in tandem (36or 66) into pGL3 basic reporter plasmid (Promega) together with the tk minimal promoter. The 25.4 kb aP2 promoter luciferase construct is described in reference [84].
Knockdown of NFIA and NFIB by siRNA in 3T3-L1 Cell Differentiation
The 3T3-L1 cells were transfected with either control siRNA or siRNA for murine NFIA and NFIB (Santa Cruz Biotechnology, sc-37007, sc-36045 and sc-43566, Sigma MISSION siRNA, SASI_Mm02_00309629, 00309630, 00307243, 00307244) by using Lipofectamine RNAiMAX (Invitrogen) just before they reached confluence. Induction of differentiation (the DMI treatment) was started two days after confluence, as described in a method for differentiation of 3T3-L1 cells.
Oil-Red-O Staining
The 3T3-L1 adipocytes were washed with PBS, fixed with formalin for 30 minutes at room temperature, rinsed with 60% isopropanol and stained with oil red O solution—freshly made by mixing 0.5% oil red O in isopropyl alcohol and water (3:2)—and left to sit for one hour; the cells were then washed with water and dried.
mRNA Expression Analysis
Total RNA was isolated using TRIzol reagent (Invitrogen), then 0.5mg of the total RNA was reverse transcribed using high-capacity cDNA reverse transcription kits (Applied Biosystems #4375222) and random hexamers. Real-time quantitative PCR (SYBR green) analysis was performed on a 7900HT Fast Real-Time PCR System (Applied Biosystems). Primer sequences are listed in Table S1. Expression was normalized to 36B4.
Microarray Analysis
Retroviral Expression System
We amplified NFIA and NFIB coding sequences from cDNA prepared from adipocytes using primers listed in Table S1, and cloned them into retroviral pMXs-puro vectors. We also made a dominant negative NFIA that lacks the C-terminal transactiva-tion/repression domain (NFIA-DN) [58]. Plat E cells were transfected with pMXs-puro plasmids using Lipofectamine 2000 (Invitrogen). Culture medium containing viruses after two day incubation was centrifuged at 2,000 rpm for 5 min and superna-tant was collected and supplemented with 10mg/ml polybrene. Conditioned medium with viruses was used to infect 3T3-L1 cells and then selection was started by adding 2mg/ml puromycin and incubated for 2 days.
Accession Numbers
FAIRE-seq and ChIP-seq raw data are deposited into the DNA data bank of Japan (DDBJ accession number: DRA000378).
Supporting Information
Figure S1 Genomic distribution and characterization of pro-moter and non-propro-moter FAIRE peaks in 3T3-L1. (A) Location analysis of FAIRE peaks relative to RefSeq genes in 3T3-L1 (day 0). Promoter FAIRE peaks were defined as those located within+/ 2500 bp of RefSeq transcription start sites (TSSs). Notably, only 8% of the non-promoter FAIRE peaks were located in the25 kb proximal promoter region, and the vast majority of them were located in distal regions such as introns and intergenic regions. (B) Average profiles of FAIRE and H3K4me3 signals around the TSSs of genes with high, moderate and low expression levels. Signal intensity from microarray data was used for classification by the signal’s expression levels. The X-axis indicates distance from the TSS. (C) Percent fractions of the FAIRE peaks (promoter and non-promoter) that overlapped CTCF binding sites as well as H3K4me1 and H3K4me3 positive regions. (D) Average profiles of FAIRE, H3K4me1, H3K4me3, and H3K27ac signals around the FAIRE peaks in promoter and non-promoter regions. The X-axis shows distance from the center of the FAIRE peaks. The FAIRE peaks located within +/2100 bp from RefSeq TSSs were analyzed for promoter FAIRE peaks. The promoter FAIRE peaks showed H3K4me3(+)/H3K4me1(2) modification whereas the non-promoter FAIRE peaks showed H3K4me3(2)/H3K4me1(+) modification.
(TIF)
Figure S2 Clustering of multiple adipocyte-specific non-pro-moter FAIRE peaks and PPARcbinding sites nearMgll,Adipor2 and Slc2a4. Clusters of multiple adipocyte-specific FAIRE peaks and/or PPARcbinding sites were located in genomic regions near Mgll(A),Adipor2(B) andSlc2a4(Glut4) (C) in 3T3-L1 adipocytes. In some cases—e.g., Slc2ar4 (Glut4) and Ybx2 in (C)—multiple genes were located in such regions. Bars below the FAIRE signal represent statistically significant FAIRE positive peaks (FDR,1024). Red asterisks indicate the adipocyte-specific FAIRE peaks on day 8 (see Figure 2B for definition). Blue arrow heads in (B) indicate the PPARcbinding regions in the intron 1 ofAdipor2 tested in Figure 3.
(TIF)
Figure S3 Clustering of multiple adipocyte-specific non-pro-moter FAIRE peaks and PPARc binding sites near Cebpa, Srebf1and Cidec. Clusters of multiple adipocyte-specific FAIRE peaks and/or PPARc binding sites were located in genomic regions nearCebpa(A),Srebf1(B) andCidec(C).
(TIF)
Figure S4 Binding sites for PPARcand RXRain 3T3-L1 cells. (A) De novo motif analysis (MEME) of the center 150 bp of the PPARc/RXRa binding regions (top 400) in 3T3-L1, day 8. Of note, there is a 59 extension AGT, which corresponds to the interaction between the PPARchinge region and DNA identified by crystal structure analysis [41]. (B) A heat map showing enrichment of PPARcin the vicinity of genes up-regulated during differentiation. The horizontal bars in the right panel indicate each gene bound by PPARc(+/225 kb from TSS, day 8) (C) Ontology analysis with DAVID of genes bound by PPARc[13].
(TIF)
Figure S5 Co-regulation of neighboring genes during adipocyte differentiation. (A, B) Genomic loci near (A) co-regulatedMrpl12, Slc25a10andGcgrand (B) co-regulatedHsd11b1,G0s2andLamb3. Note, there are clusters of the adipocyte-specific FAIRE peaks (asterisks) and the PPARc binding sites encompassing the co-regulated genes. (C) Microarray analysis showing co-regulation of Mrpl12, Slc25a10 and Gcgr, and co-regulation of Hsd11b1, G0s2 andLamb3included in the clusters of multiple adipocyte-specific FAIRE peak and PPARcbinding sites.
(TIF)
Figure S6 Known motif enrichment analysis of the adipocyte- or preadipocyte-specific FAIRE peaks (JASPAR CORE motifs). Enrichment analysis of the adipocyte- (left) and the preadipo-cyte-specific (right) FAIRE peaks for known motifs in the JASPAR CORE database performed with AME in the MEME suite by the same methods used in Figure 5.
(TIF)
Figure S7 De novo motif analysis of the adipocyte-specific FAIRE peaks. MEME ver. 4.3.0 was used to identify de novo motifs over-represented in the adipocyte- and preadipocyte-specific FAIRE peaks and PPARc binding sites. After removing repeat regions, DNA sequences from the center 150 bp regions of top 800 cell type–specific FAIRE peaks with higher signals were used for the analyses. Identified enriched de novo motifs were analyzed by TOMTOM in the MEME suite for comparison against a database of known motifs.
(TIF)
Figure S8 Suppression of adipocyte differentiation by knock-down of NFIA and NFIB by using different siRNAs.
(TIF)
Figure S9 Comparison of FAIRE Peaks between undifferenti-ated 3T3-L1 and NIH-3T3 cells. (A) A heat map showing enrichment of the 3T3-L1- and NIH-3T3-specific FAIRE peaks in the vicinity (+/225 kb from TSS) of genes sorted by using the ratio of expression levels in 3T3-L1 or NIH-3T3. The FAIRE peaks specific to 3T3-L1 or NIH-3T3 were enriched in the vicinity of genes whose expression levels were higher in 3T3-L1 or NIH-3T3, respectively. (B) Known motif analysis of the 3T3-L1-specific FAIRE peaks (vs NIH-3T3). The binding motif for EBF and PPARc/RXR were among the top scored motifs.
(TIF)
Figure S10 The enrichment ratios of the top motifs in Mikkelsen’s study [28] by using the adipocyte- and preadipo-cyte-specific FAIRE peaks.
(TIF)
Figure S11 Comparison of DNase-seq in Siersbæk’s study [6] and FAIRE-seq peaks nearKlf5,PpargandCebpagene. DHS stands for DNase I hypersensitive sites.
Table S1 Sequences of primers. (DOC)
Acknowledgments
The authors would like to thank: Jason Lieb for providing the FAIRE protocol; the DNA data bank of Japan and Database Center for Life Science (DBCLS) for providing computer resources; all the staff and members of Takashi Kadowaki’s lab for technical help and discussion; Kaori Shiina, Shogo Yamamoto, Genta Nagae, Yasuharu Kanki, Atsushi Okabe, Yoichiro Wada, Seitaro Nomura, Kenta Magoori, Takeshi Inagaki, Toshiya Tanaka, and other members of the Laboratory of Systems Biology and Medicine, Research Center, Daizo-Koinuma in the Department of Molecular Pathology; Kenichi Takayama and Satoshi Inoue in the Department of Geriatric Medicine, Yumiko Oishi-Tanaka and Ichiro Manabe in the Department of Cardiovascular Medicine,
Kousuke Watanabe and Daiya Takai in the Department of Respiratory Medicine, Graduate School of Medicine, the University of Tokyo—all, for technical help and suggestions.
Author Contributions
Conceived and designed the experiments: H Waki, M Nakamura, T Yamauchi, K Wakabayashi. Performed the experiments: H Waki, M Nakamura, K Wakabayashi, J Yu, L Hirose-Yotsuya, K Take, W Sun, T Aoyama. Analyzed the data: H Waki, M Nakamura, K Wakabayashi, T Fujita, S Tsutsumi, T Yamauchi, M Iwabu, M Okada-Iwabu. Contributed reagents/materials/analysis tools: H Waki, M Nakamura, K Wakabayashi, T Fujita, S Tsutsumi. Wrote the paper: H Waki, M Nakamura. Supervised the design of the experiments: K Ueki, T Kodama, T Yamauchi, S Tsutsumi, J Sakai, H Aburatani, T Kadowaki.
References
1. Lander ES, Linton LM, Birren B, Nusbaum C, Zody MC, et al. (2001) Initial sequencing and analysis of the human genome. Nature 409: 860–921. 2. Wu C (1980) The 59ends of Drosophila heat shock genes in chromatin are
hypersensitive to DNase I. Nature 286: 854–860.
3. Song L, Crawford GE (2010) DNase-seq: a high-resolution technique for mapping active gene regulatory elements across the genome from mammalian cells. Cold Spring Harb Protoc 2010: pdb prot5384.
4. John S, Sabo PJ, Thurman RE, Sung MH, Biddie SC, et al. (2011) Chromatin accessibility pre-determines glucocorticoid receptor binding patterns. Nat Genet. 5. Heintzman ND, Hon GC, Hawkins RD, Kheradpour P, Stark A, et al. (2009) Histone modifications at human enhancers reflect global cell type–specific gene expression. Nature 459: 108–112.
6. Siersbaek R, Nielsen R, John S, Sung MH, Baek S, et al. (2011) Extensive chromatin remodelling and establishment of transcription factor ‘hotspots’ during early adipogenesis. Embo J 30: 1459–1472.
7. Giresi PG, Lieb JD (2009) Isolation of active regulatory elements from eukaryotic chromatin using FAIRE (Formaldehyde Assisted Isolation of Regulatory Elements). Methods 48: 233–239.
8. Giresi PG, Kim J, McDaniell RM, Iyer VR, Lieb JD (2007) FAIRE (Formaldehyde-Assisted Isolation of Regulatory Elements) isolates active regulatory elements from human chromatin. Genome Res 17: 877–885. 9. Birney E, Stamatoyannopoulos JA, Dutta A, Guigo R, Gingeras TR, et al.
(2007) Identification and analysis of functional elements in 1% of the human genome by the ENCODE pilot project. Nature 447: 799–816.
10. Gaulton KJ, Nammo T, Pasquali L, Simon JM, Giresi PG, et al. (2010) A map of open chromatin in human pancreatic islets. Nat Genet 42: 255–259. 11. Rosen E, Eguchi J, Xu Z (2009) Transcriptional targets in adipocyte biology.
Expert Opin Ther Targets 13: 975–986.
12. Waki H, Tontonoz P (2007) Endocrine functions of adipose tissue. Annu Rev Pathol 2: 31–56.
13. Barak Y, Nelson MC, Ong ES, Jones YZ, Ruiz-Lozano P, et al. (1999) PPAR gamma is required for placental, cardiac, and adipose tissue development. Mol Cell 4: 585–595.
14. Kubota N, Terauchi Y, Miki H, Tamemoto H, Yamauchi T, et al. (1999) PPAR gamma mediates high-fat diet-induced adipocyte hypertrophy and insulin resistance. Mol Cell 4: 597–609.
15. Rosen ED, Sarraf P, Troy AE, Bradwin G, Moore K, et al. (1999) PPAR gamma is required for the differentiation of adipose tissue in vivo and in vitro. Mol Cell 4: 611–617.
16. Tontonoz P, Hu E, Spiegelman BM (1994) Stimulation of adipogenesis in fibroblasts by PPAR gamma 2, a lipid-activated transcription factor. Cell 79: 1147–1156.
17. Imai T, Takakuwa R, Marchand S, Dentz E, Bornert JM, et al. (2004) Peroxisome proliferator-activated receptor gamma is required in mature white and brown adipocytes for their survival in the mouse. Proc Natl Acad Sci U S A 101: 4543–4547.
18. Lehmann JM, Moore LB, Smith-Oliver TA, Wilkison WO, Willson TM, et al. (1995) An antidiabetic thiazolidinedione is a high affinity ligand for peroxisome proliferator-activated receptor gamma (PPAR gamma). J Biol Chem 270: 12953–12956.
19. Wu Z, Bucher NL, Farmer SR (1996) Induction of peroxisome proliferator-activated receptor gamma during the conversion of 3T3 fibroblasts into adipocytes is mediated by C/EBPbeta, C/EBPdelta, and glucocorticoids. Mol Cell Biol 16: 4128–4136.
20. Tontonoz P, Spiegelman BM (2008) Fat and beyond: the diverse biology of PPARgamma. Annu Rev Biochem 77: 289–312.
21. Nielsen R, Pedersen TA, Hagenbeek D, Moulos P, Siersbaek R, et al. (2008) Genome-wide profiling of PPARgamma:RXR and RNA polymerase II occupancy reveals temporal activation of distinct metabolic pathways and changes in RXR dimer composition during adipogenesis. Genes Dev 22: 2953–2967.
22. Lefterova MI, Zhang Y, Steger DJ, Schupp M, Schug J, et al. (2008) PPARgamma and C/EBP factors orchestrate adipocyte biology via adjacent binding on a genome-wide scale. Genes Dev 22: 2941–2952.
23. Nakachi Y, Yagi K, Nikaido I, Bono H, Tonouchi M, et al. (2008) Identification of novel PPARgamma target genes by integrated analysis of ChIP-on-chip and microarray expression data during adipocyte differentiation. Biochem Biophys Res Commun 372: 362–366.
24. Wakabayashi K, Okamura M, Tsutsumi S, Nishikawa NS, Tanaka T, et al. (2009) The peroxisome proliferator-activated receptor gamma/retinoid X receptor alpha heterodimer targets the histone modification enzyme PR-Set7/ Setd8 gene and regulates adipogenesis through a positive feedback loop. Mol Cell Biol 29: 3544–3555.
25. Hamza MS, Pott S, Vega VB, Thomsen JS, Kandhadayar GS, et al. (2009) De-novo identification of PPARgamma/RXR binding sites and direct targets during adipogenesis. PLoS ONE 4: e4907. doi:10.1371/journal.pone.0004907. 26. Steger DJ, Grant GR, Schupp M, Tomaru T, Lefterova MI, et al. (2010)
Propagation of adipogenic signals through an epigenomic transition state. Genes Dev 24: 1035–1044.
27. Lefterova MI, Steger DJ, Zhuo D, Qatanani M, Mullican SE, et al. (2010) Cell-specific determinants of peroxisome proliferator-activated receptor gamma function in adipocytes and macrophages. Mol Cell Biol 30: 2078–2089. 28. Mikkelsen TS, Xu Z, Zhang X, Wang L, Gimble JM, et al. (2010) Comparative
epigenomic analysis of murine and human adipogenesis. Cell 143: 156–169. 29. Okamura M, Kudo H, Wakabayashi K, Tanaka T, Nonaka A, et al. (2009)
COUP-TFII acts downstream of Wnt/beta-catenin signal to silence PPAR-gamma gene expression and repress adipogenesis. Proc Natl Acad Sci U S A 106: 5819–5824.
30. Sakabe NJ, Nobrega MA (2010) Genome-wide maps of transcription regulatory elements. Wiley Interdiscip Rev Syst Biol Med. pp 422–437.
31. Phillips JE, Corces VG (2009) CTCF: master weaver of the genome. Cell 137: 1194–1211.
32. Mori T, Sakaue H, Iguchi H, Gomi H, Okada Y, et al. (2005) Role of Kruppel-like factor 15 (KLF15) in transcriptional regulation of adipogenesis. J Biol Chem 280: 12867–12875.
33. Pruitt KD, Tatusova T, Maglott DR (2007) NCBI reference sequences (RefSeq): a curated non-redundant sequence database of genomes, transcripts and proteins. Nucleic Acids Res 35: D61–65.
34. Robertson AG, Bilenky M, Tam A, Zhao Y, Zeng T, et al. (2008) Genome-wide relationship between histone H3 lysine 4 mono- and tri-methylation and transcription factor binding. Genome Res 18: 1906–1917.
35. Heintzman ND, Stuart RK, Hon G, Fu Y, Ching CW, et al. (2007) Distinct and predictive chromatin signatures of transcriptional promoters and enhancers in the human genome. Nat Genet 39: 311–318.
36. Karlsson M, Contreras JA, Hellman U, Tornqvist H, Holm C (1997) cDNA cloning, tissue distribution, and identification of the catalytic triad of monoglyceride lipase. Evolutionary relationship to esterases, lysophospholipases, and haloperoxidases. J Biol Chem 272: 27218–27223.
37. Nishino N, Tamori Y, Tateya S, Kawaguchi T, Shibakusa T, et al. (2008) FSP27 contributes to efficient energy storage in murine white adipocytes by promoting the formation of unilocular lipid droplets. J Clin Invest 118: 2808–2821. 38. Huang da W, Sherman BT, Lempicki RA (2009) Systematic and integrative
analysis of large gene lists using DAVID bioinformatics resources. Nat Protoc 4: 44–57.
39. Kliewer SA, Umesono K, Noonan DJ, Heyman RA, Evans RM (1992) Convergence of 9-cis retinoic acid and peroxisome proliferator signalling pathways through heterodimer formation of their receptors. Nature 358: 771–774.