www.drink-water-eng-sci.net/5/87/2012/ doi:10.5194/dwes-5-87-2012
©Author(s) 2012. CC Attribution 3.0 License.
Engineering and Science
Open Access
Dynamic hydraulic models to study sedimentation in
drinking water networks in detail
I. W. M. Pothof1,2and E. J. M. Blokker3
1Deltares/Industrial Hydrodynamics, Delft, The Netherlands 2Delft University of Technology/Water management, Delft, The Netherlands
3KWR Watercycle Research Institute, Nieuwegein, The Netherlands
Correspondence to: I. W. M. Pothof ([email protected])
Received: 23 February 2012 – Published in Drink. Water Eng. Sci. Discuss.: 4 April 2012 Revised: 13 November 2012 – Accepted: 3 December 2012 – Published: 14 December 2012
Abstract. Sedimentation in drinking water networks can lead to discolouration complaints. A sufficient
crite-rion to prevent sedimentation in the Dutch drinking water networks is a daily maximum velocity of 0.25 m s−1.
Flushing experiments have shown that this criterion is a sufficient condition for a clean network, but not a necessary condition. Drinking water networks include many locations with a maximum velocity well below 0.25 m s−1without accumulated sediments. Other criteria need to be developed to predict which locations are
susceptible to sedimentation and to prevent sedimentation in future networks. More distinctive criteria are helpful to prioritise flushing operations and to prevent water quality complaints.
The authors use three different numerical modelling approaches – quasi-steady, rigid column and water ham-mer – with a temporal discretisation of 1 s in order to assess the influence of unsteady flows on the wall shear stress, causing resuspension of sediment particles. The model predictions are combined with results from flush-ing experiments in the drinkflush-ing water distribution system of Purmerend, the Netherlands. The waterhammer model does not result in essentially different flow distribution patterns, compared to the rigid column and quasi-steady modelling approach. The extra information from the waterhammer model is a velocity oscillation of approximately 0.02 m s−1 around the quasi-steady solution. The presence of stagnation zones and multiple
flow direction reversals seem to be interesting new parameters to predict sediment accumulation, which are consistent with the observed turbidity data and theoretical considerations on critical shear stresses.
1 Introduction
The goal of drinking water companies is to supply their cus-tomers with good quality drinking water 24 h per day. With respect to water quality, the focus has for many years been on the drinking water treatment. Recently, interest in water quality in the drinking water distribution system (DWDS) has been growing. On the one hand, this is driven by customers who expect the water company to ensure the best water qual-ity by preventing such obvious deficiencies in water qualqual-ity as discolouration and (in many countries) by assuring a suf-ficient level of chlorine residual. On the other hand, since “9/11” there is a growing concern about (deliberate) contam-inations in the DWDS.
Sedimentation in drinking water networks may lead to discolouration complaints. A sufficient criterion for Dutch DWDS, consisting of PVC, AC and lined CI mains, to pre-vent sedimentation is a daily maximum velocity of 0.25 m s−1
(Blokker et al., 2010a). Flushing experiments have shown that this criterion is a sufficient condition for a clean network, but not a necessary condition.
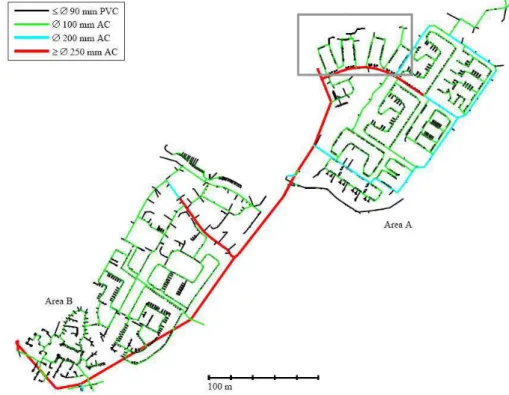
Figure 1.Purmerend DWDS and selected test area (grey rectangle). Source: Blokker et al. (2010a).
In this paper, we investigate whether more detailed hydro-dynamic models will result in more accurate criteria for the prediction, efficient mitigation and ultimately prevention of sedimentation in the DWDS. We have used three different numerical modelling approaches: (1) the traditional quasi-steady model, as implemented in EPANET-based models; (2) a rigid column model, in which the inertia of the wa-ter mass in all pipes is taken into account and (3) the com-plete waterhammer model, including liquid compressibility and pipe stiffness so that the propagation of pressure waves is correctly simulated (Wylie and Streeter, 1993). The quasi-steady modeling results were obtained with EPANET (Ross-man, 2000). The Rigid Column (RC) and waterhammer re-sults were obtained with WANDA, developed and validated by Deltares (Deltares, 1993–2011).
2 Approach
2.1 Network selection
Ideally, we would investigate a DWDS with loops and a sin-gle water source in which sedimentation has been measured in all pipes and in which the velocity time series between two consecutive flushing procedures has been measured in all pipes. Turbidity measurements during well-defined flush-ing procedures provide a reasonable spatial distribution of the sediment load in all flushed pipes. Obviously, the second criterion is not practically feasible in any DWDS. However,
if the network layout (pipe length, material, internal diam-eter, wall roughness) is known and sufficient demographic information is available on the inhabitants, then a reasonable assessment of the time series of the velocities can be com-puted from detailed stochastic water demand model simula-tions with SIMDEUM (Blokker et al., 2010b).
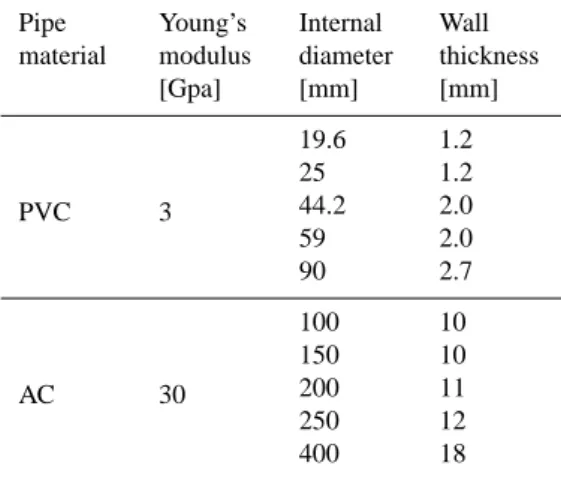
Table 1.Pipe properties for waterhammer model for pipes with a pressure rating of 6 barg.
Pipe material
Young’s modulus [Gpa]
Internal diameter [mm]
Wall thickness [mm]
PVC 3
19.6 1.2
25 1.2
44.2 2.0
59 2.0
90 2.7
AC 30
100 10
150 10
200 11
250 12
400 18
2.2 Rigid column and waterhammer model
The Rigid column model does not need any additional in-formation in comparison with the EPANET model. The only difference is the extension of the momentum equation with the inertia term:
∆H=λL D
v2 2g+
L g
dv
dt (1)
where∆H [m] is the differential head of an individual pipe in the DWDS,λ[–] is the quasi-steady friction factor according to White-Colebrook, L the pipe length, D [m] is the internal pipe diameter, v [m s−1] is the pipe velocity and g [m s−2] is
the constant of gravitational acceleration.
The more advanced waterhammer model takes the pipe elasticity and water compressibility into account, so that the effects of pressure waves in the network are computed. This requires additional information on the pipe material and wall thickness. The pipe materials are shown in Fig. 1 and the ap-plied wall thickness values and Young’s moduli are listed in Table 1.
These data result in typical acoustic wave speeds of 350 m s−1 in PVC pipes and 1000 m s−1 in AC pipes. Pipes
with a length of less than 2 m have been modelled as rigid column pipes, in order to prevent a time step of less than 0.002 s. The timestep of the waterhammer model is 0.003 s.
Due to the fact that the test area includes two loops, the rigid column and waterhammer models may lead to a diff er-ent pressure and flow distribution than the EPANET model, due to the presence of the inertia term in the momentum balance. Both modelling approaches have been modeled in WANDA (Deltares, 1993–2011). All boundary conditions are identical for the three different modeling approaches.
2.3 Sedimentation and resuspension
The typical particle size (d<25µm=0.025 mm) (Vreeburg,
2007) and particle density (ρs=1200 kg m−3) of material in
0.0001 0.01 1
0.001 0.01 0.1 1
te
rm
in
a
l
v
e
lo
c
it
y
[
m
m
/s
]
particle diameter [mm]
Figure 2.Particle terminal falling velocity as a function of particle size;ρs=1200 kg m−3.
drinking water networks are so small that the terminal veloc-ity can be determined with Stokes’ law. The terminal particle velocity vt[m s−1] follows directly from:
vt=
(ρs−ρf)
µf
gd2
18 (2)
The terminal velocity vt is only 0.07 mm s−1 at particle
di-ameter d=0.025 mm andρs=1200 kg m−3and fluid density
ρf=1000 kg m−3 (Fig. 2);µf [Pa s] is the dynamic viscosity
of water. A particle of this size needs 12 min to drop 50 mm. If these particles do settle at all, they will easily be resus-pended at the so-called critical shear stress. Settled particles reside in the laminar sublayer of a distribution pipe. There-fore, Soulsby’s model for the critical shear stress is applied (Soulsby, 1997). Soulsby has developed his model for non-cohesive particles. For particles smaller than 100µm the
di-mensionless critical shear stressθcrtends to 0.3, but
exper-imental evidence is limited in this particle range. The shear stressτcr[Pa] then becomes:
τcr=θcr(ρs−ρf) gd=0.015 Pa (3)
where a maximum particle size of d=0.025×10⁻³m was
substituted. The critical shear stress may increase if the par-ticles exhibit cohesive behaviour.
The laminar wall shear stressτw,lam[Pa] is a known
func-tion of the average pipe velocity U [m s−1] and pipe radius R
[m].
τw,lam=
R 2
dp dx=
4µfU
R (4)
If the flow becomes turbulent (Re>2300), then a typical fric-tion factor isλ=0.03 for pipes with diameter D=0.1 m. In this case the wall shear stressτw,tur[Pa] is computed as
τw,tur=
λ 8ρfU
2=3.75U2 (5)
0 0.03 0.06 0.09 0.12
0 0.02 0.04 0.06 0.08 0.1 0.12
S
h
e
a
r
s
tr
e
s
s
(
P
a
)
Pipe velocity (m/s)
wall shear stress (steady)
Critical shear stress (d = 25 mu)
Max. transient shear stress
dt
67
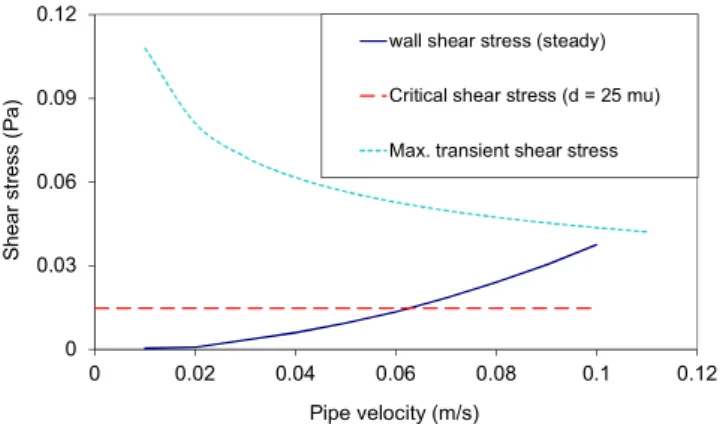
Figure 3.Wall shear stress (Eqs. 4 and 5), critical shear stress for resuspension (Eq. 3) and maximum unsteady shear stress (Eq. 6).
plotted in Fig. 3, showing that the larger particles (ρs=
1200 kg m−3and d=25
µm) will move if the water velocity
U>0.06 m s−1. The critical shear stress for resuspension
in-creases linearly with the particle diameter and density, so that the critical water velocity for other particles can be derived from Fig. 3.
Due to acceleration and deceleration of the flow, the ve-locity profile does not vary in a quasi-steady manner. There-fore, the unsteady wall shear stress may contribute signifi-cantly to the total wall shear stress. The modelling of these unsteady friction phenomena has not yet led to a generally accepted modelling approach. Brunone et al. (2000) has pro-posed a model that is based on instantaneous accelerations. Others have extended unsteady friction models for laminar flows (Vardy and Brown, 2003), based on Zielke (1968). Pothof (2008) has developed a model in which the unsteady shear stress model is based on a decelerating turbulent flow. Vardy and Brown (2003) have derived a maximum unsteady wall shear stress,τwu,max[Pa]:
τwu,max=
ρw
√
C∗DdU/dt
2 (6)
where C∗[–] is a function of the Reynolds number
C∗=12.86/Reκ
κ=log15.29.Re0.0567 (7) The transient simulation with the waterhammer model shows typical velocity decelerations of 2 cm s−2, independent of
the water velocity. This information can be combined with Eq. (6) to obtain the maximum unsteady shear stress in a pipe with D=0.1 m as a function of the water velocity (Fig. 3). Figure 3 shows that particles of d=25µm may be easily
re-suspended by flow acceleration or decelerations at velocities well below U=0.06 m s−1.
This analysis suggests that sedimentation can only occur in stagnation zones. We will therefore focus on the stagnation zones in the network loops.
no results >0 FTU >37 FTU >218 FTU >292 FTU >335 FTU
k
0
a
b
c
d
e
f
g
h
i
j
Figure 4. Spatial distribution of turbidity measurement in the Purmerend test area.
-0,08 -0,04 0 0,04
100 101 102 103 104 105
Time (min)
v
e
lo
c
it
y
(
m
/s
)
WANDA-RC EPAnet WANDA-WH
Figure 5.5-min detail of the three modelling approaches in pipe e (100=06:40 a.m.).
3 Results
3.1 Turbidity measurements
The turbidity time series measurements have been translated to a spatial distribution of turbidity (Fig. 4). For each flush-ing action, the measured turbidity [FTU, Formazin Turbid-ity Unit] of the 1st turnover was linked to the location in the stretch of pipes from which the particles originated. This was done by converting the measurement time [s] to the flushed pipe length [m] with the help of the flushing flow [m3s−1]
and pipe diameter [m] (Blokker et al., 2010a). For some pipe stretches no results are shown in Fig. 4, because the pipe was not flushed, or the conversion to the pipe length was too inac-curate in case of short flushing times, leaking valves or high turbidities in the 2nd turnover.
d. PSF3906
-0,05 0 0,05 0,1
0 60 120 180 240 300 360
Time (min) w a te r v e lo c it y U ( m /s ) WANDA-RC EPAnet e. MSF0271 -0,1 -0,05 0 0,05
0 60 120 180 240 300 360
Time (min) w a te r v e lo c it y U ( m /s ) WANDA-RC EPAnet
3
h. MSF0257 -0,1 -0,05 0 0,050 60 120 180 240 300 360
Time (min) w a te r v e lo c it y U ( m /s ) WANDA-RC EPAnet i. PSF0057 -0,05 0 0,05 0,1 0,15 0,2 0,25
0 60 120 180 240 300 360
Time (min) w a te r v e lo c it y U ( m /s ) WANDA-RC EPAnet
4
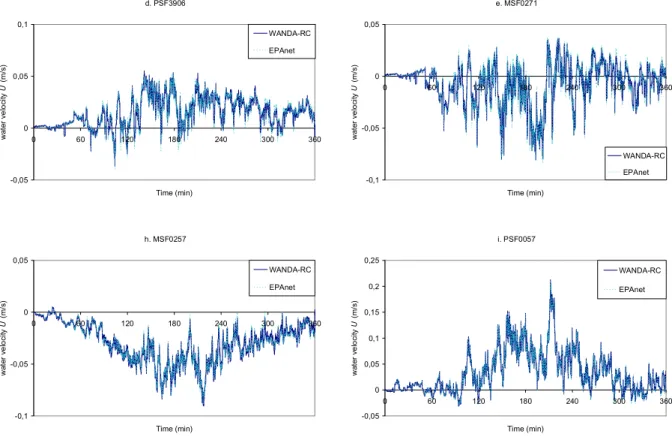
Figure 6.Velocities in reaches d, e., h and i (labels in Fig. 4); start time corresponds to 05:00 a.m.
of homes. However, the first loop hardly contains any sed-iment, whereas a fair amount of sediment was found in the second loop. Following the reasoning in Sect. 2, a stagnation zone should be absent in loop (b-c-d) and present in loop (g-h-i). The presence of stagnation zones will be discussed in Sect. 3.2.
3.2 Simulation results
The rigid column model is practically identical to the EPANET model, even at the temporal resolution in demands of 1 s, as illustrated in Figs. 5 and 6. The waterhammer model shows typical velocity oscillations of 0.02 m s−1 and
typi-cal accelerations of 0.02 m s−2around the EPANET solution
(Fig. 5). Since the magnitude of velocity oscillations are in-dependent of the absolute velocities, these simulations sug-gest that these oscillations are generally valid at the local net-work level, but this statement requires further substantiation with local measured flow data at the appropriate temporal scale of 1 s as applied in these simulations. These kind of flow data were not available for the Purmerend test area.
The stochastic nature of the drinking water demand is re-sponsible for spatial variation of the stagnation point. In fact, there is no stagnation zone, but there are pipes where many flow reversals occur. The velocity time series at location e contains most flow reversals; this is the connection with the large AC pipe, marked k in Fig. 4. The simulated flow is
4 Conclusions and recommendations
Detailed hydraulic simulations have been performed with a temporal resolution of 1 s and with three modelling ap-proaches: an EPANET model (quasi steady state), a Rigid Column model and a waterhammer model. We have inves-tigated whether the more advanced hydraulic modelling ap-proaches provide necessary conditions or unambiguous cri-teria for the presence of sedimentation in a DWDS. The de-tailed simulation results have been combined with turbidity measurements during flushing procedures in order to iden-tify promising sedimentation criteria, which are summarised hereafter.
The Rigid Column simulation is practically identical with the EPANET simulation. The water hammer simulation shows velocity oscillations of approximately 2 cm s−1 and
2 cm s−2 around the EPANET solution, independent of the
magnitude of the velocity. It is recommended to verify these transient velocities with flow measurements with sufficient temporal resolution. The more detailed simulations do not lead to different flow distributions in the Purmerend DWDS. The presence of stagnation zones and multiple flow direc-tion reversals may serve as alternative parameters to predict sediment accumulation, which are consistent with theoreti-cal considerations on crititheoreti-cal shear stresses and with the ob-served turbidity data. The analysis of critical shear stress, in-cluding unsteady shear stresses, confirms that sediment in the DWDS must exhibit cohesive behaviour to accumulate any material. It is recommended to determine the cohesive prop-erties of sediment in DWDS. A direct consequence of the analysis in this paper states that sediment accumulation will not occur in branched distribution networks, because of the low critical shear stress for resuspension and low terminal velocity of typical particles. It suggests that branched distri-bution networks will be self-cleaning if the daily maximum velocity exceeds 0.06 m s−1(Fig. 3), assuming that all
parti-cles have a diameter d<25µm and densityρs<1200 kg m−3
and exhibit non-cohesive behaviour.
Acknowledgements. The authors acknowledge PWN Water Supply North Holland for their co-operation and permission to publish the turbidity data.
Edited by: R. Farmani
References
Blokker, E. J. M.: Stochastic water demand modelling for a better understanding of hydraulics in water distribution networks, Civil Engineering and Geosciences, Ph.D. thesis, 205, 978-90-8957-015-4, 2010.
Blokker, E. J. M., Vreeburg, J. H. G., Schaap, P. G., and van Dijk, J. C.: The self-cleaning velocity in practice, Water Distribution System Analysis, Tucson, AZ, 12–15 September, 2010a. Blokker, E. J. M., Vreeburg, J. H. G., and van Dijk, J. C.:
Simulat-ing residential water demand with a stochastic end-use model, J. Water Res. Pl.-ASCE, 136, 19–26, 2010b.
Blokker, E. J. M., Schaap, P. G., and Vreeburg, J. H. G.: Compar-ing the foulCompar-ing rate of one drinkCompar-ing water distribution systems in two different flow configurations, Computing and Control in the Water Industry (CCWI), Exeter, September, 2011.
Brunone, B., Karney, B. W., Mercarelli, M., and Ferrante, M.: Ve-locity profiles and unsteady pipe friction in transient flow, J. Wa-ter Res. Pl.-ASCE, 126, 236–244, 2000.
Deltares: WANDA, pipeline simulation software, Deltares Soft-ware, 1993–2011.
Ebacher, G., Besner, M. C., Lavoie, J., Jung, B. S., Karney, B. W., and Pr´evost, M.: Transient Modeling of a Full-Scale Distribution System: Comparison with Field Data, J. Water Res. Pl.-ASCE, 137, 173–182, 2011.
Pothof, I. W. M.: A turbulent approach to unsteady friction, J. Hy-draul. Res., 46, 679–690, 2008.
Rossman, L. A.: EPAnet 2 User Manual, 2000.
Schaap, P. G. and Blokker, E. J. M.: Carefully designed measure-ments provide insight into sediment build-up in drinking water distribution systems, Computing and Control in the Water Indus-try (CCWI), Exeter, UK, September, 2011.
Soulsby, R. L.: Dynamics of marine sand, Thomas Telford, 1997. Vardy, A. E. and Brown, J. M. B.: Transient turbulent friction in
smooth pipe flows, J. Sound Vib., 259, 1011–1036, 2003. Vreeburg, J. H. G.: Discolouration in drinking water systems: a
par-ticular approach, PhD, Civil Engineering and Geosciences, Delft University of Technology, Delft, 183 pp., 2007.
Wylie, E. B. and Streeter, V. L.: Fluid Transients in Systems, Prentice-Hall, New York, 1993.