ABSTRACT
http://dx.doi.org/10.1590/1679-775720130030
Prediction of the mesiodistal size of unerupted
canines and premolars for a group of Romanian
children: a comparative study
Cornel Gheorghe BOITOR1, Florin STOICA2, Hamdan NASSER3
1- PhD Lecturer, Department of Preventive Dentistry, College of Medicine V. Papilian, Lucian Blaga University of Sibiu, Sibiu, Romania. 2- PhD Lecturer, Department of Mathematics and Informatics, College of Sciences, Lucian Blaga University of Sibiu, Sibiu, Romania. 3- Graduate student (MS), Orthodontics, Targu Mures University of Medicine and Pharmacy, Targu Mures, Romania.
Corresponding address: Cornel Gheorghe Boitor - Department of Preventive Dentistry, College of Medicine V. Papilian - Lucian Blaga University of Sibiu, Sibiu, Romania - B-dul. Victoriei, No. 10 - Phone: +400740175420 - email: [email protected]
6XEPLWWHG-DQXDU\0RGL¿HG0DUFK$FFHSWHG$SULO
O
bjectives: The aim of the present study was to develop an optimization method of multiple linear regression equation (MLRE), using a genetic algorithm to determine a set canine dimensions in a group of young people from a central area of Romania represented by a city called Sibiu. Material and Methods: To test the proposed method, we used a multiple linear regression equation derived from the estimation method proposed by Mojers, to 92 children were selected with complete permanent teeth with no clinically visible dental caries, proximal restorations or orthodontic treatment. A hard dental stone was made for each of these models, which was then measured with a digital calliper. The Dahlberg analyses of variance had been performed to determine the error of method, then the Correlation t !"# $ % &' * +-++!/ !"$0&1'34 %α56607 %$
the new and respectively old method, we can conclude that the Breeder genetic algorithm is capable of providing the best values for parameters of multiple linear regression equations, and thus our equations are optimized for the best performance. Conclusion: The prediction error rates of the optimized equations using the Breeder genetic algorithm are smaller than those provided by the multiple linear regression equations proposed in the recent study.
Key words: Regression analysis. Dentition mixed. Mesiodistal crown diameters. Genetic
algorithms. Romanian population.
INTRODUCTION
The estimation of the mesiodistal size of the permanent canine and of the two premolars before their eruption is important for the early evaluation of the need for space in this area and consequently to the mandible and maxillary. This represents an important part of diagnosis and orthodontic treatment strategy.
The estimation methods, performed during mixed dentition, can be grouped into three categories: those using multiple linear regression equations (MLRE), those using radiographs and those using
a combination of the two methods5-7,11,13,16.
Among these methods recently reported in the literature, those based on MLRE have the highest predictive capacity of the mesiodistal diameters (MDD) for unerupted canines and premolars. The prediction capacity of these methods can vary depending on the characteristics of constitutional types from different areas and it is sometimes possible to vary even in the case of the same country1-4,6-12,15,11,17,18.
Our aim was to verify, with the help of the MLRE recently used in the literature4,5, if the sizes
children from Sibiu, a city located in the central area of Romania.
$%% accuracy of a recently used MLRE, based on known variables, namely the mesiodistal diameters of teeth 42, 21 and 46, used in prediction of the sizes of unerupted teeth from the support area.
The second objective of the study was to use an evolutional calculation method based on the Breeder genetic algorithm, to optimize the !" the accuracy of the predictions can be improved10,13.
MATERIAL AND METHODS
A representative public school with a population of 321 children, 12-15 years old, from Sibiu (Romania) was selected for this study. From these subjects, a simple random technique was used to select 92 students (47 females and 45 males) /
J % K participate in the study;
J permanent teeth (molar 3 was not taken into consideration);
J $ of shape, size or structure;
J % $ in the mesiodistal size due to decay, trauma or orthodontic treatments that have provided stripping.
Dental impressions had been taken with alginate impression material and immediately poured with hard dental stone to avoid any distortion. To measure teeth size models we used a digital calliper manufactured by Vogel GmbH & Co. KG (Ossenpass 4, 47623 Kevelaer, Germany) with an accuracy of 0.01 mm.
Measurements were performed after the procedure proposed by Seipel12. All models were
measured 2 times by the same author and the result used was the average of the two values. * - between measurements and the method error (ME) was calculated using the Dahlberg formula:
where d is the difference between the two measurements and n is the number of patterns measured for the second time.
To estimate the size of the unerupted canines and premolars, we have chosen a recently proposed equation5 based on known variables 21, 42 and
X'# /Y5Z1 x A1 + X2 x A2+X3 x A3 + A, where Y is the outcome expected, X1, X2, X3 are independent variables determined by the size of the teeth 42, 46 and 21, A1, A2 and A3
The values of constant “A” and regression # $&
The following presents our approach based on Genetic Algorithms to optimize the regression $% % a more accurate method for prediction of the mesiodistal width of unerupted permanent canines and premolars.
Genetic Algorithms (GAs) are adaptive heuristic search algorithms based on the evolutionary ideas of natural selection and genetics. GAs are inspired by Darwin’s theory about evolution – “the survival ^_` direct the process of search through the space of possible solutions (also called the search space). Genetic Algorithms are widely used to solve optimization problems. An optimization problem is centered on an objective function, which is to be minimized or maximized. Imitation of natural selection and evolution is performed using the following genetic operators: selection, crossover and mutation. These operators are applied on a population of individuals called chromosomes which are possible solutions from the search space. Each ` $ gene is usually encoded by a binary value (0 or 1). % $$|$ thus: the selection operator is used to choose the best individuals from the current population using % } each pair of selected chromosomes, the crossover operator is applied, obtaining a new individual on which the mutation operator is then applied with a given probability established as an algorithm parameter (probability of mutation). The new chromosome is then inserted in a new population, and the process described above is repeated until all the necessary individuals are generated (the dimension of the population is also an algorithm parameter). Each new population represents a generation.
Because the parameters of the multiple linear regression equation are real values, we are using a Breeder genetic algorithm in order to avoid a weak point of classical GAs, represented by their discrete representation of solutions, which implies a limitation of the power of the optimization process.
The Breeder genetic algorithm, proposed by Mühlenbein and Schlierkamp-Voosen14 (1994)
represents solutions (chromosomes) as vectors of real numbers, much closer to the reality than normal GAs.
from the T% best chromosomes are selected two elements, and the crossover operator is applied over them. The mutation operator is applied on the new child obtained from the mate of the parents. The process is repeated until N-1 new individuals are obtained, where N represents the size of the initial population. The best chromosome (evaluated population (1-elitism). Thus, the new population will also have N elements.
The Breeder genetic operators
Z5Z&ZZ Y5Y&Y
Y $ F R and y
R
, i = 1,n. The crossover operator has as a result, a new chromosome, whose genes are represented by values zi = xi+ αi(yi-xi), i = 1,n, where αi is a random variable uniformly distributed between [-δ,1+ δ], andδ depends on the problem to be solved, typically in the interval [0,05].
The probability of mutation is typically chosen as 1/n. The mutation scheme is given by xi = xi
+ si. ri . ai, i= 1,n where: si 1& & uniform at random, ri is the range of variation for xi
as ri = r . domainxi , where r is a value in the range between 0.1 and 0.5 (typically 0.1) and domainxi is the domain of the variable xi and ai = 2-k.α where α
6& uniform at random and k is the number of bytes used to represent a number in the machine where the Breeder algorithm (mutation precision) is executed within .
The Breeder genetic algorithm
The skeleton of the Breeder genetic algorithm $ /
Procedure Breeder begin
56
Randomly generate an initial population P (t) of N individuals
"%- 5&1&
Randomly choose two elements from the T% best
elements of P(t)
Apply the crossover operator
Apply the mutation operator on the child Insert the result in the new population P’(t) end for
Choose the best element from P(t) and insert it into P’(t)
-&5-K 5& end while end
The optimization process
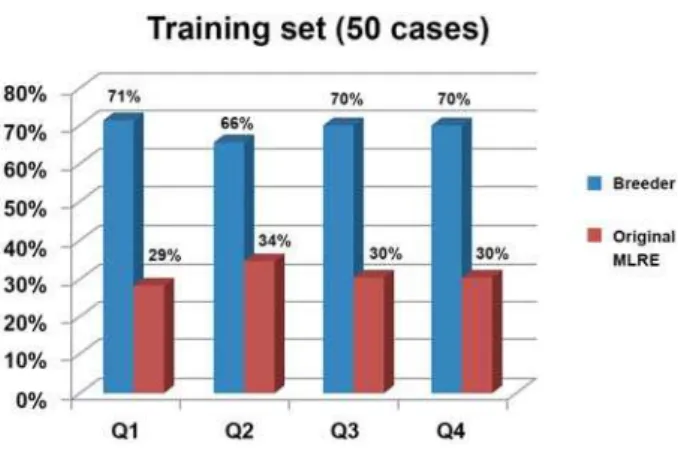
The aim of the Breeder genetic algorithm is to % linear regression equation presented in Figure 1, in order to reach a better prediction.
Each chromosome contains four genes, representing the real values Ai , i= 1,3 and A. The % represented by the number of cases from the training set, having an approximation error obtained with the new equation (in absolute value) bigger than the prediction error provided by the original equation. In our tests the parameters of the Breeder algorithm are assigned with the following values: δ
= 0, r = 0.1 and k = 8. The initial population has 1500
chromosomes and the algorithm is stopped after 30,000 generations.
Data provided by our study models was randomly divided into two sets: the training set, containing 50 cases and the validation set, composed by 42 study models.
Implementation of our new optimization method was accomplished in Java language, using Net Beans 7.01.
RESULTS
The MLRE method used two equations, one for the mandible and the other for the maxillary.
B e c a u s e t h e r e a r e d i f f e r e n c e s i n t h e measurements of teeth between the left and right quadrants for the mandible and maxillary, respectively, in order to improve the prediction, we
Canines premolars
group
A1 A2 A3
Constant A
-42 -46 -21
Maxillary 6.563 0.822 0.595 0.411
Mandible 3.35 0.872 0.71 0.538
Table 1- Parameters of multiple linear regression equation used3
are using four equations, one for each quadrant. Using the data from the training set, the Breeder % the initial multiple linear regression equation (Table 2). The accuracy of prediction made by optimized # % %
The order of reliability of both compared
prediction methods is the same. As we can see from
$ r calculated for
the all four linear regression equations is almost the same for the original MLRE equations as for the Breeder optimized equations.
In Figure 1 and Figure 2 the optimized and the original multiple linear regression equations are evaluated, respectively, using the number of cases better evaluated as criteria.
A comparison of prediction error in estimating the mesiodistal widths of the canines and premolars in the maxilla (quadrant 1 - 2) and mandible (quadrant 3 - 4) using multiple linear regression equations in original and optimized form, respectively, is presented in Figures 3-6.
Figure 2- Predictions on the validation set
Figure 3- The comparison of prediction error in quadrant 1
Figure 4- The comparison of prediction error in quadrant 2
Figure 5- The comparison of prediction error in quadrant 3
Figure 6- The comparison of prediction error in quadrant 4
Quadrant A A1 A2 A3
1 51.917 0.7571 0.85332 0.28341
2 516.292 0.90463 0.68192 0.41011
3 331.241 0.89357 0.72022 0.51352
4 328.732 0.70242 0.84793 0.47736 Table 2- Optimal values of parameters for multiple linear regression equations provided by the Breeder genetic algorithm
Quadrant Linear regression equations Original MLRE Optimized with
Breeder
1 0.546 0.572
2 0.509 0.510
3 0.671 0.671
4 0.625 0.664
DISCUSSION
The optimization using the Breeder genetic algorithm was made on all four quadrants, providing the equations presented in Figure 7.
where YQi denote the outcome expected for the quadrant i &X Z $ `
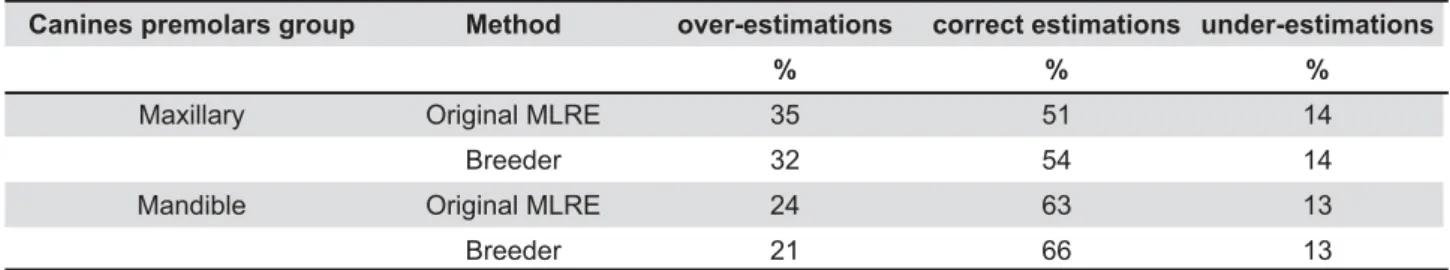
In our study, if the difference in millimetres between the measured and predicted value of the sum of the mesiodistal sizes of unerupted canines and premolars is situated in interval [-0.75, 0.75], the prediction is considered as a correct estimation, if the difference is <-0.75 mm, we have an overestimation, and a prediction error of >0.75 mm is considered an underestimation.
A c o m p a r i s o n o f c o r r e c t e s t i m a t i o n s , overestimations and underestimations, provided by the original MLRE3 and optimized equations,
respectively, is presented in Table 4.
Comparing predictions provided by the new and old method, respectively, we can conclude that the Breeder genetic algorithm is capable of providing the best values for the parameters of multiple linear regression equations, and thus our equations are optimized for best performance. The results obtained by the new multiple linear regression equations are significantly better
than those provided by some classical statistical approaches2,5,8.
The proposed technique is an adaptive tool for predicting the sizes of unerupted canines and premolars with greater accuracy than standard ensuring optimization of predictions for data collected from different groups selected from different countries.
CONCLUSIONS
Using a Breeder genetic algorithm, we can automatically find the optimal values for the parameters of multiple linear regression equations used in the prediction of the mesiodistal width of unerupted permanent canines and premolars.
After evaluation, we found that our new parameters, used in the regression equations, are providing a better prediction than the original MLRE method.
Thus, the prediction error rates of the optimized equations using the Breeder genetic algorithm are smaller than those provided by the multiple linear regression equations proposed in a recent study5.
YQ1 = 5.1917 + 0.7571 * X 42 + 0.85332 * X46 + 0.28341 * X21 YQ2 = 5.16292 + 0.90463 * X 42 + 0.68192 * X46 + 0.41011 * X21 Y
Q3 = 3.31241 + 0.89357 * X 42 + 0.72022 * X46 + 0.51352 * X21
YQ4 = 3.28732 + 0.70242 * X 42 + 0.84793 * X46 + 0.47736 * X21
Figure 7- The optimized equations using genetic algorithm
Canines premolars group Method over-estimations correct estimations under-estimations
% % %
Maxillary Original MLRE 35 51 14
Breeder 32 54 14
Mandible Original MLRE 24 63 13
Breeder 21 66 13
Table 4- Correct estimations, overestimations and underestimations in percentages
Quadrant Original MLRE Breeder
over-estimating under-estimating over-estimating under-estimating
1 -2.32 1.50 -2.11 1.23
2 -3.97 2.21 -3.56 1.84
3 -2.13 1.14 -1.86 1.01
4 -2.15 2.25 -2.01 1.93
REFERENCES
1- Abu Alhaija ES, Qudeimat MA. Mixed dentition space analysis in a Jordanian population: comparison of two methods. Int J Paediatr Dent. 2006;16(2):104-10.
2- Alessandri Bonetti G, Verganti S, Zanarini M, Bonetti S, Gatto MR. Mixed dentition space analysis for a northern Italian population: new regression equations for unerupted teeth. Prog Orthod. 2011;12(2):94-9.
3- Bernabé E, Flores-Mir C. Appraising number and clinical significance of regression equations to predict unerupted canines and premolars. Am J Orthod Dentofacial Orthop. 2004;126(2):228-30.
4- Bernabé E, Flores-Mir C. Are the lower incisors the best predictors for the unerupted canine and premolars sums? An analysis of a Peruvian sample. Angle Orthod. 2005;75(2):202-7. 5- Boboc A, Dibbets J. Prediction of the mesiodistal width of unerupted canines and premolars: a statistical approach. Am J Orthod Dentofacial Orthop. 2010;137(4):503-7
'1 % % % ! # for determining mesiodistal crown diameters of canines and premolars. Angle Orthod. 2003;73(3):314-8.
31%%+ %% N. A comparison of methods for predicting the size of unerupted permanent canines and premolars. Eur J Orthod. 2006;28(5):485-90.
8- Lima Martinelli F, Martinelli de Lima E, Rocha R, Sousa Tirre-Araújo M. Prediction of lower permanent canine and premolars width by correlation methods. Angle Orthod. 2005;75(5):805-8. 9- Melgaço CA, Araújo MT, Ruellas AC. Applicability of three tooth size prediction methods for white Brazilians. Angle Orthod. 2006;76(4);644-9.
10- Melgaço CA, Sousa Araújo MT, Oliveira Ruellas AC. Mandibular $ canine and premolar width. Am J Orthod Dentofacial Orthop. 2007;132(3):340-5.
11- Memon S, Fida M. Development of a prediction equation for the estimation of mandibular canine and premolar widths from $ "} 2012;34(3):340-4.
12- Moghimi S, Talebi M, Parisay I. Design and implementation of $ for predicting the sizes of unerupted canines and premolars. Eur J Orthod. 2012;34(4):480-6.
13- Moyers RE. Handbook of orthodontics. Chicago: Year Book Medical Publishers; 1988.
14- Mühlenbein H, Schlierkamp-Voosen D. The science of breeding and its application to the breeder genetic algorithm. Evol Comput. 1993;1(4):335-60.
15- Nourallah AW, Gesch D, Khordaji MN, Splieth C. New regression equations for predicting the size of unerupted canines and premolars in contemporary population. Angle Orthod. 2002;72(3):216-21.
16- Pancherz H, Schäffer C. Individual-based prediction of the supporting zones in the permanent dentition. A comparison of the Moyers method with a unitary prediction value. J Orofac Orthop. 1999;60(4):227-55.
17- Philip NI, Prabhakar M, Arora D, Chopa S. Applicability of the Moyers mixed dentition probability tables and new prediction aids for a contemporary population in India. Am J Orthod Dentofacial Orthop. 200;138(3):339-45.