RESEARCH ARTICLE
Distilling a Visual Network of Retinitis
Pigmentosa Gene-Protein Interactions to
Uncover New Disease Candidates
Daniel Boloc1, Sergio Castillo-Lara1, Gemma Marfany1,2,3, Roser Gonzàlez-Duarte1,2,3‡*,
Josep F. Abril1,2‡*
1Departament de Genètica, Facultat de Biologia, Universitat de Barcelona, Barcelona, Catalonia, Spain, 2Institut de Biomedicina (IBUB), Universitat de Barcelona, Barcelona, Catalonia, Spain,3CIBERER, Instituto de Salud Carlos III, Barcelona, Catalonia, Spain
‡These authors are joint senior authors on this work. *[email protected](JFA);[email protected](RGD)
Abstract
Background
Retinitis pigmentosa (RP) is a highly heterogeneous genetic visual disorder with more than 70 known causative genes, some of them shared with other non-syndromic retinal dystro-phies (e.g. Leber congenital amaurosis, LCA). The identification of RP genes has increased steadily during the last decade, and the 30% of the cases that still remain unassigned will soon decrease after the advent of exome/genome sequencing. A considerable amount of genetic and functional data on single RD genes and mutations has been gathered, but a comprehensive view of the RP genes and their interacting partners is still very fragmentary. This is the main gap that needs to be filled in order to understand how mutations relate to progressive blinding disorders and devise effective therapies.
Methodology
We have built an RP-specific network (RPGeNet) by merging data from different sources: high-throughput data from BioGRID and STRING databases, manually curated data for interactions retrieved from iHOP, as well as interactions filtered out by syntactical parsing from up-to-date abstracts and full-text papers related to the RP research field. The paths emerging when known RP genes were used as baits over the whole interactome have been analysed, and the minimal number of connections among the RP genes and their close neighbors were distilled in order to simplify the search space.
Conclusions
In contrast to the analysis of single isolated genes, finding the networks linking disease genes renders powerful etiopathological insights. We here provide an interactive interface, RPGeNet, for the molecular biologist to explore the network centered on the non-syndromic and syndromic RP and LCA causative genes. By integrating tissue-specific expression OPEN ACCESS
Citation:Boloc D, Castillo-Lara S, Marfany G, Gonzàlez-Duarte R, Abril JF (2015) Distilling a Visual Network of Retinitis Pigmentosa Gene-Protein Interactions to Uncover New Disease Candidates. PLoS ONE 10(8): e0135307. doi:10.1371/journal. pone.0135307
Editor:Alfred S Lewin, University of Florida, UNITED STATES
Received:February 12, 2015
Accepted:July 20, 2015
Published:August 12, 2015
Copyright:© 2015 Boloc et al. This is an open access article distributed under the terms of the Creative Commons Attribution License, which permits unrestricted use, distribution, and reproduction in any medium, provided the original author and source are credited.
Data Availability Statement:All relevant data are within the paper and its Supporting Information files. Further information, as well as updates are already publicly available through the RPGeNet web site [https://compgen.bio.ub.edu/RPGeNet/].
2009-SGR-levels and phenotypic data on top of that network, a more comprehensive biological view will highlight key molecular players of retinal degeneration and unveil new RP disease candidates.
Introduction
Retinitis pigmentosa (RP) is a highly heterogeneous genetic disorder with more than 70 known causative genes (see Retinal Information Network web site, RetNet [1]). It is the most common form of retinal dystrophies (RD), characterized by rod (responsible for dim light vision) and cone (daylight) photoreceptor cell degeneration resulting in night blindness and progressive vision loss [2]. Its prevalence is 1 in 4,000 individuals, following the Mendelian patterns of inheritance: autosomal-dominant (30–40% of cases), autosomal-recessive (50–60%) and X-linked (5–15%) [3]. Other reported inheritance patterns, such as digenic or mitochondrial, only account for a small portion of cases.
The identification of genes causing RP and closely related non-syndromic retinal dystro-phies (such as Leber congenital amaurosis, LCA) has increased steadily during the last decade, yet around 30% of the cases remain unassigned. Therefore, present challenges in RDs are the identification of novel genes, the understanding of the main cellular processes altered in this group of pathologies, and the design of effective therapies to halt, ameliorate or cure the disease [3].
Although a considerable amount of genetic and functional data on single RD genes and mutations has been gathered, a comprehensive view is still missing to navigate through gene functions, cellular pathways and pathogenicity. In contrast to the analysis of single isolated genes, finding the networks that link disease genes provides powerful etiopathological insights. Indeed, molecular medicine based on gene and protein networks has been rapidly expanding and has shown that most disease-causing genes often work together, either forming a protein complex or participating in the same signaling pathways, clearly underscoring the connection between disease and gene/protein networks [4].
Network-based approaches are becoming increasingly valuable to analyze complex systems of interaction, and also to explore high dimensional data. The whole functional and regulatory cell network is made up by a myriad of molecular interactions, either physical—where direct associations between molecules constitute protein complexes, signaling and metabolic path-ways—, or genetic—where regulation of gene expression, mediated by transcription factors and interfering RNAs, translates into phenotype—[5]. This strategy has already been instru-mental in the identification of causative genes in breast cancer, schizophrenia, and cerebral ataxias, among others [6–12]. Complex behaviors emerge with the visualization of network interactions among the proteins/genes involved in a specific disease, and project beyond direct physical interactions, since these molecular components play multiple roles in a pathway, regu-late transcription and splicing processes, and even contribute to larger functional complexes without actually physically contacting each other. Finally, networks could also be useful to elu-cidate new candidates, highlighting genes that have connections to known disease genes, or linking two or more disease genes (acting as a bridge).
The advent of exome and genome sequencing has provided an extremely useful tool for rou-tine genetic diagnosis and novel gene search for highly heterogenous hereditary disorders, such as RP. However, prioritization of previously reported and new candidates after identification of exome-based genetic variants, and assessment of their pathogenicity remain a bottleneck in
001018 (JFA) (Generalitat de Catalunya). The funders had no role in study design, data collection and analysis, decision to publish, or preparation of the manuscript.
molecular diagnosis. Indeed, to provide a more comprehensive view of the molecular and cellu-lar basis of the disease, which is indispensable to approach efficient therapy, we need new tools and paradigms. This type of approach has already been explored by geneticists and network researchers, but the networks generated are usually not searchable[11,13]. A web application, such as RPGeNet, may become a useful tool for research in rare diseases, similarly to the interactome databases for disease currently being implemented in the world of cancer research [14–16]. Although current available gene-centric tools allow to navigate through interactions, such as GeneMANIA [17,18], or facilitate the reconstruction of disease subnetworks from expression profiles, like EgoNet [6], in the field of retinal diseases there is no such a tool to visualize specific gene or protein interactions among RP/LCA causative genes. Consequently, information has to be gathered from many complex databases, a burdensome and time-con-suming task for most researchers. In this context, one of our aims was to develop a user-friendly searchable web application, RPGeNet [19], that integrates all the physical and genetic interactions obtained from different databases, as well as other relevant genetic and functional data, i.e. tissue-specific expression levels and the frequency of genetic variants per gene. This tool is specifically focused on the interactions subnetwork for the RP/LCA genes.
Results and Discussion
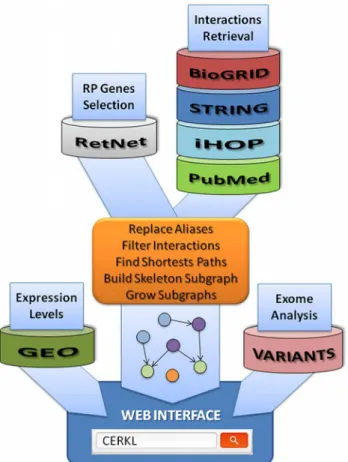
We expected to identify shared molecular functions and mechanisms, indicating new potential causative candidates and disease-modifying genes as well as novel targets for efficient therapies. Our approach relied on the connectivity of the resulting networks generated by integrating: 1) protein-protein (BioGRID [20,21], STRING [22]) and gene-gene (STRING) high-throughput (HT) data; 2) manually curated data from the Information Hyperlinked over Proteins (iHOP) repository [23], which facilitates syntactical searches by keyword for interactions from the sci-entific literature; and finally, 3) relevant related published information, available from PubMed [24], on protein/gene interactions specific for non-syndromic RP and LCA plus a selection of syndromic RP/LCA genes. The list of the 110 genes used as baits in this analysis is provided in theS1 Table(selected from RetNet, details in the Methods section). Once all the interactions were selected, we used a Perl script to generate an initial skeleton (level 0) of interactions from which the network at different distances was grown by adding up neighborhood nodes. Indeed, when more levels were added to the network, it became very noisy and overpopulated, hamper-ing the visualization of connections or patterns that were evident at lower levels.Fig 1provides a general overview for the whole process.
When building the network, we focused on an integrated approach where the total interac-tions retrieved from the aforementioned sources were used as the global RP/LCA database (summarized in column“ALL DBs”inS2 Table). Overall, after screening the collected interac-tions spanned to as many as 63,139 nodes (genes and proteins) and 1,688,656 edges (interac-tions). Within the whole set of nodes, we were able to detect as much as 103 RP genes. The genesC2orf71,DTHD1,HGSNAT,IMPG2,KCNJ13,PRCD, andSLC7A14, most of them iden-tified recently, remain unconnected and clearly demand further functional studies to integrate them in an interaction network.
One of the main efforts was to produce a core set of interactions, using the shortest path connecting every pair of RP genes. The second section ofS2 Tablesummarizes the graph prop-erties of the skeleton network. The resulting graph for the skeleton RP subnetwork has 1,287 nodes and 5,883 edges (seeFig 2). On top of the skeleton graph, for the whole network we have projected the skeletons built from the two subsets of RP/LCA genes, non-syndromic and syn-dromic, using a color code, which is synchronized with the Venn diagram at the bottom left.
We provide the gene symbols of the highly connected RP/LCA skeleton nodes (more than 40 connections), and the 7 genes that remain unconnected (nodes at the bottom right).
The high connectivity degree hampers the visualization of particular interactions, even though the graph has a low density value and merely represents 7.8 per thousand of all possible connections. This distilled skeleton graph was used as the basic aggregating network that was progressively expanded into a multilevel approach following a“parent-to-child”(aka“source to target”) interaction bidirectional growth, from levels 1 to 4. The growth of the recovered interactions for each RP gene per level is illustrated inS3 Table. A saturation of the retrieved interactions between nodes is reached at level 1 for most of the RP genes, which is consistent with the protocol applied as the parent and child nodes outside the shortest paths between RP/ LCA genes are added on the first iteration over the skeleton graph. Notably, the average degree for the whole set of nodes on the skeleton and level 1 graphs is 9.14 and 33.0 respectively, while the average degree of the RP/LCA genes at each level ranges from 22.1 up to 59.6, converging to that value at level 2 iteration (see bottom rows ofS3 Table). Considering this analysis of the network expansion, we estimate that level 1 provides a reasonable core network to link RP/ LCA causative genes with other putative candidates involved in the disease. Indeed, the size of the core network has a direct impact on the usability of the interactive visualization, even when producing static views of the net. As it is widely accepted in the field, the connectivity degree of
Fig 1. Schema of the protocol used to derive the RP/LCA genes network.Driver (RP/LCA) genes were selected from RetNet, while interactions were gathered from a variety of sources. Main script combines such information to build the driver subnetwork that is the kernel of the web interface. Further information, such as gene expression or number of reported polymorphisms, is integrated when navigating through the selected paths.
a given node does not need to reflect its real biological relevance in the whole network, although those nodes that are important for a given function can be often detected as sub-net-work hubs [16,25]. However, connectivity can be also biased towards the“popularity”of the gene/protein defining a node, as the interest of the scientific community in a specific gene could be not directly related to its molecular role [26]. Therefore, for the webapp visualization of the network we have not relied on connectivity to weight the node size, and instead relied on other biological features, such as number of genetic variants (reported polymorphisms and
Fig 2. Skeleton graph for the shortest paths between pairs of RP/LCA genes.RP/LCA genes were split into three sets: those annotated as non-syndromic (75 genes), those as syndromic (35 genes), and a third set containing both (110 genes). A skeleton graph based on the shortest paths was built for each of those three sets. The resulting graphs for the two small sets were projected over the complete one; this intersection provides clues on the nodes and interactions captured using each driver genes sets. Left bottom Venn diagram summarizes the number of nodes (in bold face) and interactions (in italics). At the same time, it provides a color legend to explain the source of the nodes and interactions drawn on the main graph plot. Labels of the highly connected nodes (those having more than 40 incoming or outgoing edges), as well as for the 7 driver genes that remain unconnected, show the corresponding HUGO symbol identifier. It is worth to mention that dark green nodes are mainly defined by genes/proteins providing new paths to connect non-syndromic and non-syndromic genes.
doi:10.1371/journal.pone.0135307.g002
mutations, as detailed in the Methods section). Finally, it has been described that higher aver-age clustering coefficient is correlated with a high level of redundancy and cohesiveness [27], which is reflected in the corresponding rows ofS2 Tablewhen comparing the aforementioned variable on skeleton versus level 1 graph.
Before merging the data, we have assessed the specific contribution of each dataset to the connectivity of the core net; for this purpose, a preliminary set of 62 non-syndromic RP genes was used. Two complementary approaches were considered: interactions derived from syntac-tic analysis of the literature and data produced by high-throughput means. Literature-curated data usually have a biological context, which supports the physiological relevance of the retrieved interactions, but it is clearly biased towards well-known genes and proteins. In con-trast, Omics data is unbiased but lacks context, which hampers the assignment of functional roles. This is reflected inS2 Table, when comparing the summary columns of Sparser (Stan-ford-parser syntactic analysis) and iHOP (pre-computed syntactic analysis) with those of Bio-GRID and STRING (HT repositories). Concerning syntactic analyses, we complemented the manually curated data retrieved from iHOP (a well-established interaction database) by per-forming a custom automated syntactic analysis (Sparser) on electronic Abstracts and Full Texts from articles recovered specifically after a general search for“retinitis pigmentosa”. This combined approach has provided valuable data, recovering 28 new interactions and connecting 11 additional nodes in the skeleton graph, since there has been an explosion of articles describ-ing interactions for the RP genes in the last five years, which were not well represented in our manually-curated set derived from iHOP (illustrated in theS1 Figupper panel histogram, as well as in the small overlap between the two sets shown inS2 Figpanel 3 Venn diagram).
When considering all the interactions among the RP/LCA genes from the skeleton graph, the number of intermediate nodes can be calculated to provide a distance value between each pair of nodes. A diagram summarizing incoming and outgoing connections for all genes and its growth from distance 1 to 6 is shown inFig 3. The genes with only outgoing or incoming connections group with those unconnected. Remarkably, the functions of all these genes is mostly unknown. On the other hand, genes encoding splicing factors (e.g. PRPF factors), enzymes (e.g. subunits of the PDE6, kinases such as MAK, MERTK, MVK) and ciliary proteins (NPHP proteins) show an equilibrated incoming and outgoing connectivity. It is worth men-tioning that when dissecting the interactions by measuring the pairwise distance (seeS3A Fig), proteins involved in functional high molecular complexes (spliceosome factors, retinal specific transcription factors, phototransduction) or localized in specialized subcellular compartments (peroxisome, ciliary body. . .) become apparent at distance 1. This effect is mostly contributed
by non-syndromic genes (as can be noticed when comparing plots fromS3B FigandS3C Fig). As a result of the high connectivity degree already mentioned–S3 Table, average incoming degree of 9.87 and outgoing degree of 12.22–we observe most of the pairwise shortest path con-nectivity for RP/LCA driver genes at distance 3. The biological explanation is that an average of 2 intermediate non-RP nodes are required to link RP/LCA genes, which provide future candi-dates to focus on functional studies as well as in genetic analyses. Notably, the connectivity of syndromic genes saturates at level 4 (S3C Fig), indicating a higher density of connections at lower levels and supporting the pleiotropic effects produced depending on the gene mutation.
Fig 3. Summary of the RP/LCA genes pair-wise connectivity.On the outer ring of the diagram we have depicted the standard symbols for the 110 RP/LCA genes used to build the network, sorted first by the number of incoming, then by outgoing connections, and finally, by alphabetical order. Each driver gene that interacted with another RP/LCA gene is shown by a distinct color box, while those for which there was no reported interaction are shown in black. The colored boxes are divided in two moieties: the lighter half groups all the outgoing connections—thus reflecting a directed path starting from the current RP node—, whereas the darker half gathers all the incoming connections—indicating a directed path ending at the current RP node. This differentiation in two halves facilitates to spot genes upstream (e.g.CLRN1andRD3)or
downstream(e.g.ROM1andEMC1)of many others in the network, or even internal hubs (e.g.CERKL,CRX, andRP2). This figure was obtained using Circos [28]. Further details and pairwise connectivity growth for all, non-syndromic and syndromic gene sets are available inS3 Fig.
doi:10.1371/journal.pone.0135307.g003
Fig 4. RPGeNet visualization focusing on CRX, NRL and RHO partners.Snapshot of the customized network of interaction partners retrieved from RPGeNet when querying forCRX,NRLandRHOgenes. This node distribution was derived from a basic circular layout, manually rearranged on the webapp by the researcher to underscore the relationships among those three genes. Neighbor nodes at distance 1 were requested upon the basic skeleton graph (level 0). The RP/LCA genes are highlighted by a light violet border in contrast to the grey colored non-RP genes, square nodes indicate syndromic RP/LCA genes. The node size is proportional to the number of variants in coding regions (neutral or mutagenic). The core color reflects the relative expression level in retina with respect to the average in all tissues, as calculated from the GEO GSE7905 dataset. The shades range from blue (over-expressed in retina) to yellow (under-expressed). Edges connecting the query RP/LCA genes were drawn in red, just taking advantage of the edge selection feature available from the webapp.
doi:10.1371/journal.pone.0135307.g004
RP syndromicOTX2(depicted as a square node). This comprehensive approach gives very valuable information in a single picture, spotting some of the genes encoding known transcrip-tion factor protein complexes, such asCRX,NRL,NR2E3,OTX2,OTX1,CREBBP, and adding some chromatin remodeling partners, e.g.HDCA1,BANF1. . .which could play a role in the
regulation of relevant retinal genes. Another illustrative example is the unveiling that two other relevant genes causing distinct neurodegenerative disorders a priori unrelated to the retina, ATXN7andPARK2, interact withCRX.ATXN7was initially described as one of the main fac-tors causing human ataxia, but has recently been involved in macular degeneration after being revealed by interaction network analysis [11]. On the other hand,PARK2is one of the causative genes of Parkinson’s Disease, which encodes a ubiquitin E3 ligase involved in autophagy. The formation of autophagosomes is extremely relevant for the retinal homeostasis, andPARK2 protects the retina from light-induced degeneration.
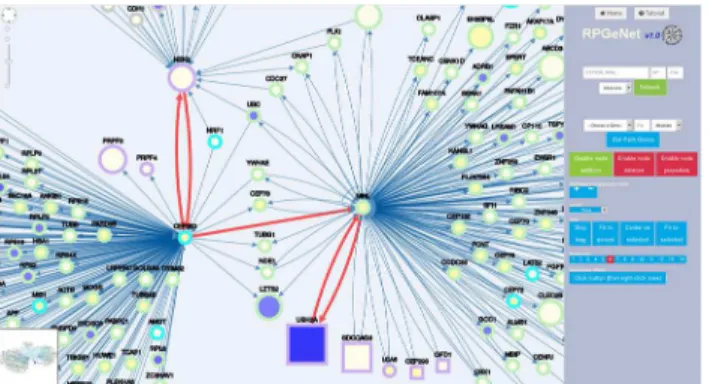
Direct queries using genes that have not been reported to cause RP can also be performed to search for specific new disease candidates.Fig 5illustrates the network generated after querying forCEP250, selecting neighboring nodes 2 on the level 1 subnetwork (built by adding all the nodes that are at distance one from those at the skeleton graph). Notably, up to eight RP/LCA genes appear in the network centered on this gene. Particularly, it is located in the linking path betweenNEK2toUSH2A,SDCCAG8,LCA5,CEP290, andOFD1, highlighting its relevance in retinal molecular pathways. In this context, the late report combining mutations inCEP250 withC2orf71associated to severe deafness and blindness (Usher syndrome) emphasizes its probable role as a RP causative or a disease-modifying gene [29]. Indeed, this figure also emphasizes the hub status ofCEP250next neighbor,NINL, which not only interacts with many proteins but links Usher syndrome and Leber congenital amaurosis (two syndromic severe retinal disorders) in agreement with being an excellent candidate for causing ciliopathies and other retinal disorders [30].
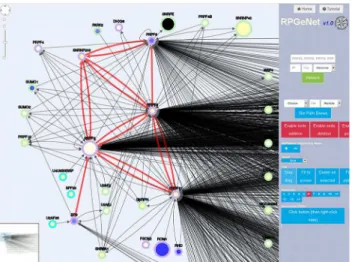
Fig 6specifically focuses on the RP genes involved in splicing and their closest interactors, namely, the query includedPRPF3,PRPF6,PRPF8,PRPF31,SNRP200andRP9, selecting neighboring nodes at distance 1, over the graph at level 1. Again, the red links highlight the interactions among the queries. The PRPF proteins are tightly connected among them and highly connected to other target nodes. Notably, and in comparison with the previous example
Fig 5. RPGeNet-mediated discovery of putative RP/LCA-genes pathways.Snapshot of the RPGeNet generated graph, where the nodes have been reordered to show the interactions, captured when searching for nodes at distance 1 ofCEP250upon the level 1 subnetwork. This query using a non RP-gene retrieved a sub-network that includes 8 RP/LCA-genes (four of which are non-syndromic). As described in the Results section,CEP250conforms a specific pathway relatingNEK2(RP gene) toUSH2A(a gene causing RP and Usher syndrome), viaNINL(edges highlighted in red). These bridging genes are all good candidates to contribute to retinal dystrophies. The RP/LCA genes are highlighted by a violet border, while border color for “parent”and“child”nodes is indicated by light blue and green, respectively. The shape, border and core color, as well as node size, are defined as inFig 4.
(Fig 5), only five additional RP genes,RHO,ROM1,FCSN2,DHDX38andPFPF4(also a com-ponent of the spliceosome) appear in this network, which is in accordance to their relevant role in a ubiquitous basal cellular process (splicing) that affects many target genes, not exclusive of the retina. The ubiquitous role of the splicing machinery proteins may be reconciled to the unique affectation in the retina when considering the high transcriptional diversity of retinal genes due to the complexity of alternative splicing, as revealed after high-throughput transcrip-tome analyses in this tissue [31]. This extremely high heterogeneity of transcript isoforms has been reported even in single RP genes (CERKL[32]). Of note, a very late report showed a neu-ral-regulated alternative splicing program regulated by specific neuronal splicing factors, and associated to human neurological disorders [33]. In this context, it is worth mentioning that a pathogenic mutation in a retina-specific exon ofTTC8(a gene otherwise causative of the Bar-det-Biedl syndrome) exclusively causes RP [34].
Although network-based approaches are powerful tools to approach pathogenesis at the molecular basis, several challenges remain to be addressed. Some methodological issues deserve improvement, among them: the literature bias towards well-known proteins and genes; the high number of symbol aliases for the same gene/protein hampers the accuracy of the interac-tion retrieval; the filtering step over iHOP reference interacinterac-tions has to be performed manually and thus, it is subjective; the computational restraints caused by the high number of interac-tions to consider; and finally, the development of new ways to visually integrate all the available information at the different levels to avoid clogging the graph generation.
On the other hand, the informativity and usefulness of networks increase with the addition of further relevant biological information. Most of the high-throughput data in repositories are based on cell line-based studies, which do not always reflect the subtle functional differences of highly specialized tissues, like specific neuronal tissues, such as the retina, or its highly special-ized cells, such as photoreceptors. Besides, other relevant data should be also considered when building networks to understand etiopathogenesis, for instance: gene regulation at the epige-netics layer, transcriptional regulation by miRNAs and lnRNAs, different contribution of
Fig 6. Network of RP/LCA genes involved in splicing and their partners.RPGeNet snapshot of the edited graph derived from the original grid layout (ordered by connectivity of the nodes, from left to right, and top to bottom) when the query was performed with the RP genes involved in the splicing machinery, namely
PRPF3,PRPF6,PRPF8,PRPF31,SNRP200, andRP9. In this case, neighbor nodes at distance one were
requested upon the level 1 graph. The shape, border and core color, and node size are defined as inFig 5. Edges connecting the query RP genes were drawn in red. Note that five additional RP/LCA genes were also retrieved by this query:RHO,ROM1,FCSN2,DHDX38andPFPF4.
doi:10.1371/journal.pone.0135307.g006
alternatively spliced isoforms, accurate subcellular protein localization and trafficking, all of which are currently expanding our view on gene/protein interactions and their relationship to the disease. Indeed, we contemplate to regularly refine our model by updating the core dataset with newly identified genes and novel interaction reports, to keep it a valuable resource for researchers working in RP and related retinal disorders.
Conclusions
The great wealth of publicly available information either in the literature and high-throughput data repositories could be extremely useful to answer specific queries if big data approaches were properly customized to retrieve and process data. Although there are multiple generic online resources to build genetic and protein networks, our aim was: first, to generate a com-prehensive and integrated dataset for a rare mendelian disorder and, second, develop a user-friendly web application for geneticists based on this curated dataset, RPGeNet. The differenti-ating traits of our approach are: i) the focus on the genes causing retinitis pigmentosa and their known interactors (the core network was built around the 110 RP/LCA genes reported so far); ii) the generation of a tailored subgraph (which allows a very specialized search, and a step-by-step visualization of the query interactors); iii) the submission of queries through any gene (RP and non-RP) located in the RP/LCA network (from the skeleton graph derived from the shortest paths between RP and LCA genes, to up to 2 levels of distance); and iv) the inclusion of relevant biological information at a glance through shape, color and size code of the nodes. The exploratory data analysis through the RPGeNet interface facilitates the visualization of key molecular components linking RP genes. Bridging nodes are valuable to prioritize gene candidates within loci revealed by linkage analysis and identify putative pathogenic mutations out of the large amount of genetic variants revealed by exome sequencing. Overall, disease-based networks open new avenues to study etiopathogenesis, unveil valuable causative and dis-ease-modifying candidates, and provide clues to approach therapy.
Methods
Gathering RP genes
The standard HUGO symbols [35] for the set of 110 RP/LCA genes were retrieved from RetNet [1], as well as the corresponding synonym identifiers. RetNet provides tables of genes and loci causing inherited retinal diseases. For this work, we have considered all non-syndromic retini-tis pigmentosa (RP) and Leber congenital amaurosis (LCA) genes, plus selected syndromic genes with clear RP or LCA phenotypic traits according to RetNet.S1 Tablesummarizes infor-mation for those genes, which were used to define the core nodes of our interactions network. This table contains links to their corresponding genomic location (human genome hg19 at UCSC genome browser [36]), the Online Mendelian Inheritance in Man (OMIM [37]), NCBI Gene [38] and RefSeq [39], as well as UniProt [40] databases. The RP/LCA causative genes fol-low different Mendelian inheritance patterns (dominant, autosomal recessive, and X-linked), and are involved in multiple cellular processes, as described inTable 1, where other genetic details are also provided (e.g. genes involved in both syndromic and non-syndromic RP/LCA; genes causing several retinal dystrophies).
Collecting interactions data
binary). Therefore, different suitable datasets were selected. A hand-curated list of interacting partners was retrieved by searching for a subset of 62 selected non-syndromic RP gene symbols over the iHOP interactions database [23,41], which is based on relationships mined from the scientific literature. A table of 141 confident interaction partners was manually built after care-fully inspecting the sentences provided by the iHOP search engine; this table defined 117 edges that link 95 nodes.
On the other hand, in an attempt to recover the most updated gene and protein relation-ships information, we syntactically parsed interaction sentences filtered out from PubMed abstracts as well as the full text electronic versions (ePub) when available (Castillo-Lara and Abril, manuscript in preparation). The initial query“retinitis pigmentosa”(on October 1st, 2014), restricted to“Journal articles”on PubMed server, returned 8,768 abstract hits, of which 1,204 had full-text available; from those 8,768 hits, we were able to retrieve the abstract only for 6,251. This approach is referred throughout the manuscript as“Sparser”because it is based on the Stanford parser (version 3.5.0 [42]). This tool was used to analyze 54,185 and 347,034 sen-tences, for abstract and full-text, respectively, resulting on 64 and 628 raw interactions (60 and 440 distinct interactions). The first two Venn diagrams onS2 Figshow the overlap across nodes and edges identified by this approach.
Table 1. A summary of the functional annotation for RP/LCA driver genes.
Functional Annotation Syndromic RP/LCA Non-syndromic RP/LCA
Development of retina and or its components
CLRN1*,GDF6*,NEUROD1*,OTX2 C2ORF71,ZNF408#,ZNF513
Photoreceptor specific transcription factor
CRX#,NRL,NR2E3#
Phototransduction CNGA1,CNGB1,GUCY2D,PDE6A,PDE6B#,PDE6G,
PRPH2#,RHO#,SAG#,
Vitamin A (retinol) metabolism RDH11 ABCA4#,LRAT#,RGR#,RDH12#,RLBP1#,RPE65#
Lipid synthesis/modification INPP5E CYP4V2#,DHDDS,MVK
Structural or cytoskeletal BBS1*,BBS2*,OFD1* EMC1,EYS,FSCN2#,IMPG2,PROM1#,ROM1,RP1,
TULP1#
Signaling, cell-cell interactions, or synaptic interaction
ABHD12,TUB,USH2A* CABP4,CRB1#,GUCA1B#,RP2,SEMA4A#
RNA intron-splicing process DHX38,PRPF3,PRPF4,PRPF6,PRPF8,PRPF31,RP9,
SNRP200 Formation/maintenance of ciliated
cells
AHI1,ARL6*,CC2D2A,CEP290*,IQCB1*,INVS,
NPHP1,NPHP3,NPHP4,SDCCAG8,TTC8*
FAM161A,LCA5,RPGR#,RP1L1#
Spindle formation IFT172* KIZ,NEK2
Ubiquitin/SUMO pathways KLHL7,TOPORS
pH regulation CA4
Transport FLVCR1 AIPL1#,ARL2BP,RD3#,RBP3,SLC7A14
Phosphorylation PANK2,PRPS1 HK1,MAK
Peroxisomal biogenesis/import HSGNAT*,PEX1,PEX2,PEX7
Phagocytosis MERTK#
Orphan receptor GPR125
Olfactory receptor OR2W3
Other/unknown functions DTHD1*,GNPTG,PHYH,TTPA BEST1#,C8ORF37#,CERKL#,IDH3B,IMPDH1#,KCNJI3#,
KIAA1549,NMNAT1,PRCD#,RPGRIP1#,SPATA7#
*Mutations in this gene can cause both syndromic and non-syndromic forms of RP or LCA
#Mutations in this gene can cause RP as well as other retinal dystrophies
doi:10.1371/journal.pone.0135307.t001
High-throughput interaction data were retrieved from BioGRID (version 3.2.117 [20,21]) and STRING (Search Tool for the Retrieval of Interacting Genes/Proteins, version 9.1 [22]). Raw pair-wise protein and gene interactions were downloaded from the former: 15,394 nodes connected by 159,034 edges were retrieved out of 232,888 human-specific interactions (this database stores 761,693 total interactions). On the other hand, STRING focuses on known and predicted protein-protein interaction (PPIs): 15,999 nodes and 640,679 edges were considered out of 926,130 human-specific interactions (database has 114,926,847 total interactions).
Reconstructing the RP interactions network
A Perl script was implemented to capture the interactions subnetwork based on a set of refer-ence genes, in our case the RP/LCA genes. In order to disambiguate node names and ensure the maximum number of occurrences for the driver genes, once a whole interaction set was col-lected, all the symbols were mapped into the standard name by using tables of aliases retrieved also from the interactions databases and verified against HGNC symbol tables. RP/LCA genes were then used to find all the possible pair-wise shortest paths by applying the Dijkstra algo-rithm implemented in the Graph Perl module. Graph::Directed module was used to define the whole network data structure as a directed graph, which simplified the calculations for the RP/ LCA subnetwork.
The script produced a skeleton graph and up to four expansion levels; each expanded level included those nodes at distance one of the current level nodes (namely new parent and child nodes). Some of the RP/LCA genes connections (considered here as the node degree) saturated earlier than others, as it can be observed onS3 Table. Graphs were stored in three different standard formats: GraphViz simplified dot format to facilitate automated analyses—GraphViz commands were used in early steps to visualize the nets—; graphml to store information about edges, such as supporting evidences and database of origin; and finally, JSON to make data available on the RPGeNet web interface [19].
Dot files were processed using Gephi [43] to compute statistics on the graphs and visualize whole-networks at distinct levels. For drawing those networks, Yifan Hu proportional [44] fol-lowed by Force Atlas 2 [45] layout algorithms were applied, refined by label adjust and/or by weighting nodes according to their degree. The web interface was developed for user-friendly network exploration to RP researchers. It was implemented via PHP scripts to process queries, integrate the data and display the resulting network through the open-source Cytoscape Java-Script library for graph analysis and visualization [46]. Further graph calculations to analyze the contribution of each distinct dataset to the main RP network were performed using the igraph R package [47].
The main web form provides two entry points, one focuses on selected genes (similarly to other current gene/protein browsers), and the second recovers the paths containing a given RP/LCA gene within the RPGeNet. The network display (see Figs4–6) facilitates the interac-tion with the nodes by zooming, displacing, changing the graph layout—grid, random, circle, breadthfirst, cose, concentric, and so on—, adding or removing nodes, and retrieving informa-tion about RP/LCA genes. Instead of adjusting the node sizes to their degree as a measure of connectivity, we chose to depict the total number of variants (polymorphisms) reported for each locus [48]. The border color encodes information about the degree of distance to the clos-est RP/LCA gene. Driver genes are always colored in violet when connected, or in orange if not.“Parent”nodes distance—up to four levels—is encoded by green shades whereas“child”
gene expression, which was retrieved from the Gene Expression Omnibus (GEO [49]). Series GSE7905 contains microarray data for 31 human tissues (three replicates each), which were used to create the Applied Biosystems Human BodyMap (Tissue Gene Expression Database). For this specific task we run a standard protocol based on Bioconductor [50] limma R package. After normalization of the expression levels, retina expression levels were compared against the average tissue expression in order to find over- or under-expressed genes in retinal tissue under normal conditions. In the future, this feature could also reflect expression data from dis-tinct sources.
Availability of supporting data
Apart from the supplementary files, further material is provided at the RPGeNet web page [19]. The developed software is available upon request.
Supporting Information
S1 Fig. Syntactical analysis performed to capture interactions from RP/LCA-specific litera-ture.Upper panel shows the distribution of the number of interactions retrieved from journal articles, processed either at the abstract or full-text levels, in orange and purple respectively. The electronic full-text could be retrieved only for 1/8thof the documents that had an abstract. Of interest, there is a clear increase in the interactions reported in the recent years. The bottom panel depicts the complexity of the sentences describing a gene/protein interaction. The num-ber of sentences is summarized on each circle; the level in the sentence parsing-tree was recorded for the subject and predicate containing a gene/protein symbol identifier. The x-axis represents the substraction value among the subject and predicate levels, while the y-axis value is the average of the absolute value of those two levels. Complex sentences push spots up; there-fore, a cut-off of average level above 4.5 can be set to discard false positive interactions. It is worth to note that 75% of the sentences were comprised within this range.
(PDF)
S2 Fig. Reconstructing a preliminary RP interaction network from different sources.A graph skeleton was produced for every interactions dataset separately, using a set of 62 non-syndromic RP genes as bait to capture the paths connecting all of them, in order to assess the individual contribution of each dataset and to illustrate the complementarity of the approaches for the different datasets. The overlap graph is shown for five different dataset combinations (from left to right and from top to bottom): 1) interactions filtered by Sparser from abstracts, having or not full text available (Abs and EpubAbs respectively); 2) Sparser interactions for all abstracts (FullAbs) compared with those retrieved from full text (Epub); 3) overlap among interactions filtered from iHOP and manually curated, from those provided by versus Sparser interactions; 4) skeleton comparison for the two high-throughput (HT) databases, BioGRID and STRING; and finally, 5) the triple merge of skeleton graphs for iHOP curated interactions, Sparser extraction, and HT databases. Different node colors are correlated to the sets depicted on the Venn diagrams, close to each graph plot. Square nodes refer to the 62 RP genes used as bait to distill the subnetworks. RPCvalue corresponds to the connected RP genes, those that
were found on the network when distilling the skeleton subnetwork. It can be observed that this number increases when considering larger interactions sets, but also varies when merging the individual subnetworks. The largest RPCvalue (56) is retrieved when combining all the
interactions from the different datasets in a single run, which was used to distill the skeleton graph underlying the RPGeNet browser.
(PDF)
S3 Fig. Pairwise connectivity of RP/LCA genes.Each of the diagrams show the pair-wise con-nectivity between RP/LCA genes or proteins from the interaction network generated, whered corresponds to the distance for the shortest directed path across the network between the pair of connected driver genes—maximum distance found was of 6 edges (or five internal nodes between the two RP/LCA genes)—. The last plot summarizes all the previous diagrams, show-ing all the possible connections among pairs of query genes at different distances. On the outer ring we have depicted the standard symbols for the genes used to build the network (S3-A: 110 genes, both non-syndromic and syndromic; S3-B: 75 non-syndromic genes; S3-C: 35 syndro-mic genes), they were sorted first by the number of incoming, then by the outcoming connec-tions, and finally following an alphabetical order. Each of the driver genes that interact with other RP/LCA genes has a distinct color box, while those genes for which there was no reported interaction are shown in black. The colored boxes are divided in two moieties: the lighter half groups all the outgoing connections—thus reflecting a directed path starting from the current RP node—, whereas the darker half gathers all the incoming connections— indicat-ing a directed path endindicat-ing at the current RP node. See further details onFig 3. All diagrams on this figure were made using Circos [28].
(PDF)
S1 Table. Summary of the 110 genes related to RP/LCA phenotypic inheritance.The genes were selected from RetNet [1] and classified into four Mendelian inheritance categories, of which the first contains six genes that depending on the mutation studied present a dominant or a recessive phenotype. Reference HUGO symbol notation was used as gene identifier across all the analyses. Location column shows the starting coordinate on a chromosome and the gene strand for the longest transcript isoform of the gene annotated over the h19 human genome version. Those genomic locations are linked to the UCSC genome browser [36]. The other col-umns show the identifiers linked to the corresponding entry on the OMIM [37], NCBI-Gene [38], NCBI-RefSeq [39], and UniProt [40] databases.
(PDF)
S2 Table. Basic graph statistics for the RP/LCA genes interaction networks.Comparison of the number of nodes (gene/protein) and edges (interactions) provided by the different datasets considered, as well as four intersections: joining interactions filtered from literature abstracts and full text (“Sparser ALL”); its combination with iHOP curated interactions (“Sparser + iHOP”); the merge of high-throughput data (“BioGRID + STRING”); and the result of pro-cessing all together (“ALL DBs”).“HsapNodes”were filtered from BioGRID human-specific interactions.“Unique Nodes/Edges”correspond to the simplified set of interactions that define the integrated graph from which the RP/LCA network was filtered out.“Unique Nodes”also include the RP/LCA genes that had no reported interactions on each dataset. Last three col-umns summarize the statistics for the networks computed over three sets of driver genes: non-syndromic, non-syndromic, or both (all). The latter constitutes the core of the RPGeNet webapp. Graph statistics are described in depth on [51].
(PDF)
S3 Table. Barplot of the connectivity for the RP/LCA genes showing the network satura-tion.Names of syndromic RP/LCA genes are marked in red, to distinguish from the non-syndromic ones. Conditional formatting on the cells in the spread sheet produce three horizon-tal barplots depicting the RP genes connectivity (“INDEGREE”for the incoming edges,
to the level 2). Cells are filled in blue when the value on the left is smaller than the current cell value (therefore, the connectivity increases with the level). Note that for all RP/LCA genes con-nectivity saturates at level one; due to the methodology applied to build the skeleton network all their interactors are already included in that level. On the other hand, as expected, the total number of graph nodes and edges increases with the graph level (see bottom rows). RPFsums
up the RP genes having at least one connection at each column.“Max”and“Avg”degree indi-cate the maximum and average degree, respectively; it is worth mentioning that the average indegree was 9.87 and the outdegree was 12.22 for the skeleton network. The red marks identify those RP genes that reach a connectivity degree greater than the maximum value of their aver-age degree (59.58). Several genes are highlighted for both high indegree and outdegree connec-tivities; among those, one can mention: a centrosomal protein 290kDa (CEP290), a cone-rod homeobox protein (CRX), a DEAD-box protein probably involved in splicing (DHX38), the isocitrate dehydrogenase 3 beta subunit (IDH3B), several kinases (HK1,MAK,MERTK, and), several splicing splicing factors (PRPF3,PRPF4,PRPF6,PRPF8,PRPF31, andSNRNP200), rho-dopsin (RHO), and an E3 ubiquitin-protein ligase (TOPORS).
(PDF)
S4 Table. Summary of the RP/LCA genes interactions identified from different sources.
Number of interactions found when at least one of the partners is an RP/LCA gene. Names of syndromic RP/LCA genes are marked in red, to distinguish from the non-syndromic ones. Rows at the bottom (6) sum up the number of nodes and interactions. Number of nodes are indicated as follows: RPFfor RP genes found, and RPMfor those missing in the data set;
RPC_skelfor those connected to another RP gene via the shortest path used to build the skeleton
graph (level 0); and finally, RPC_level1for RP genes integrated into the graph level 1 (as “parents”or“children”of a non-RP gene from the skeleton graph).“Total RP interactions”
summarizes all the interactions found on each data source, and“Total DB interactions” indi-cates the global number of interactions contained in those sources. In all columns,“Sparser”
corresponds to the Stanford-parser syntactical analysis approach.“Sparser ALL”shows the number of interactions found when merging (but not directly adding) the two input datasets defined for“Sparser Abstracts”and“Sparser FullText”. The same applies to the combined approaches:“Sparser + iHOP”,“BIOGRID + STRING”, and“ALL DBs”. The latter contains the resulting interactions found for each RP gene when all the five sets were used as input of the graph distiller program. While the previous columns show results based on a preliminary analysis of 62 RP/LCA genes, last three columns—shaded in light green—show the numbers for the gene sets used as driver genes for the RPGeNet, split into non-syndromic RP/LCA genes, RP/LCA syndromic genes, and both lists used together.
(PDF)
Acknowledgments
We are grateful to Enrique Blanco for critical comments on the manuscript. We are indebted to the editor and the anonymous reviewers, whose comments and suggestions have greatly improved the quality of our work.
Author Contributions
Conceived and designed the experiments: RGD GM JFA. Analyzed the data: DB SCL GM RGD JFA. Wrote the paper: DB SCL GM RGD JFA. Curated the interactions data from repositories: DB. Provided expertise on RP genes at molecular level: RGD GM. Designed the software used
in analysis: DB SCL JFA. Drafted the manuscript with contributions from all authors: GM RGD JFA.
References
1. RetNet, the Retinal Information Network [Internet]. Available:http://sph.uth.edu/retnet/.
2. Hartong DT, Berson EL, Dryja TP. Retinitis pigmentosa. Lancet. 2006; 368: 1795–809. doi:10.1016/ S0140-6736(06)69740-7PMID:17113430
3. Berger W, Kloeckener-Gruissem B, Neidhardt J. The molecular basis of human retinal and vitreoretinal diseases. Prog Retin Eye Res. 2010; 29: 335–75. doi:10.1016/j.preteyeres.2010.03.004PMID: 20362068
4. Uhart M, Bustos DM. Protein intrinsic disorder and network connectivity. The case of 14-3-3 proteins. Front Genet. 2014; 5: 10. doi:10.3389/fgene.2014.00010PMID:24550932
5. Beyer A, Bandyopadhyay S, Ideker T. Integrating physical and genetic maps: from genomes to interac-tion networks. Nat Rev Genet. 2007; 8: 699–710. doi:10.1038/nrg2144PMID:17703239
6. Yang R, Bai Y, Qin Z, Yu T. EgoNet: identification of human disease ego-network modules. BMC Geno-mics. 2014; 15: 314. doi:10.1186/1471-2164-15-314PMID:24773628
7. Ideker T, Sharan R. Protein networks in disease. Genome Res. 2008; 18: 644–52. doi:10.1101/gr. 071852.107PMID:18381899
8. Hamed M, Spaniol C, Zapp A, Helms V. Integrative network-based approach identifies key genetic ele-ments in breast invasive carcinoma. BMC Genomics. 2015; 16 Suppl 5: S2. doi: 10.1186/1471-2164-16-S5-S2PMID:26040466
9. Sun J, Jia P, Fanous AH, van den Oord E, Chen X, Riley BP, et al. Schizophrenia gene networks and pathways and their applications for novel candidate gene selection. PLoS One. Public Library of Sci-ence; 2010; 5: e11351. doi:10.1371/journal.pone.0011351PMID:20613869
10. Podder A, Latha N. New insights into schizophrenia disease genes interactome in the human brain: emerging targets and therapeutic implications in the postgenomics era. OMICS. 2014; 18: 754–66. doi: 10.1089/omi.2014.0082PMID:25454513
11. Kahle JJ, Gulbahce N, Shaw CA, Lim J, Hill DE, Barabási AL, et al. Comparison of an expanded ataxia interactome with patient medical records reveals a relationship between macular degeneration and ataxia. Hum Mol Genet. 2011; 20: 510–527. doi:10.1093/hmg/ddq496PMID:21078624
12. Bettencourt C, Ryten M, Forabosco P, Schorge S, Hersheson J, Hardy J, et al. Insights from cerebellar transcriptomic analysis into the pathogenesis of ataxia. JAMA Neurol. 2014; 71: 831–9. doi:10.1001/ jamaneurol.2014.756PMID:24862029
13. Rachel R a, Li T, Swaroop A. Photoreceptor sensory cilia and ciliopathies: focus on CEP290, RPGR and their interacting proteins. Cilia. 2012; 1: 22. doi:10.1186/2046-2530-1-22PMID:23351659 14. Rolland T, Taşan M, Charloteaux B, Pevzner SJ, Zhong Q, Sahni N, et al. A Proteome-Scale Map of
the Human Interactome Network. Cell. 2014; 159: 1212–1226. doi:10.1016/j.cell.2014.10.050PMID: 25416956
15. Vidal M, Cusick ME, Barabási A- L. Interactome networks and human disease. Cell. 2011; 144: 986– 998. doi:10.1016/j.cell.2011.02.016PMID:21414488
16. Goh K-I, Cusick ME, Valle D, Childs B, Vidal M, Barabási A-L. The human disease network. Proc Natl Acad Sci U S A. 2007; 104: 8685–8690. doi:10.1073/pnas.0701361104PMID:17502601
17. Mostafavi S, Ray D, Warde-Farley D, Grouios C, Morris Q. GeneMANIA: a real-time multiple associa-tion network integraassocia-tion algorithm for predicting gene funcassocia-tion. Genome Biol. 2008; 9: S4. doi:10.1186/ gb-2008-9-s1-s4
18. Zuberi K, Franz M, Rodriguez H, Montojo J, Lopes CT, Bader GD, et al. GeneMANIA prediction server 2013 update. Nucleic Acids Res. 2013; 41: W115–22. doi:10.1093/nar/gkt533PMID:23794635 19. RPGeNet—Retinitis Pigmentosa Genes Network [Internet]. 2014. Available:https://compgen.bio.ub.
edu/RPGeNet/.
20. Stark C, Breitkreutz B-J, Reguly T, Boucher L, Breitkreutz A, Tyers M. BioGRID: a general repository for interaction datasets. Nucleic Acids Res. 2006; 34: D535–9. doi:10.1093/nar/gkj109PMID: 16381927
22. Franceschini A, Szklarczyk D, Frankild S, Kuhn M, Simonovic M, Roth A, et al. STRING v9.1: protein-protein interaction networks, with increased coverage and integration. Nucleic Acids Res. 2013; 41: D808–15. doi:10.1093/nar/gks1094PMID:23203871
23. Fernández JM, Hoffmann R, Valencia A. iHOP web services. Nucleic Acids Res. 2007; 35: W21–6. doi: 10.1093/nar/gkm298PMID:17485473
24. Canese K, Weis S. PubMed: The bibliographic database. The NCBI Handbook. 2013. Available:http:// www.ncbi.nlm.nih.gov/books/NBK153385/.
25. Langfelder P, Mischel PS, Horvath S. When Is Hub Gene Selection Better than Standard Meta-Analy-sis? PLoS One. 2013; 8. doi:10.1371/journal.pone.0061505
26. Hoffmann R, Valencia A. Life cycles of successful genes. Trends Genet. 2003; 19: 79–81. doi:10. 1016/S0168-9525(02)00014-8PMID:12547515
27. Albert R. Scale-free networks in cell biology. J Cell Sci. 2005; 118: 4947–57. doi:10.1242/jcs.02714 PMID:16254242
28. Krzywinski M, Schein J, Birol I, Connors J, Gascoyne R, Horsman D, et al. Circos: An information aes-thetic for comparative genomics. Genome Res. 2009; 19: 1639–1645. doi:10.1101/gr.092759.109 PMID:19541911
29. Khateb S, Zelinger L, Mizrahi-Meissonnier L, Ayuso C, Koenekoop RK, Laxer U, et al. A homozygous nonsense CEP250 mutation combined with a heterozygous nonsense C2orf71 mutation is associated with atypical Usher syndrome. J Med Genet. 2014; 51: 460–9. doi:10.1136/jmedgenet-2014-102287 PMID:24780881
30. Van Wijk E, Kersten FFJ, Kartono A, Mans DA, Brandwijk K, Letteboer SJF, et al. Usher syndrome and Leber congenital amaurosis are molecularly linked via a novel isoform of the centrosomal ninein-like protein. Hum Mol Genet. 2009; 18: 51–64. doi:10.1093/hmg/ddn312PMID:18826961
31. Farkas MH, Grant GR, White JA, Sousa ME, Consugar MB, Pierce EA. Transcriptome analyses of the human retina identify unprecedented transcript diversity and 3.5 Mb of novel transcribed sequence via significant alternative splicing and novel genes. BMC Genomics. 2013; 14: 486. doi: 10.1186/1471-2164-14-486PMID:23865674
32. Garanto A, Riera M, Pomares E, Permanyer J, de Castro-Miró M, Sava F, et al. High transcriptional complexity of the retinitis pigmentosa CERKL gene in human and mouse. Investig Ophthalmol Vis Sci. 2011; 52: 5202–5214. doi:10.1167/iovs.10-7101
33. Irimia M, Weatheritt RJ, Ellis JD, Parikshak NN, Gonatopoulos-Pournatzis T, Babor M, et al. A Highly Conserved Program of Neuronal Microexons Is Misregulated in Autistic Brains. Cell. 2014; 159: 1511– 1523. doi:10.1016/j.cell.2014.11.035PMID:25525873
34. Riazuddin SA, Iqbal M, Wang Y, Masuda T, Chen Y, Bowne S, et al. A Splice-Site Mutation in a Retina-Specific Exon of BBS8 Causes Nonsyndromic Retinitis Pigmentosa. Am J Hum Genet. 2010; 86: 805– 812. doi:10.1016/j.ajhg.2010.04.001PMID:20451172
35. Gray KA, Daugherty LC, Gordon SM, Seal RL, Wright MW, Bruford EA.Genenames.org: the HGNC resources in 2013. Nucleic Acids Res. 2013; 41: D545–52. doi:10.1093/nar/gks1066PMID:23161694 36. Karolchik D, Barber GP, Casper J, Clawson H, Cline MS, Diekhans M, et al. The UCSC Genome
Browser database: 2014 update. Nucleic Acids Res. 2014; 42: D764–70. doi:10.1093/nar/gkt1168 PMID:24270787
37. Xu J, Li Y. Discovering disease-genes by topological features in human protein-protein interaction net-work. Bioinformatics. 2006; 22: 2800–2805. doi:10.1093/bioinformatics/btl467PMID:16954137 38. Brown G, Hem V, Katz K, Ovetsky M, Wallin C, Ermolaeva O, et al. Gene: a gene-centered information
resource at NCBI. Nucleic Acids Res. 2014; 43: D36–42. doi:10.1093/nar/gku1055PMID:25355515 39. Pruitt KD, Brown GR, Hiatt SM, Thibaud-Nissen F, Astashyn A, Ermolaeva O, et al. RefSeq: an update
on mammalian reference sequences. Nucleic Acids Res. 2014; 42: D756–63. doi:10.1093/nar/gkt1114 PMID:24259432
40. The UniProt Consortium. Activities at the Universal Protein Resource (UniProt). Nucleic Acids Res. 2014; 42: D191–8. doi:10.1093/nar/gkt1140PMID:24253303
41. Hoffmann R, Valencia A. Implementing the iHOP concept for navigation of biomedical literature. Bioin-formatics. 2005; 21 Suppl 2: ii252–8. doi:10.1093/bioinformatics/bti1142PMID:16204114
42. De Marneffe M-C, MacCartney B, Manning CD. Generating typed dependency parses from phrase structure parses. Proceedings of the 5th International Conference on Language Resources and Evalu-ation (LREC 2006). 2006. pp. 449–454. 10.1.1.74.3875
43. Bastian M, Heymann S, Jacomy M. Gephi: An Open Source Software for Exploring and Manipulating Networks. Third Int AAAI Conf Weblogs Soc Media. 2009; 361–362. Available:http://www.aaai.org/ ocs/index.php/ICWSM/09/paper/view/154\npapers2://publication/uuid/CCEBC82E-0D18-4FFC-91EC-6E4A7F1A1972.
44. Hu Y. Efficient, High-Quality Force-Directed Graph Drawing. Math J. 2005; 10: 37–71. doi:10.3402/ qhw.v6i2.5918
45. Jacomy M, Venturini T, Heymann S, Bastian M. ForceAtlas2, a continuous graph layout algorithm for handy network visualization designed for the Gephi software. PLoS One. 2014; 9: e98679. doi:10. 1371/journal.pone.0098679PMID:24914678
46. Lotia S, Montojo J, Dong Y, Bader GD, Pico AR. Cytoscape app store. Bioinformatics. 2013; 29: 1350– 1351. doi:10.1093/bioinformatics/btt138PMID:23595664
47. Csárdi G, Nepusz T. The igraph software package for complex network research. InterJournal. 2006; Complex Sy: 1695. Available:http://igraph.org.
48. De Castro-Miró M, Pomares E, Lorés-Motta L, Tonda R, Dopazo J, Marfany G, et al. Combined Genetic and high-throughput strategies for molecular diagnosis of inherited retinal dystrophies. PLoS One. 2014; 9. doi:10.1371/journal.pone.0088410
49. Barrett T, Wilhite SE, Ledoux P, Evangelista C, Kim IF, Tomashevsky M, et al. NCBI GEO: Archive for functional genomics data sets—Update. Nucleic Acids Res. 2013; 41. doi:10.1093/nar/gks1193 50. Gentleman RC, Carey VJ, Bates DM, Bolstad B, Dettling M, Dudoit S, et al. Bioconductor: open
soft-ware development for computational biology and bioinformatics. Genome Biol. 2004; 5: R80. doi:10. 1186/gb-2004-5-10-r80PMID:15461798