RESEARCH ARTICLE
Long Term Clinical Prognostic Factors in
Relapsing-Remitting Multiple Sclerosis:
Insights from a 10-Year Observational Study
Gabriel Bsteh1*, Rainer Ehling1, Andreas Lutterotti1,2, Harald Hegen1, Franziska Di Pauli1, Michael Auer1, Florian Deisenhammer1, Markus Reindl1, Thomas Berger1
1Clinical Department of Neurology, Medical University of Innsbruck, Innsbruck, Austria,2Department of Neurology, University Hospital Zurich & University of Zurich, Zurich, Switzerland
Abstract
Background
Multiple sclerosis (MS) has a highly heterogenic course making prediction of long term out-come very difficult.
Objective
The objective was to evaluate current and identify additional clinical factors that are linked to long term outcome of relapsing-remitting MS assessed by disability status 10 years after disease onset.
Methods
This observational study included 793 patients with relapsing-remitting MS. Clinical factors hypothesized to influence long term outcome measured by EDSS scores 10 years after dis-ease onset were analysed by Kaplan-Meier-estimates. Multinomial logistic regression mod-els regarding mild (EDSS2.5), moderate (EDSS 3.0–5.5) or severe (EDSS6.0)
disability were calculated to correct for confounders.
Results
Secondary progression was the strongest predictor of severe disability (Hazard ratio [HR] 503.8, 95% confidence interval [CI] 160.0–1580.1); p<0.001). Complete remission of neuro-logical symptoms at onset reduced the risk of moderate disability (HR 0.42; CI 0.23–0.77; p = 0.005), while depression (HR 3.59; CI 1.14–11.24; p = 0.028) and cognitive dysfunction (HR 4.64; CI 1.11–19.50; p = 0.036) 10 years after disease onset were associated with severe disability. Oligoclonal bands and pregnancy were not correlated with disability.
Conclusion
We were able to identify clinically apparent chronic depression and cognitive dysfunction to be associated with adverse long term outcome in MS and to confirm that pregnancy has no
PLOS ONE | DOI:10.1371/journal.pone.0158978 July 8, 2016 1 / 14
a11111
OPEN ACCESS
Citation:Bsteh G, Ehling R, Lutterotti A, Hegen H, Di Pauli F, Auer M, et al. (2016) Long Term Clinical Prognostic Factors in Relapsing-Remitting Multiple Sclerosis: Insights from a 10-Year Observational Study. PLoS ONE 11(7): e0158978. doi:10.1371/ journal.pone.0158978
Editor:Sven G. Meuth, University of Muenster, GERMANY
Received:March 22, 2016
Accepted:June 25, 2016
Published:July 8, 2016
Copyright:© 2016 Bsteh et al. This is an open access article distributed under the terms of the
Creative Commons Attribution License, which permits unrestricted use, distribution, and reproduction in any medium, provided the original author and source are credited.
Data Availability Statement:All relevant data are within the paper and its Supporting Information files.
Funding:This study was supported by a research grant from the Austrian Federal Ministery of Science and Economy (grant name: BIG WIG MS). The funder had no role in study design, data collection and analysis, decision to publish, or preparation of the manuscript.
negative impact. Additionally, we emphasize the positive predictive value of complete remission of initial symptoms.
Introduction
Multiple Sclerosis (MS) is the most common cause of irreversible neurological disability in young adults with a prevalence of 120 per 100.000 [1]. MS is recognized as a chronic autoim-mune disease of the central nervous system (CNS) causing demyelination and axonal loss [2].
The disease course of MS is either relapsing-remitting (RRMS) or chronic progressive (pri-mary, PPMS, or secondary progressive, SPMS). Secondary progressive disease course poses the major risk for the majority of RRMS patients to accumulative permanent disability after a vari-able period of time [3].
Despite the therapeutic merit of a meanwhile broad armamentarium of disease modifying therapies (DMT) in reducing relapse rates in RRMS, it is still controversially discussed whether these drugs are really able to modify the long term disease course of MS, i.e. preventing or delaying conversion to SPMS.
In addition, prediction of long term outcome in patients with relapsing-remitting MS is of utmost importance ever since to enable individual prognosis and, thus, treatment decisions/ adjustments. Over the past decades some clinical and magnetic resonance imaging (MRI) fac-tors seem to be predictive for long term outcomes: male gender, higher age and pyramidal symptoms at disease onset, incomplete recovery from first clinical attack, higher baseline T2 lesion load, early brain atrophy, shorter time-interval to second clinical attack, number of relapses in early disease phase and–most importantly–development of progressive disease course. However, the heterogeneity of individual disease courses makes prognostic statements at disease onset highly difficult [3–6].
The objective of this 10 years observational study was to evaluate existing clinical prognostic factors and to possibly identify additional clinical risk factors associated with long term out-come in a large cohort of RRMS patients.
Patients and Methods
Data collection and patient population
In 2004 an electronic database was established at the MS Clinic of the Department of Neurol-ogy, Medical University of Innsbruck, which serves as both a primary and a reference centre mainly for western Austria and its geographical catchment area. The MS population is mainly of Caucasian ethnicity. From January 2nd2000 to July 13th2013, a cohort of 1601 MS patients according to Poser’s or McDonalds diagnostic criteria has been included in this database [7–9]. The prevalence of MS in Austria is 98 per 100.000 people [10]. Given a population of about 1.6 million people in western Austria, this study is likely to have caught most of MS patients from this geographic area [11].
Data were collected retrospectively at first visit and prospectively whenever the patient returned for scheduled (usually every 3–6 months, at least once yearly) follow-up or unsched-uled visits. Database case reports include demographic data, smoking habits, family history, medical history, pregnancies, details of MS course (timepoint of first symptoms, time to diag-nosis, relapses, number of relapses per year, Expanded Disability Status Scale [EDSS], standard relapse treatment, relapse outcome, onset of SPMS), occurrence of depressive symptoms or Abbreviations:ANOVA, Analysis of variance; ARR,
cognitive dysfunction, diagnostic data (MRI, cerebrospinal fluid findings, evoked potentials) and previous DMT, including initiation, interruption, change, and adverse effects of DMT.
Confidentiality and data protection are ensured in keeping with the recommendations of the declaration of Helsinki and the Austrian Data Safety Authority instructions. The study was approved by the ethics committee of the Medical University Innsbruck. Written informed con-sent was obtained from every patient at first visit.
Definition of cases and assessment of patients
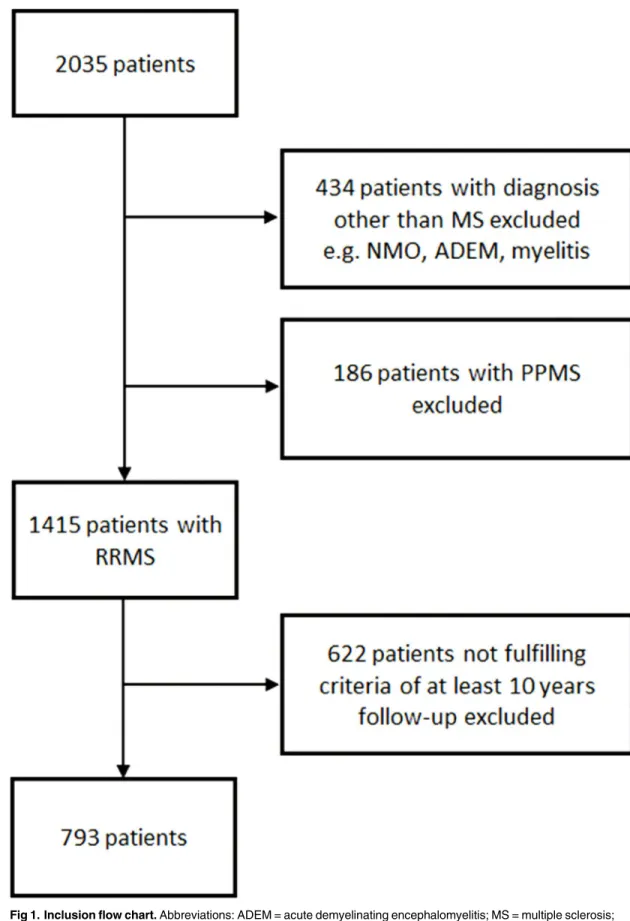
For the present study, we included those 793 patients with onset of relapsing-remitting MS (RRMS) and at least 10 years of complete documented follow-up from onset of disease. (Fig 1)
The disease course was defined according to the classification of Lublin and Reingold [12]. A relapse was defined as patient-reported symptoms or objectively observed signs typical of an acute CNS inflammatory demyelinating event, current or prior to the visit, with duration of at least 24 hours in the absence of increased body temperature or infection, separated from the last relapse by at least 30 days [7]. SPMS was defined as sustained worsening of neurological symptoms (accounting for an EDSS progression of at least 1.0 point) for a duration of at least 12 months not related to a relapse and had to be confirmed in our MS Clinic [13]. EDSS score was recorded at each visit. To avoid documentation bias due to EDSS changes along with relapses, EDSS scores were only considered if they were confirmed after 6 months. MS onset symptoms were categorized according to Kurtzke’s Functional Systems (FS) [14]. Relapse treat-ment and degree of remission of onset symptoms after 6 months were also obtained. A history of depression and cognitive dysfunction before onset or its worsening or new occurrence after diagnosis of MS was rigorously asked and documented at each visit by the treating physician. Since not all patients included in the study had received formal neuropsychological testing for depression and cognitive dysfunction and because the testing methods used changed signifi-cantly over the period of observation making comparisons impossible, we decided to use clini-cal definitions of depression and cognitive dysfunction rather than formal testing. Depression was defined as a state of lowmood) and loss of activity along with characteristic symptoms such as sadness, anxiety, awkwardness, loss of appetite, insomnia, up to suicidal thoughts. When cognitive dysfunction was reported by a patient or clinically suspected (by characteristic symptoms such as impaired memory, decreased attention or concentration, difficulties in ori-entation, learning, calculating, planning or performing any other cognitive task). To validate these definitions, we conducted correlation analyses comparing the accordance rate of clinical and formal diagnosis in the subgroup of patients who received formal neuropsychological test-ing (S1 Table). Depression testtest-ing was available for 140/793 patients and cognitive testtest-ing for 86/793 patients. We found strong accordance rates for the clinical diagnoses of depression (kappa 0.923; p<0.001) and cognitive dysfunction (kappa 0.884; p<0.001) compared to formal
neuropsychological testing.
Statistical Analysis
Statistical analysis was performed using SPSS 22.0 (SPSS Inc, Chicago, IL). Categorical vari-ables were expressed in frequencies and percentages, and parametric continuous varivari-ables as mean and standard deviation (SD) or nonparametric variables as median and range.
Primary endpoint was EDSS score assessed 10 years after disease onset. We defined three groups designated to“mild”(EDSS 0–2.5),“moderate”(EDSS 3.0–5.5) or“severe”(EDSS 6.0 or higher) disability. Annualized relapse rates (ARR) were calculated for four time intervals 1) first year after onset (ARR y1), 2) second year after onset (ARR y2), 3) third to fifth year after onset (ARR y3-5) and 4) sixth to tenth year after onset (ARR y6-10) by dividing the number of
Long Term Clinical Prognostic Factors in Relapsing-Remitting Multiple Sclerosis
Fig 1. Inclusion flow chart.Abbreviations: ADEM = acute demyelinating encephalomyelitis; MS = multiple sclerosis; NMO = neuromyelitis optica; PPMS = primary progressive MS; RRMS = relapsing-remitting MS
relapses occurred by the respective time intervals. Comparisons were made by analysis of vari-ance (ANOVA) for independent samples and Chi-Square tests as appropriate. A two tailed p-value<0.05 was considered significant. Survival analyses were performed using
Kaplan-Meier-estimates and log-rank-tests for comparison of prognostic factors over time. Multino-mial logistic regression models were calculated regarding the primary endpoint (mild vs. mod-erate vs. severe disability) to evaluate the prognostic impact of the factors included (age at manifestation of patients’first symptoms, sex, initial symptoms, remission of initial symptoms, presence of oligoclonal bands (OCB) in the CSF at time of diagnosis, ARR y1, ARR y2, ARR y3-5, ARR y6-10, development of SPMS, occurrence of depression, cognitive dysfunction, and pregnancy during the ten-year observation period).
Results
Basic characteristics of patients
793 relapsing-remitting MS (RRMS) patients fulfilled the inclusion criteria and were included in the analysis (Fig 1). Demographic and baseline clinical data as well as correlation with EDSS outcome 10 years after disease onset are shown inTable 1. The mild disability group after 10 years disease course had a significantly younger age at onset compared to the moderate and severe group (27.36 vs. 29.81/32.44; p = 0.006/p<0.001). There were no significant group
dif-ferences regarding sex, family history of MS, presence of OCB in CSF or smoking before and after onset, although there were trends towards more male patients in the severe group and impact of smoking on further disease progression.
A total of 593 (74.8%) patients had received one or more DMT during the observational period. Treated patients tended to have a higher relapse frequency and a more severe initial course of disease compared to the untreated group of patients. However, treatments were het-erogeneous, mean duration of treatment was just 2.25 years (SD 2.84) and mean time to initia-tion of DMT was 6.63 years (SD 3.66). (S2 Table)
Initial symptoms, remission, and oligoclonal bands
According to Kurtzke’s FS, 26.4% of patients had visual symptoms, 22.8% brainstem, 22.3% symptoms of the pyramidal tract, 8.8% cerebellar, 48.0% sensory, and 2.4% bladder/bowel symptoms at onset (Table 1). 26.2% of our patients had initial symptoms affecting more than one FS. Patients with a pyramidal or polysymptomatic onset symptom(s) were significantly less likely to have mild disability after ten years MS disease course. Complete remission of onset symptoms was achieved in 84.4% of the mild EDSS group compared to only 61.0% (p<0.001) in the moderate and 53.4% (p<0.001) in the severe disability group. There was no
significant association between use of steroid treatment and the proportion of patients achiev-ing complete remission of onset symptoms (p = 0.232). Overall, 95% of patients exhibited OCB positivity with no significant differences between the disability groups. (Table 1)
Relapses and secondary progression
Mean time to second clinical attack was significantly longer in the mild compared to the mod-erate and severe disability group (4.1 vs. 2.7 and 2.0 years; p<0.001). Similar to the onset
symp-tom analyses, the mild disability group had significantly less pyramidal (20.1%) and polysymptomatic (23.9%) symptoms at second clinical attack than the moderate (38.4%/ 39.2%; p<0.001) and severe (62.7%/45.3%; p<0.001) disability group. Likewise, complete
remission of the second clinical attack showed a significant association with only mild disabil-ity after ten years. Annualized relapse rates (ARR) were significantly lower in the mild
Long Term Clinical Prognostic Factors in Relapsing-Remitting Multiple Sclerosis
compared to the moderate outcome group except for the second year after onset. Comparing the mild and severe disability group, we found ARR to be associated with the endpoint in the first five years from onset but not afterwards. The cumulative number of relapses in the 10 years observation period was significantly different between the mild disability (3.74 relapses), moderate (5.24; p<0.001) and severe disability (4.99; p = 0.002) groups. 18% of all patients
converted to SPMS during the 10 years of follow-up. However, only 2.6% in the mild, but 42.4% of the moderate and 92.3% of the severe disability group developed SPMS (p<0.001).
Time to SPMS was markedly shorter in the severe compared to the mild and moderate out-come groups (4.9 vs. 10.0 and 8.6 years; p<0.001) Age at SPMS conversion tended to be lower
in the severe and moderate EDSS groups as opposed to the mild EDSS group. (Table 2) Table 1. Baseline clinical and demographic data and their correlation with EDSS outcome 10 years after disease onset
Overall n = 793
Mild disability (EDSS 0–2.5)
n = 583
Moderate disability(EDSS
3–5.5) n = 132
Severe disability (EDSS
6–10) n = 78
P value mild vs. moderate disability
P value mild vs. severe disability P value moderate vs. severe disability P value Overall
Type of MSa
RRMS 650 (82.0) 568 (97.4) 76 (57.6) 6 (7.7) 6.0*10−42 1.1
*10−105 2.2
*10−11 1.1 *10−93
SPMS 143 (18.0) 15 (2.8) 56 (42.4) 72 (92.3)
Time to diagnosis (years)b
2.43±3.29 2.50±3.47 2.64±3.03 1.57±2.02 0.999 0.058 0.069 0.047
Femalea 577 (72.8) 426 (73.1) 97 (73.5) 54 (69.2) 0.509 0.278 0.306 0.758
Age at onset (years)b 28.27±8.41 27.36±8.01 29.81±7.98 32.44±10.29 0.006 3.4*10−5 0.079 1.9*10−7
Family History of MSa 115 (14.5) 79 (13.6) 27 (20.5) 9 (11.5) 0.103 0.999 0.259 0.105
Smoking before
onseta 240 (30.3) 167 (28.6) 46 (34.8) 27 (34.6) 0.999 0.999 0.999 0.215
Smoking after onseta 211 (26.6) 150 (25.7) 39 (29.5) 22 (28.2) 0.999 0.999 0.999 0.632
Onset symptomsa
Visual 209 (26.4) 154 (26.4) 38 (28.8) 17 (21.8) 0.999 0.999 0.999 0.999
Brainstem 181 (22.8) 131 (22.5) 30 (22.7) 20 (25.6) 0.999 0.999 0.999 0.999
Pyramidal 177 (22.3) 106 (18.2) 37 (28.0) 34 (43.6) 0.071 3.0*10−6 0.048 1.9*10−5
Cerebellar 70 (8.8) 41 (7.0) 18 (13.6) 11 (14.1) 0.104 0.254 0.999 0.096
Sensory 381 (48.0) 288 (49.4) 65 (49.2) 28 (35.9) 0.999 0.132 0.328 0.616
Bladder/Bowel 19 (2.4) 8 (1.4) 7 (5.3) 4 (5.1) 0.088 0.340 0.999 0.056
Cerebral 6 (0.8) 2 (0.3) 4 (3.0) 0 (0.0) 0.999 0.999 0.999 0.999
Other 2 (0.3) 2 (0.3) 0 (0.0) 0 (0.0) 0.999 0.999 0.999 0.999
Polysymptomatic 208 (26.2) 131 (22.5) 46 (34.8) 31 (39.7) 0.008 0.003 0.858 7.1*10−4 Steroid treatment
received at
manifestation offirst symptomsa*
349 (47.4) 267 (49.0) 51 (42.5) 31 (43.1) 0.352 0.617 0.999 0.972
Oligoclonal bands at time of diagnosis
753 (95.0) 552 (94.7) 126 (95.5) 75 (96.2) 0.825 0.220 0.602 0.533
Complete Remission of onset symptomsa
590 (77.6) 476 (84.4) 75 (61.0) 39 (53.4) 8.1*10−8 2.8*10−8 0.563 4.3*10−13
a. . .absolute numbers and percentages
b. . .mean±standard deviation
p-values corrected for multiple testing (Bonferroni)
*standard treatment with 1000mg methylprednisolone for 3–5 days
Abbreviations: EDSS = Expanded Disability Status Scale; RRMS = relapsing remitting MS; SPMS = secondary progressive MS
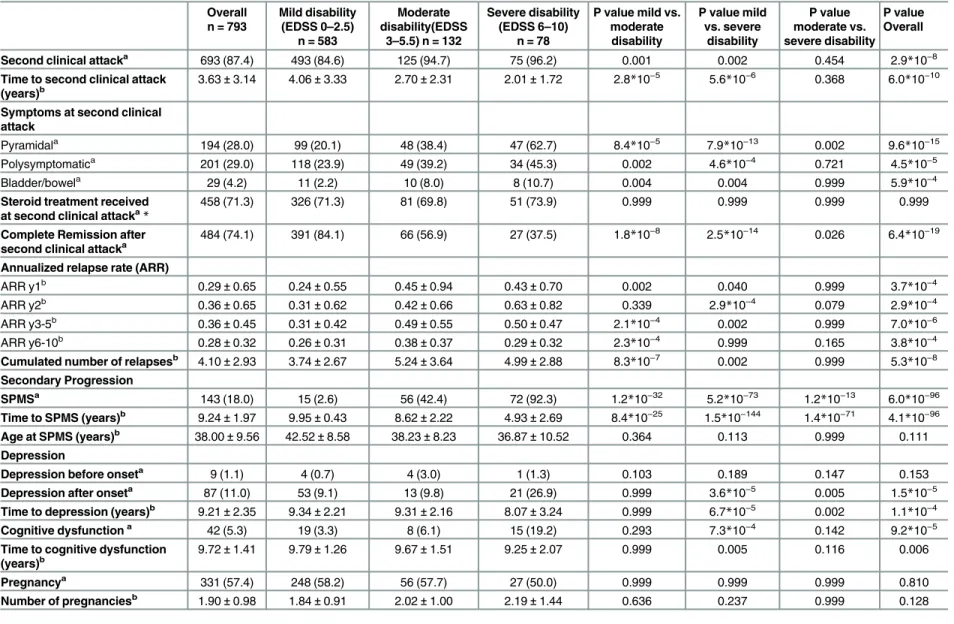
Table 2. Variables of disease course and their correlation with EDSS outcome 10 years after disease onset
Overall n = 793
Mild disability
(EDSS 0–2.5)
n = 583
Moderate disability(EDSS
3–5.5) n = 132
Severe disability
(EDSS 6–10)
n = 78
P value mild vs. moderate disability
P value mild vs. severe disability P value moderate vs. severe disability P value Overall
Second clinical attacka 693 (87.4) 493 (84.6) 125 (94.7) 75 (96.2) 0.001 0.002 0.454 2.9*10−8
Time to second clinical attack
(years)b
3.63±3.14 4.06±3.33 2.70±2.31 2.01±1.72 2.8*10−5 5.6*10−6 0.368 6.0*10−10
Symptoms at second clinical attack
Pyramidala 194 (28.0) 99 (20.1) 48 (38.4) 47 (62.7) 8.4
*10−5 7.9*10−13 0.002 9.6*10−15
Polysymptomatica 201 (29.0) 118 (23.9) 49 (39.2) 34 (45.3) 0.002 4.6
*10−4 0.721 4.5*10−5
Bladder/bowela 29 (4.2) 11 (2.2) 10 (8.0) 8 (10.7) 0.004 0.004 0.999 5.9
*10−4
Steroid treatment received
at second clinical attacka
*
458 (71.3) 326 (71.3) 81 (69.8) 51 (73.9) 0.999 0.999 0.999 0.999
Complete Remission after
second clinical attacka 484 (74.1) 391 (84.1) 66 (56.9) 27 (37.5) 1.8*10
−8 2.5*10−14 0.026 6.4*10−19
Annualized relapse rate (ARR)
ARR y1b 0.29±0.65 0.24±0.55 0.45±0.94 0.43±0.70 0.002 0.040 0.999 3.7
*10−4
ARR y2b 0.36±0.65 0.31±0.62 0.42±0.66 0.63±0.82 0.339 2.9
*10−4 0.079 2.9*10−4
ARR y3-5b 0.36±0.45 0.31±0.42 0.49±0.55 0.50±0.47 2.1
*10−4 0.002 0.999 7.0*10−6
ARR y6-10b 0.28±0.32 0.26±0.31 0.38±0.37 0.29±0.32 2.3*10−4 0.999 0.165 3.8*10−4
Cumulated number of relapsesb 4.10±2.93 3.74±2.67 5.24±3.64 4.99±2.88 8.3*10−7 0.002 0.999 5.3*10−8
Secondary Progression
SPMSa 143 (18.0) 15 (2.6) 56 (42.4) 72 (92.3) 1.2
*10−32 5.2*10−73 1.2*10−13 6.0*10−96
Time to SPMS (years)b 9.24±1.97 9.95±0.43 8.62±2.22 4.93±2.69 8.4*10−25 1.5*10−144 1.4*10−71 4.1*10−96
Age at SPMS (years)b 38.00±9.56 42.52±8.58 38.23±8.23 36.87±10.52 0.364 0.113 0.999 0.111
Depression
Depression before onseta 9 (1.1) 4 (0.7) 4 (3.0) 1 (1.3) 0.103 0.189 0.147 0.153
Depression after onseta 87 (11.0) 53 (9.1) 13 (9.8) 21 (26.9) 0.999 3.6*10−5 0.005 1.5*10−5
Time to depression (years)b 9.21±2.35 9.34±2.21 9.31±2.16 8.07±3.24 0.999 6.7*10−5 0.002 1.1*10−4
Cognitive dysfunctiona 42 (5.3) 19 (3.3) 8 (6.1) 15 (19.2) 0.293 7.3*10−4 0.142 9.2*10−5
Time to cognitive dysfunction
(years)b
9.72±1.41 9.79±1.26 9.67±1.51 9.25±2.07 0.999 0.005 0.116 0.006
Pregnancya 331 (57.4) 248 (58.2) 56 (57.7) 27 (50.0) 0.999 0.999 0.999 0.810
Number of pregnanciesb 1.90±0.98 1.84±0.91 2.02±1.00 2.19±1.44 0.636 0.237 0.999 0.128
a. . .absolute numbers and percentages
b. . .mean±standard deviation
p-values corrected for multiple testing (Bonferroni)
*standard treatment with 1000mg methylprednisolone for 3–5 days
Abbreviations: EDSS = Expanded Disability Status Scale; MS = multiple sclerosis; RRMS = relapsing-remitting MS; SPMS = secondary progressive MS
Depression, cognitive dysfunction, and pregnancy
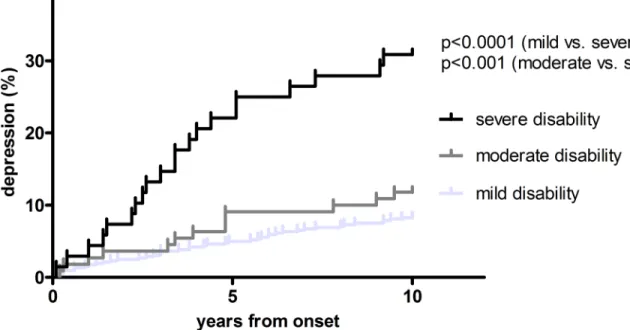
Eleven percent of RRMS patients were diagnosed with depression after MS onset and 4.8% developed cognitive dysfunction during the 10 years observation period. New onset depression occurred in 26.9% in the severe compared to 9.1% in the mild (p<0.001) and 9.8% in the
mod-erate disability group (p = 0.005). Time to depression took 8.07 years in the severe, while it was 9.34 years in the mild (p<0.001) and 9.31 years in the moderate outcome group (p = 0.002).
(Table 2,Fig 2).
Cognitive dysfunction was diagnosed in 14.1% of severely disabled patients, but was present in only 3.3% and 6.1% of mildly and moderately disabled patients, respectively. Correspond-ingly, time to cognitive dysfunction was notably shorter in the severe (9.25 years) than in mild disability group (9.79 years; p = 0.005). (Fig 3)
Out of 577 female patients, 331 (57.4%) became pregnant at least once during the first ten years after disease onset. There were no significant differences between the three disability out-come groups regarding any pregnancy related data. (Table 2)
Multivariate analysis
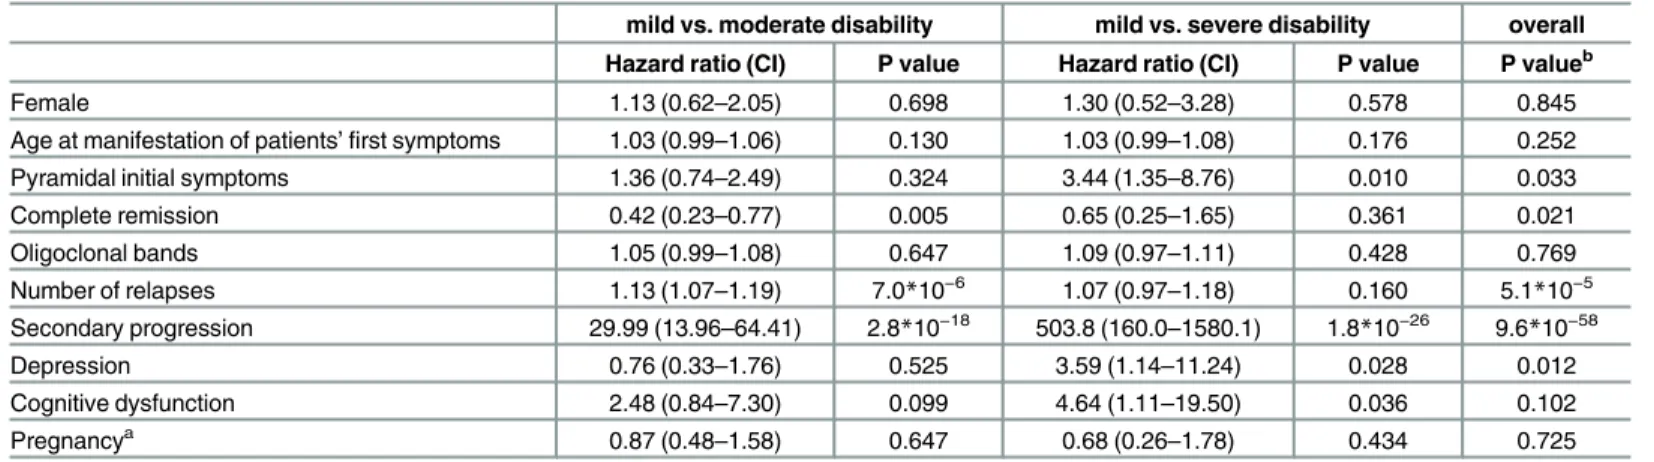
Multinomial logistic regression was performed to identify clinical factors for prognosis of dis-ability 10 years after disease onset (Table 3). Overall, the model revealed occurrence of second-ary progressive disease course, pyramidal symptoms at disease onset, number of relapses, development of depression and incomplete remission of onset symptoms as significant risk fac-tor for poor outcome.
Comparing the mild and moderate disability groups, SPMS was the strongest predictor of higher disability (HR 29.99; 95% CI 13.96–64.41; p<0.000). The total number of relapses was
highly significant, but had a low impact on disability (HR 1.13; 95% CI 1.07–1.19; p<0.000).
Complete remission of onset symptoms proved to be prognostic of a better long term outcome,
Fig 2. time to depression.Kaplan-Meier curves of the risk of developing depression according to disability status 10 years after onset. Log rank test used for calculation of significancy.
thus reducing the risk of reaching even moderate disability to an HR of 0.42 (95% CI 0.23–
0.77; p = 0.005).
The comparison of the mild and severe EDSS groups confirmed the strong correlation between SPMS and disability level (HR 503.8; 95% CI 160.0–1580.1; p<0.000). Onset pyramidal
symptoms, development of depression and cognitive dysfunction were associated with a three- to four-fold risk of severe disability. OCB positivity and pregnancy did not show any association with disability outcome, neither in the overall regression model nor in the subgroup models. Fig 3. time to cognitive dysfunction.Kaplan-Meier curves of the risk of developing cognitive dysfunction according to disability status 10 years after onset. Log rank test used for calculation of significancy.
doi:10.1371/journal.pone.0158978.g003
Table 3. Prognostic factors in RRMS according to EDSS outcome 10 years after disease onset.
mild vs. moderate disability mild vs. severe disability overall Hazard ratio (CI) P value Hazard ratio (CI) P value P valueb
Female 1.13 (0.62–2.05) 0.698 1.30 (0.52–3.28) 0.578 0.845
Age at manifestation of patients’first symptoms 1.03 (0.99–1.06) 0.130 1.03 (0.99–1.08) 0.176 0.252
Pyramidal initial symptoms 1.36 (0.74–2.49) 0.324 3.44 (1.35–8.76) 0.010 0.033
Complete remission 0.42 (0.23–0.77) 0.005 0.65 (0.25–1.65) 0.361 0.021
Oligoclonal bands 1.05 (0.99–1.08) 0.647 1.09 (0.97–1.11) 0.428 0.769
Number of relapses 1.13 (1.07–1.19) 7.0*10−6 1.07 (0.97–1.18) 0.160 5.1*10−5
Secondary progression 29.99 (13.96–64.41) 2.8*10−18 503.8 (160.0–1580.1) 1.8*10−26 9.6*10−58
Depression 0.76 (0.33–1.76) 0.525 3.59 (1.14–11.24) 0.028 0.012
Cognitive dysfunction 2.48 (0.84–7.30) 0.099 4.64 (1.11–19.50) 0.036 0.102
Pregnancya 0.87 (0.48–1.58) 0.647 0.68 (0.26–1.78) 0.434 0.725
Multinominal logistic regression. Reference category is mild disability 10 years after disease onset. A hazard ratio (HR)>1 indicates that the variable is associated with a higher risk of having moderate or severe disability compared to the reference group (mild disability).
Numbers in brackets show 95% confidence interval (CI) for HR. a. . .this analysis was only conducted for female patients
b. . .likelihood ratio tests
Abbreviations: EDSS = Expanded Disability Status Scale; RRMS = relapsing-remitting MS
doi:10.1371/journal.pone.0158978.t003
Long Term Clinical Prognostic Factors in Relapsing-Remitting Multiple Sclerosis
Discussion
In this observational study of a large and well-documented real-life cohort of RRMS patients we investigated the prognostic impact of clinical parameters on long term outcome as mea-sured by the level of disability 10 years after disease onset.
Occurrence of secondary progressive disease course is the most
important negative predictor of long term outcome
We found that the occurrence of secondary progressive disease course is by far the most impor-tant negative predictor of long term outcome. A patient developing SPMS has a 500-fold higher risk of being severely disabled within 10 years after MS onset as compared to a patient remaining relapsing-remitting. This is consistent with findings of three large natural history studies (Lyon, Gothenborg and London, Ontario), although the overall rate of patients developing SPMS in our cohort was considerably lower [3,4,15]. This may be explained by the follow up period of 10 years from onset, which is likely to cause an underestimation of SPMS conversion rates.
No association between OCB, higher age at onset, male sex and level of
disability
A higher age at onset and male sex were associated with a shorter time to reach milestones of disability in those studies [3,4,15]. However, we could not find a significant correlation between sex and disability, similar to a more recently published study [5]. The different methodology and end points used may be responsible for this discrepancy, considering that other studies used survival analyses, while we used disability status after 10 years as an endpoint. We did find a significantly better outcome in patients with a younger age at onset, although–in contrast to other studies but consistent with recently published data from the Barcelona cohort–this result did not remain significant in the multinomial regression model [3,4,15,16]. Conse-quently, our results confirm that–although relevant–sex and age at onset only have a low impact on long term disability [16].
The Barcelona study also showed OCB positivity to be associated with disability accumula-tion in clinically isolated syndrome (CIS) [16]. However, the prognostic role of OCB in RRMS is far less clear [17]. We did not find any association between OCB and level of disability 10 years after disease onset suggesting that the prognostic value of OCB positivity regards more the prediction of conversion from CIS to clinically definite MS rather than in the prediction of a future disability accumulation.
It has been reported that relapses in the early MS course influence the long term outcome [4,18]. We could find a significant correlation between the total number of relapses and disabil-ity, although relapses accounted only for a minor increase to the overall risk of future disability. Consistent with prior studies, early relapses (from onset until year 5) contributed stronger to long term disability than late relapses (year 5–year 10) [19,20]. While our results have to be interpreted cautiously in a cohort receiving heterogeneous DMT for variable time periods, they certainly confirm that relapses only play a minor part in the overall and long term accumula-tion of disability [21,22].
Complete remission of onset symptoms predicts a favourable long term
outcome
history studies consistently showed incomplete recovery to be associated with a worse outcome regarding long term disability [4,22,23]. Irrespective of the immunopathological reasons for this favourable clinical outcome predictor–be it less severe inflammation along with less axonal dysfunction or a better capacity of repair/remyelination–our results confirm that the remission of onset symptoms provides a useful prognostic marker for RRMS patients in daily clinical practice.
Depression and cognitive dysfunction are associated with disability
–
but
pregnancy is not
In contrast to the general population, depression in MS is largely chronic suggesting a different pathophysiology [24]. Imaging studies support the view that depression in MS is due to struc-tural brain abnormalities, most likely axonal damage resulting in grey matter atrophy [25–27]. Koch et. al. found depression unrelated to the development of SPMS, but this study was limited by a drop-out rate of 34% and the fact that it did not compare patients from disease onset [28].
Studies on cognitive dysfunction and disability have yielded controversial results. While some authors did not find any correlation between cognitive dysfunction and EDSS levels, oth-ers did [29–31]. Zivadinov et al. reported evidence hinting towards a link between cognitive deterioration and brain atrophy [32]. Of note, some studies found depression to be associated with cognitive dysfunction in patients with MS, whereas other investigations have not shown such a relationship [33–35].
To our knowledge, we provide evidence for the first time that clinically apparent depression and cognitive dysfunction are independent markers associated with a higher risk of accumulat-ing disability in RRMS.
Previous studies on pregnancy and MS have demonstrated a reduction of relapse rates dur-ing pregnancy and an increase post-partum with a return to pre-pregnancy relapse rates within a short time [36,37]. However, information on pregnancies and their impact on the long term disease course and outcome are scant. In our study, we could not find any effect of pregnancy on future disability, neither negative nor positive, which is compatible with the above men-tioned dissociation between relapses and irreversible disability.
The strengths of our study are the large number of patients and the close-meshed, standard-ized prospective follow up over a long term period of 10 years. As a limitation, it has to be acknowledged that the diagnosis of depression and cognitive dysfunction was primarily clini-cally based on repetitive exploration of patients for characteristic respective symptoms rather than performing standardized testing in every even asymptomatic patient. However, if cogni-tive dysfunction was suspected from exploration, formal neuropsychological testing was per-formed. In addition, we validated our clinical definitions of depression and cognitive dysfunction and found strong accordance rates compared to formal neuropsychological test-ing. Nevertheless, we cannot exclude that this thorough clinical routine practice may have led to underestimating the prevalence of depression and cognitive dysfunction. Since neuropsy-chological testing methods for depression and cognitive dysfunction changed significantly over the period of observation, we were not able to compare specific neuropsychological patterns of dysfunction. We also did not include fatigue in our analyses which may interfere with the clini-cal definitions of depression and cognitive dysfunction. Possible limitations also include inter-rater-variabilities of EDSS scoring, which is the primary endpoint of the study [38]. Still, due to extensive clinical trial engagements our physicians are well trained and certified as EDSS raters, thus minimizing this potential confounding factor. The EDSS is known to be rather crude in patients with low disability and is very much driven by walking disability, while factors such as cognition, fatigue, and depression, which play an important role in patients’quality of life, are
Long Term Clinical Prognostic Factors in Relapsing-Remitting Multiple Sclerosis
disregarded [39,40]. Due to the different group sizes (583 mildly, 132 moderately, and 78 severely disabled patients), the comparison of the different disability groups in the statistical analyses have to be treated with caution.
Considering the MS prevalence in the geographic area, our study seems to have caught most of its MS patients. Still, a potential selection bias towards more benign courses and/or severely disabled patients, who both tend to stop attending MS clinics, cannot be completely excluded. Because of the low proportion of patients reaching high EDSS scores, we decided not to use time to EDSS scores (survival analysis) as an endpoint to avoid censor bias. However, by using disability categories we cannot describe the velocity of disease progression in our cohort. In addition, we focused on the strength of the detailed and confirmed clinical data, and did not include MRI data, because MRI was obtained at different institutions and not systematically performed. Finally, this study was not designed to show any DMT effects on the long term dis-ease course. However, evidence confirming a true disdis-ease modifying treatment effect–namely decrease of conversion rates to SPMS—is scarce. This also underlines the importance of focus-ing future research on identifyfocus-ing biomarkers capable of characterizfocus-ing the course of MS and developing therapeutic agents capable of reducing axonal degeneration in MS.
Relevance for clinical routine practice
Apart from suggested predictive value of MRI parameters, the strongest clinical prognostic fac-tors for substantial disability within 10 years after onset of MS regard the extent of early disease activity in terms of polysymptomatic onset symptoms, incomplete remission, relapse rate and early conversion to SPMS, as well as depression and development of cognitive dysfunction. These clinical prognostic factors thus can be easily determined and monitored in daily clinical routine practice and might be factored in for treatment decision-making.
Supporting Information
S1 Table. Correlation of clinical diagnosis of depression and cognitive dysfunction with formal neuropsychological testing.
(DOCX)
S2 Table. Disease modifying therapies and EDSS outcome after 10 years in ROMS patients.
(DOCX)
Author Contributions
Conceived and designed the experiments: GB RE AL MR TB. Performed the experiments: GB RE AL HH FP MA FD TB. Analyzed the data: GB RE MR TB. Contributed reagents/materials/ analysis tools: GB MR. Wrote the paper: GB RE AL MR TB.
References
1. Noseworthy JH, Lucchinetti C, Rodriguez M, Weinshenker BG. Multiple sclerosis. N Engl J Med. 2000 Sep 28; 343(13):938–52. PMID:11006371
2. Trapp BD, Peterson J, Ransohoff RM, Rudick R, Mörk S, Bö L. Axonal transection in the lesions of mul-tiple sclerosis. N Engl J Med. 1998 Jan 29; 338(5):278–85. PMID:9445407
3. Weinshenker BG, Bass B, Rice GP, Noseworthy J, Carriere W, Baskerville J, et al. The natural history of multiple sclerosis: a geographically based study. I. Clinical course and disability. Brain. 1989 Feb; 112 (Pt 1)(1):133–46.
5. Amato MP, Ponziani G. A prospective study on the prognosis of multiple sclerosis. Neurol Sci. 2000; 21 (4 Suppl 2):S831–8. PMID:11205358
6. Popescu V, Agosta F, Hulst HE, Sluimer IC, Knol DL, Sormani MP, et al. Brain atrophy and lesion load predict long term disability in multiple sclerosis. J Neurol Neurosurg Psychiatr. 2013 Oct; 84(10):1082–
91. doi:10.1136/jnnp-2012-304094PMID:23524331
7. Poser CM, Paty DW, Scheinberg L, McDonald WI, Davis FA, Ebers GC, et al. New diagnostic criteria for multiple sclerosis: guidelines for research protocols. Ann Neurol. 1983 Mar; 13(3):227–31. PMID: 6847134
8. McDonald WI, Compston A, Edan G, Goodkin D, Hartung HP, Lublin FD, et al. Recommended diagnos-tic criteria for multiple sclerosis: guidelines from the International Panel on the diagnosis of multiple sclerosis. Annals of Neurology. 2001. pp. 121–7.
9. Polman CH, Reingold SC, Edan G, Filippi M, Hartung H-P, Kappos L, et al. Diagnostic criteria for multi-ple sclerosis: 2005 revisions to the "McDonald Criteria". Ann Neurol. 2005 Dec; 58(6):840–6. PMID: 16283615
10. Baumhackl U, Eibl G, Ganzinger U, Hartung HP, Mamoli B, Pfeiffer KP, et al. Prevalence of multiple sclerosis in Austria. Results of a nationwide survey. Neuroepidemiology. 2002 Sep; 21(5):226–34. PMID:12207150
11. Asamer E-M, Bachholz N, Bauer A, Bettel I, Blauensteiner S, Einfalt J, et al. Census 2011 Austria. Blauensteiner S, editor. STATISTICS AUSTRIA. 2014 May 28;:1–82.
12. Lublin FD, Reingold SC. Defining the clinical course of multiple sclerosis: results of an international sur-vey. National Multiple Sclerosis Society (USA) Advisory Committee on Clinical Trials of New Agents in Multiple Sclerosis. Neurology. 1996 Apr; 46(4):907–11. PMID:8780061
13. Schumacker GA, Beebe G, Kibler RF, Kurland LT, Kurtzke JF, McDowell F, et al. Problems of experi-mental trials of therapy in multiple sclerosis: report by the panel on the evaluation of experiexperi-mental trials of therapy in multiple sclerosis. Ann N Y Acad Sci. 1965 Mar 31; 122:552–68. PMID:14313512
14. Kurtzke JF. Rating neurologic impairment in multiple sclerosis: an expanded disability status scale (EDSS). Neurology. 1983 Nov; 33(11):1444–52. PMID:6685237
15. Runmarker B, Andersen O. Prognostic factors in a multiple sclerosis incidence cohort with twenty-five years of follow-up. Brain. 1993 Feb; 116 (Pt 1):117–34. PMID:8453453
16. Tintore M, Rovira A, Río J, Otero-Romero S, Arrambide G, Tur C, et al. Defining high, medium and low impact prognostic factors for developing multiple sclerosis. Brain. 2015 Jul; 138(Pt 7):1863–74. doi:10. 1093/brain/awv105PMID:25902415
17. Dobson R, Ramagopalan S, Davis A, Giovannoni G. Cerebrospinal fluid oligoclonal bands in multiple sclerosis and clinically isolated syndromes: a meta-analysis of prevalence, prognosis and effect of lati-tude. J Neurol Neurosurg Psychiatr. 2013 Aug; 84(8):909–14. doi:10.1136/jnnp-2012-304695PMID: 23431079
18. Weinshenker BG, Bass B, Rice GP, Noseworthy J, Carriere W, Baskerville J, et al. The natural history of multiple sclerosis: a geographically based study. 2. Predictive value of the early clinical course. Brain. 1989 Dec; 112 (Pt 6)(6):1419–28.
19. Scalfari A, Neuhaus A, Degenhardt A, Rice GP, Muraro PA, Daumer M, et al. The natural history of mul-tiple sclerosis: a geographically based study 10: relapses and long-term disability. Brain. 2010 Jul; 133 (Pt 7):1914–29. doi:10.1093/brain/awq118PMID:20534650
20. Tremlett H, Yousefi M, Devonshire V, Rieckmann P, Zhao Y, UBC Neurologists. Impact of multiple scle-rosis relapses on progression diminishes with time. Neurology. Lippincott Williams & Wilkins; 2009 Nov 17; 73(20):1616–23. doi:10.1212/WNL.0b013e3181c1e44fPMID:19890070
21. Scalfari A, Neuhaus A, Daumer M, DeLuca GC, Muraro PA, Ebers GC. Early relapses, onset of pro-gression, and late outcome in multiple sclerosis. JAMA Neurol. 2013 Feb; 70(2):214–22. doi:10.1001/ jamaneurol.2013.599PMID:23407713
22. Eriksson M, Andersen O, Runmarker B. Long-term follow up of patients with clinically isolated syn-dromes, relapsing-remitting and secondary progressive multiple sclerosis. Multiple Sclerosis Journal. SAGE Publications; 2003 Jun; 9(3):260–74. PMID:12814173
23. Kremenchutzky M, Rice GPA, Baskerville J, Wingerchuk DM, Ebers GC. The natural history of multiple sclerosis: a geographically based study 9: observations on the progressive phase of the disease. Brain. 2006 Mar; 129(Pt 3):584–94. PMID:16401620
24. Koch MW, Patten S, Berzins S, Zhornitsky S, Greenfield J, Wall W, et al. Depression in multiple sclero-sis: A long-term longitudinal study. Mult Scler. 2014 May 22; 21(1):76–82. doi:10.1177/
1352458514536086PMID:24852924
Long Term Clinical Prognostic Factors in Relapsing-Remitting Multiple Sclerosis
25. Feinstein A, Roy P, Lobaugh N, Feinstein K, O'Connor P, Black S. Structural brain abnormalities in mul-tiple sclerosis patients with major depression. Neurology. 2004 Feb 24; 62(4):586–90. PMID:
14981175
26. Kiy G, Lehmann P, Hahn HK, Eling P, Kastrup A, Hildebrandt H. Decreased hippocampal volume, indi-rectly measured, is associated with depressive symptoms and consolidation deficits in multiple sclero-sis. Mult Scler. 2011 Sep; 17(9):1088–97. doi:10.1177/1352458511403530PMID:21546523
27. Bakshi R, Czarnecki D, Shaikh ZA, Priore RL, Janardhan V, Kaliszky Z, et al. Brain MRI lesions and atrophy are related to depression in multiple sclerosis. Neuroreport. 2000 Apr 27; 11(6):1153–8. PMID: 10817583
28. Koch M, Uyttenboogaart M, van Harten A, Heerings M, De Keyser J. Fatigue, depression and progres-sion in multiple sclerosis. Multiple Sclerosis Journal. 2008 Jul; 14(6):815–22. doi:10.1177/
1352458508088937PMID:18535019
29. Rao SM, Leo GJ, Bernardin L, Unverzagt F. Cognitive dysfunction in multiple sclerosis. I. Frequency, patterns, and prediction. Neurology. 1991 May; 41(5):685–91. PMID:2027484
30. Denney DR, Sworowski LA, Lynch SG. Cognitive impairment in three subtypes of multiple sclerosis. Arch Clin Neuropsychol. 2005 Dec; 20(8):967–81. PMID:15961271
31. Amato MP, Ponziani G, Siracusa G, Sorbi S. Cognitive dysfunction in early-onset multiple sclerosis: a reappraisal after 10 years. Arch Neurol. 2001 Oct; 58(10):1602–6. PMID:11594918
32. Zivadinov R, Sepcic J, Nasuelli D, De Masi R, Bragadin LM, Tommasi MA, et al. A longitudinal study of brain atrophy and cognitive disturbances in the early phase of relapsing-remitting multiple sclerosis. J Neurol Neurosurg Psychiatr. 2001 Jun; 70(6):773–80. PMID:11385012
33. Arnett PA. Longitudinal consistency of the relationship between depression symptoms and cognitive functioning in multiple sclerosis. CNS Spectr. 2005 May; 10(5):372–82. PMID:15858455
34. LandrøNI, Celius EG, Sletvold H. Depressive symptoms account for deficient information processing speed but not for impaired working memory in early phase multiple sclerosis (MS). Journal of the Neu-rological Sciences. 2004 Feb 15; 217(2):211–6. PMID:14706226
35. Good K, Clark CM, Oger J, Paty D, Klonoff H. Cognitive impairment and depression in mild multiple sclerosis. J Nerv Ment Dis. 1992 Nov; 180(11):730–2. PMID:1431826
36. Confavreux C, Hutchinson M, Hours MM, Cortinovis-Tourniaire P, Moreau T. Rate of pregnancy-related relapse in multiple sclerosis. Pregnancy in Multiple Sclerosis Group. N Engl J Med. 1998 Jul 30; 339 (5):285–91. PMID:9682040
37. Vukusic S, Hutchinson M, Hours M, Moreau T, Cortinovis-Tourniaire P, Adeleine P, et al. Pregnancy and multiple sclerosis (the PRIMS study): clinical predictors of post-partum relapse. Brain. 2004 Jun; 127(Pt 6):1353–60. PMID:15130950
38. Goodkin DE. EDSS reliability. Neurology. 1991 Feb; 41(2 (Pt 1)):332. PMID:1992392
39. Stangel M.; Penner I. K.; Kallmann B. A.; Lukas C.; Kieseier B. C. Towards the implementation of‘no evidence of disease activity’in multiple sclerosis treatment: the multiple sclerosis decision model. Ther Adv Neurol Disord 2015, 8, 3–13. doi:10.1177/1756285614560733PMID:25584069