Evolution and Expression
Lin Feng1., Zhu Chen1., Hui Ma1
, Xue Chen1, Yuan Li1, Yiyi Wang1, Yan Xiang1,2*
1Laboratory of Modern Biotechnology, School of Forestry and Landscape Architecture, Anhui Agricultural University, Hefei, China,2Key Laboratory of Crop Biology of Anhui Agriculture University, Hefei, China
Abstract
Members of the plant-specific IQ67-domain (IQD) protein family are involved in plant development and the basal defense response. Although systematic characterization of this family has been carried out in Arabidopsis, tomato (Solanum lycopersicum),Brachypodium distachyonand rice (Oryza sativa), systematic analysis and expression profiling of this gene family in soybean (Glycine max) have not previously been reported. In this study, we identified and structurally characterized IQD genes in the soybean genome. A complete set of 67 soybean IQD genes (GmIQD1–67) was identified using Blast search tools, and the genes were clustered into four subfamilies (IQD I–IV) based on phylogeny. These soybean IQD genes are distributed unevenly across all 20 chromosomes, with 30 segmental duplication events, suggesting that segmental duplication has played a major role in the expansion of the soybean IQD gene family. Analysis of the Ka/Ks ratios showed that the duplicated genes of the GmIQD family primarily underwent purifying selection. Microsynteny was detected in most pairs: genes in clade 1–3 might be present in genome regions that were inverted, expanded or contracted after the divergence; most gene pairs in clade 4 showed high conservation with little rearrangement among these gene-residing regions. Of the soybean IQD genes examined, six were most highly expressed in young leaves, six in flowers, one in roots and two in nodules. Our qRT-PCR analysis of 24 soybean IQD III genes confirmed that these genes are regulated by MeJA stress. Our findings present a comprehensive overview of the soybean IQD gene family and provide insights into the evolution of this family. In addition, this work lays a solid foundation for further experiments aimed at determining the biological functions of soybean IQD genes in growth and development.
Citation:Feng L, Chen Z, Ma H, Chen X, Li Y, et al. (2014) The IQD Gene Family in Soybean: Structure, Phylogeny, Evolution and Expression. PLoS ONE 9(10): e110896. doi:10.1371/journal.pone.0110896
Editor:Marc Robinson-Rechavi, University of Lausanne, Switzerland
ReceivedJune 27, 2014;AcceptedSeptember 19, 2014;PublishedOctober 24, 2014
Copyright:ß2014 Feng et al. This is an open-access article distributed under the terms of the Creative Commons Attribution License, which permits unrestricted use, distribution, and reproduction in any medium, provided the original author and source are credited.
Data Availability:The authors confirm that all data underlying the findings are fully available without restriction. All relevant data are within the paper and its Supporting Information files.
Funding:This work was supported by grants from the National Natural Science Foundation of China (No. 31370561),Specialized research Fund for the Doctoral Program of Higher Education(No.20133418110005), Anhui Provincial Natural Science Foundation (No. 1308085MC36)and Anhui Agricultural University disciplinary construction Foundation(No.XKTS2013001) The funders had no role in study design, data collection and analysis, decision to publish, or preparation of the manuscript.
Competing Interests:The authors have declared that no competing interests exist.
* Email: [email protected]
.These authors contributed equally to this work.
Introduction
Ca2+
is a pivotal cytosolic second messenger involved in many physiological processes such as plant growth [1], plant-pathogen interactions [2], photosynthetic electron transport and photophos-phorylation [3], regulation of stomatal aperture [4], hormonal regulation [5] and so on. Plants produce calcium signals by adjusting cytoplasm Ca2+
levels at specific times, places and concentrations [6], responding to numerous extracellular stimuli including physical signals (light, temperature, gravity, etc.) and chemical signals (plant hormones, pathogenic bacteria inducing factors, etc.) [7].
The transmission of these intracellular calcium signals relies on the oscillation signal generated by voltage- and ligand-gated Ca2+
-permeable channels (influx) and by Ca2+
-ATPases and antiporters (efflux) to return to resting Ca2+
levels [8,9]. The conduction of calcium signals is also dependent on downstream Ca2+
sensors. These Ca2+
sensors detect changes in Ca2+
levels by binding to Ca2+
via domains such as EF hands, which undergo
conformational changes [10]. Consequently, calcium signature information is decoded and relayed by these Ca2+
sensors [6,11–13].
To date, approximately four major classes of Ca2+sensors have
been identified in plants. Most of these sensors contain the Ca2+
-binding EF-hand motif, a conserved helix-loop-helix structure that can bind to a single Ca2+ion [7]. The four major classes of
Ca2+sensors are as follows: class A: calmodulin (CaM), containing
four EF-hand motifs; class B: calcineurin B-like (CBL) proteins, possessing three EF-hand motifs; class C: Ca2+-dependent protein
kinases (CDPK), containing four EF-hand motifs and a Ca2+
-dependent Ser/Thr protein kinase domain and class D: lacking EF-hand motifs [7,14–19].
Calmodulin (CaM) and calcineurin B-like (CBL) proteins, which lack catalytic activity, are sometimes referred to as ‘‘Ca2+
sensor relays’’ [15,19,20]. In contrast, CDPK proteins, which function as catalytic effectors, are referred to as ‘‘Ca2+
sensor responders’’ [18]. Among these Ca2+
-binding proteins, calmodulin is the most extensively studied Ca2+
resistant, heat resistant and highly stable. This multifunctional protein is widespread in eukaryotic cells, highly conserved and has at least 30 multiple target proteins or enzymes [21–23].
To mediate intracellular calcium signaling pathways, Ca2+
sensor relays expose their negative hydrophobic surfaces after they undergo conformational changes induced by Ca2+binding. As a
result, the affinity between Ca2+sensor relays and their effectors
are enhanced, and the biochemical activities of target proteins are modulated by Ca2+sensor relays [6,12,14,19].
In the final phase of the calcium signal transduction process, the target effectors respond to specific extracellular signals by regulating various cellular activities. Calmodulin interacts with numerous target proteins termed calmodulin-binding proteins (CaMBPs), mainly by recognizing and targeting calmodulin-binding domains (CaMBD; basic amphiphilic helices usually composed of 16–35 amino acid residues) in the CaMBPs via its negative hydrophobic pockets [12,22,24].
CaMBD amino acid sequences contain three CaMBD motifs that are grouped into two categories, including a Ca2+
-indepen-dent motif termed the IQ motif and two Ca2+
-dependent motifs referred to as the l-5-10 motif and the l-8-14 motif. The number and positions of these motifs in different CaMBPs are variable [25–27]. Due to the diversity of the motif arrangement, there are a variety of diverse CaMBPs with disparate functions, which are implicated in plant development, metabolic regulation, stress reactions, defense reactions, transcriptional regulation and so on [28,29].
Plant-specific IQ67 domain (IQD) protein families were first identified inArabidopsisand rice by Abel et al. (2005) [30]. These proteins have two common features in their IQ67 domains (67 conserved amino acid residues) [31]. One feature is 1–3 copies IQ motifs are separated by 11 and 15 residues and overlapped certain regions with 1–4 copies 1-5-10 motif as well as 1-8-14 motif. The other hallmark is a highly conserved exon-intron boundary that interrupts codons 16 and 17 with a 0 phase intron [31–33]. To date, IQD gene families have been identified in four genomes (Arabidopsis, rice, tomato andBrachypodium distachyon), includ-ing approximately 30 IQD genes per species (33 inArabidopsis, 29 in rice, 34 in tomato and 23 inBrachypodium distachyon), and the functions of several members of the IQD family have been reported [30,34,35]. Overexpression of Arabidopsis IQD1 can mediate the accumulation of glucosinolate in response to insect herbivory [31]. Arabidopsis IQD22 contributes to the negative feedback regulation of gibberellin (GA) [36]. The tomato SUN
gene plays a role in elongating tomato fruit by increasing the vertical division of cells and reducing horizontal cell divisions [37– 39].
Soybean serves as a major source of vegetable proteins and edible oil and own the ability to fix atmospheric nitrogen via its intimate symbiosis with microorganisms. This crucial leguminous seed crop has high economic and nutritional value [40,41], serving as a main food crop for humans and animals in many parts of the world. Nevertheless, soybean production is limited by many biotic stresses. For example, Asian soybean rust (ASR, caused by the fungus Phakopsora pachyrhizi) results in soybean yield losses ranging from 10 to 80% in various countries [42,43].
In this study, we identified and characterized 67 soybean IQD genes. Among these, we subjected 24 IQD III genes to qRT-PCR analysis to investigate their response to MeJA stress. We determined that all 24 soybean IQD genes are stress-responsive. Our findings lay the foundation of further investigations of the functions of these calmodulin target proteins in soybean.
Results
Identification and annotation of IQD genes in soybean As described in previous studies, IQD proteins, which are plant-specific calcium-dependent calmodulin-binding proteins, contain 67 amino acid residues in their central regions referred to as the IQ67 domain, including three CaM recruitment motifs exhibiting unique repetitive patterns. The Ca2+
-independent IQ motif (IQxxxRGxxxR or its more relaxed version [ILV]QxxxRxxxx [R, K]) is present in 1–3 copies and overlaps with 1–4 copies of the Ca2+
-dependent 1-5-10 motif ([FILVW]x3 [FILV]x4 [FILVW]) and the 1-8-14 motif ([FILVW]x6 [FAILVW]x5 [FILVW]) by several conserved basic and hydrophobic amino acid residues flanking these motifs [30,34]. These features allow the IQ67 domain to fold into a basic amphiphilic helix structure, which enables these proteins to perform specific roles.
To conducted genome-wide identification of IQD gene families in soybean, we performedGlycine maxgenome BLASTP analysis. Through removing redundant sequences and pattern identificat-ing, a total of 67 IQD genes were identified in the soybean genome, which is twice that ofArabidopsis(Table 1 and 2). We named these 67 IQD genesGmIQD1toGmIQD67according to their physical locations (from top to bottom) on chromosomes 1– 20 (Table 1).
The physicochemical parameters of each gene were calculated using ExPASy. Although all of the GmIQD genes encode the conserved IQ67 domains (Figure S1), their sequences are highly diverse with respect to size (141–904 aa) and molecular mass (16.3–99.2 kDa; Table 1). Almost all soybean IQD proteins (97%) have relatively high isoelectric points (pI.7.0 with an average of 10.1), except for GmIQD9 (pI 5.4) and GmIQD17 (pI 5.7; Table 1). All soybean IQD proteins were submitted to TargetP and Wolf PSORT to predict their subcellular localizations. Wolf PSORT revealed that fifty-seven soybean IQD proteins are localized to the nucleus, nine to the chloroplast and one to the endoplasmic reticulum. TargetP analysis revealed that fifteen soybean IQD proteins are located in the mitochondria, five in the chloroplast, one in the secretory pathway and forty-six in other compartments (Table 1). The detailed parameters are provided in Table 1.
Phylogenetic and structural analyses of the soybean IQD genes
To infer the similarity and evolutionary ancestry of soybean IQD proteins, we constructed an unrooted phylogenetic tree of the 67 soybean protein sequences. The soybean IQD gene family was categorized into four major subfamilies (subfamily I, II, III and IV; Figure 1a) according to phylogenetic analysis of IQD genes in
Arabidopsis, rice, tomato andBrachypodium distachyon[30,34,35]. Subfamily I was further divided into four subclasses (clade Ia, Ib, Ic and Id), and subfamily II and III were divided into two subclasses (clade IIa and IIb; clade IIIa and IIIb) based on bootstrap values, the existence and positions of introns and the presence of protein motifs flanking the IQ67 domain (Figure 1 and 2). Subfamily I (containing 27 members) is the largest group, followed by subfamily III (24) and subfamily IV (10). Subfamily II has the fewest IQD gene members (6). This distribution pattern is similar to that observed for IQD genes inArabidopsis and rice (Table 2). The phylogenetic tree reveals that 62 of the 67 soybean IQD genes form 31 gene pairs with strong bootstrap values (Figure 1a).
Name Gene Identifier Chr. Location coordinates (59-39)
ORF length
(bp) Protein Exons subcellular localization
Length (aa.) pI Mol.Wt. (kD) WoLF PSORT TargetP
GmIQD1 Glyma01g01030 1 681417–683646 1263 420 10.3 46.6 3 N M0.65/4
GmIQD2 Glyma01g05100 1 4750065–4755456 1692 563 9.7 61.7 6 N C0.68/3
GmIQD3 Glyma01g42620 1 53843322–53846963 1191 396 10.4 44.4 4 N M0.54/5
GmIQD4 Glyma02g00710 2 502944–506146 1254 417 9.6 46.8 3 N ?
GmIQD5 Glyma02g02370 2 1778568–1785636 1692 563 9.8 61.7 6 N M0.43/5
GmIQD6 Glyma02g15590 2 14083370–14089609 1608 535 10.8 60.1 5 N ?
GmIQD7 Glyma03g33560 3 41092523–41096935 1434 477 10.0 53.3 5 N ?
GmIQD8 Glyma03g40630 3 46330165–46332185 1125 374 10.5 42.4 3 N ?
GmIQD9 Glyma04g02830 4 2030287–2036251 2715 904 5.4 99.2 6 N ?
GmIQD10 Glyma04g05520 4 4187757–4190317 1353 450 10.5 49.9 5 N ?
GmIQD11 Glyma04g23760 4 27192306–27195532 1353 450 9.8 50.8 5 N ?
GmIQD12 Glyma04g34150 4 40144241–40151603 1752 583 9.4 64.6 6 N ?
GmIQD13 Glyma04g41380 4 47220698–47225472 1392 463 9.6 51.7 4 N ?
GmIQD14 Glyma05g01240 5 785189–792757 1761 586 9.7 64.9 6 N ?
GmIQD15 Glyma05g03450 5 2638386–2641896 1338 445 10.0 48.9 4 N ?
GmIQD16 Glyma05g35920 5 39871246–39873985 1128 375 10.0 41.4 4 N M0.81/3
GmIQD17 Glyma06g02841 6 1950849–1956820 2532 843 5.7 92.8 6 N ?
GmIQD18 Glyma06g05530 6 3957759–3960421 1353 450 10.7 49.8 5 E.R. ?
GmIQD19 Glyma06g13470 6 10606168–10611219 1341 446 9.7 50.1 4 N ?
GmIQD20 Glyma06g20341 6 16752231–16759304 1755 584 9.5 64.9 6 N ?
GmIQD21 Glyma07g01040 7 607467–610485 1302 433 10.0 47.9 5 N ?
GmIQD22 Glyma07g01760 7 1164144–1167157 1191 396 10.2 44.6 3 N ?
GmIQD23 Glyma07g05680 7 4335391–4339373 1641 546 10.3 61.2 5 N ?
GmIQD24 Glyma07g14910 7 14801071–14803234 1398 465 10.0 51.8 3 C S0.90/1
GmIQD25 Glyma07g32531 7 37416802–37421879 873 290 10.6 32.8 5 N ?
GmIQD26 Glyma07g32860 7 37753882–37759623 1602 533 10.9 59.7 5 N ?
GmIQD27 Glyma08g03710 8 2630927–2633769 1311 436 10.2 48.2 3 N M0.77/4
GmIQD28 Glyma08g20430 8 15453660–15456579 1266 421 10.4 46.4 5 N M0.56/5
GmIQD29 Glyma08g21430 8 16271106–16273575 1209 402 10.3 45.2 3 N ?
GmIQD30 Glyma08g40880 8 40742659–40748073 1644 547 9.8 60.6 6 C C0.75/3
GmIQD31 Glyma09g26630 9 33163730–33169453 1449 482 10.0 53.3 4 C M0.51/4
GmIQD32 Glyma09g30780 9 37552192–37557238 1305 434 10.1 48.0 6 N ?
GmIQD33 Glyma09g35920 9 41794962–41798738 1407 468 9.9 52.6 5 N M0.60/4
IQD
Gene
Family
in
Soybean
ONE
|
www.ploson
e.org
3
October
2014
|
Volume
9
|
Issue
10
|
Name Gene Identifier Chr. Location coordinates (59-39)
ORF length
(bp) Protein Exons subcellular localization
Length (aa.) pI Mol.Wt. (kD) WoLF PSORT TargetP
GmIQD34 Glyma10g00630 10 386683–389158 1272 423 9.5 47.5 3 N M0.33/5
GmIQD35 Glyma10g05720 10 4477640–4481520 1425 474 10.0 52.8 5 N ?
GmIQD36 Glyma10g35721 10 43974896–43978361 1452 483 10.6 53.0 5 N ?
GmIQD37 Glyma10g38310 10 46118444–46123432 1395 464 10.4 51.0 4 C M0.54/5
GmIQD38 Glyma10g39030 10 46764292–46767407 1410 469 9.7 52.0 4 N ?
GmIQD39 Glyma11g20880 11 17714458–17717939 1374 457 10.0 51.7 5 N M0.67/3
GmIQD40 Glyma12g01410 12 842971–846738 1383 460 10.0 51.8 5 N M0.56/4
GmIQD41 Glyma12g31610 12 35181013–35188577 1269 422 9.9 46.5 6 N ?
GmIQD42 Glyma12g35711 12 38833825–38837834 885 294 9.8 34.2 5 N ?
GmIQD43 Glyma13g20070 13 23539750–23543840 1413 470 10.1 52.3 5 N C0.34/5
GmIQD44 Glyma13g24070 13 27399608–27404534 774 257 10.5 29.3 4 N ?
GmIQD45 Glyma13g30590 13 33154582–33158861 900 299 10.4 33.6 5 N ?
GmIQD46 Glyma13g34700 13 36237460–36241896 1173 390 9.8 45.5 6 N ?
GmIQD47 Glyma13g38800 13 39521853–39528595 1278 425 9.9 47.1 6 N ?
GmIQD48 Glyma13g42440 13 42441870–42445047 1239 412 10.3 45.8 5 N ?
GmIQD49 Glyma13g43031 13 42796469–42804226 1143 380 10.2 43.4 3 N ?
GmIQD50 Glyma14g11050 14 9335703–9339095 1254 417 10.3 47.3 5 N ?
GmIQD51 Glyma14g25860 14 31470493–31475301 1377 458 10.0 51.3 4 N ?
GmIQD52 Glyma15g02370 15 1595640–1598698 1137 378 10.2 43.3 3 N ?
GmIQD53 Glyma15g02940 15 2051157–2053854 1251 416 10.3 45.9 5 C ?
GmIQD54 Glyma15g08660 15 6125483–6129362 927 308 10.3 34.7 5 N ?
GmIQD55 Glyma16g02240 16 1759053–1762330 1653 550 10.2 61.6 5 N M0.37/5
GmIQD56 Glyma16g22935 16 26564269–26565120 426 141 11.1 16.3 2 C M0.82/4
GmIQD57 Glyma16g32161 16 35337880–35343544 1434 477 10.0 52.8 4 C M0.56/4
GmIQD58 Glyma17g10660 17 8002515–8009332 1767 588 9.5 65.0 6 N ?
GmIQD59 Glyma17g14000 17 10763173–10767584 1344 447 10.0 48.9 4 N ?
GmIQD60 Glyma17g23770 17 23932487–23938307 1386 461 10.4 50.7 5 N ?
GmIQD61 Glyma17g34520 17 38500561–38503843 1242 413 10.4 46.7 5 N ?
GmIQD62 Glyma18g16130 18 16440695–16446996 1644 547 9.7 60.3 6 N C0.65/4
GmIQD63 Glyma19g36270 19 43610551–43615073 1434 477 10.0 53.3 5 N ?
GmIQD64 Glyma19g43300 19 48995941–48998264 1113 370 10.6 42.2 3 N ?
GmIQD65 Glyma20g28800 20 37708013–37709907 1434 477 9.8 52.7 3 N C0.67/5
GmIQD66 Glyma20g29550 20 38392614–38397440 1371 456 10.5 50.3 4 C ?
GmIQD67 Glyma20g31810 20 40423269–40426995 1470 489 10.4 53.7 5 C ?
bp, base pair; aa, amino acids; kD, kilo Dalton.
IQD
Gene
Family
in
Soybean
ONE
|
www.ploson
e.org
4
October
2014
|
Volume
9
|
Issue
10
|
with corresponding cDNA sequences revealed that most of the gene models predicted by GSDS are correct, except for one pair of genes (GmIQD9/-17). BothGmIQD9andGmIQD17encode six exons, but GSDS predicted that these genes contain only five exons. This unconformity is caused by the missing annotation of the fifth intron by GSDS. The schematic structures reveal that the coding sequence of each IQD gene contains 2–6 translated exons (Figure 1b), which is similar to that reported in Arabidopsis, rice and Brachypodium distachyon[30,34]. More than three–fifths of the soybean IQD gene family (41 members) contain five or six protein-coding exons, and one gene (GmIQD56, encoding the smallest protein, comprising 141 aa) contains two exons (Fig-ure 1b). Most closely related soybean IQD members in the same subfamilies share similar intron numbers and exon lengths. Soybean IQD genes in subfamily II and IV possess five and six exons, respectively. Most members in subfamily III contain five exons, except for GmIQD44 (four exons) and GmIQD32,
GmIQD41, GmIQD46 and GmIQD47 (six exons). Subfamily I genes harbor 2–5 exons. All introns of most IQD genes are in phase-0 (interrupting two triplet codons exactly); a phase-1 intron (separating the first and second nucleotides of a codon) was found in 15 remaining IQD genes, and no phase-2 intron (splitting the second and third nucleotides of a codon) was found (Figure 1b).
The exon/intron organization of 31 paralogous pairs that clustered together at the terminal branch of the phylogenetic tree was further examined to obtain traceable intron gain/loss information. Although twenty-seven paralogous pairs exhibited conserved exon/intron structures, four pairs (GmIQD16/-27,
GmIQD38/-65, GmIQD25/-44 and GmIQD42/-46) showed certain variations (Figure 1b). These differences may have been derived from single intron loss or gain events during the long evolutionary period. Based on analysis of the exon/intron organization of IQD genes from soybean, Arabidopsis[30], rice [30], and Brachypodium distachyon [34], we infered that both
GmIQD16 and GmIQD38 gained the third intron; GmIQD46
gained the first intron whileGmIQD44lost the first intron. The second or third exons in the central regions of most members encode amino acids 17–67 of the IQ67 domain, except for
GmIQD46(the fourth exon) andGmIQD56(the C-terminal exon), with a conserved phase-0 intron separating codons 16 and 17 (Figure 1b and Figure S1).
A total of 67 IQD genes from soybean were subjected to analysis with MEME to reveal conserved domains or motifs shared among related proteins. We identified 10 conserved motifs (Figure 2 and Table S1). Each of the putative motifs was annotated by searching Pfam and SMART. Motif 1 was found to encode the IQ domain. Motif 2 and motif 7 were found to encode proteins of unknown function (DUF4005) and (DUF3982). While the other subfamily-specific motifs have not functional annotation. As expected, most of the closely related members had common motif compositions,
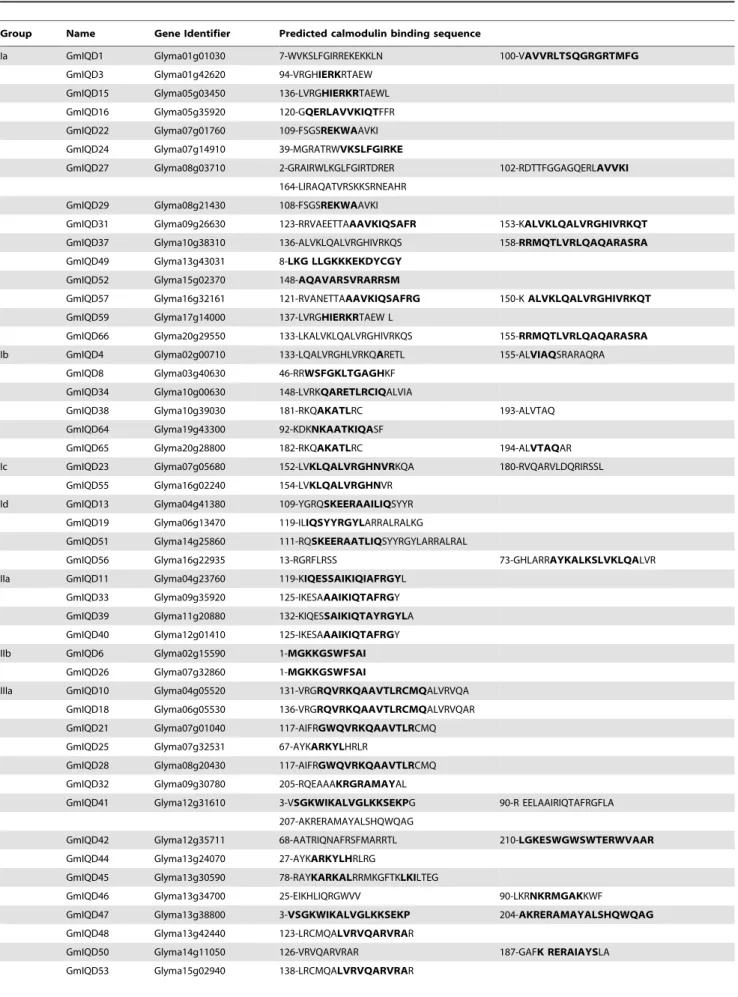
suggesting functional similarities among IQD proteins within the same subfamily (Figure 2). The most common motif is motif 1, found in all sixty-seven soybean IQD genes (Figure 2). Motif 8 is mainly present in subfamily I besides one ofGmIQD14exists in subfamily IV. Subfamily III members contain motif 1, motif 10, motif 4 and motif 3 in order, except forGmIQD28lacking motif 10. Motif 7 is peculiar to subfamily IV. To some extent, these subfamily-specific motifs may contribute to the functional diver-gence of IQD genes in soybean. The detailed information is shown in table S1. To predict calmodulin-binding sites, we searched the Calmodulin Target Database, which provides various structural and biophysical parameters for the 67 soybean IQD protein sequences. This analysis predicted that all soybean IQD proteins contain multiple IQ motifs and 1–3 strings of high-scoring amino acid residues (Table 3). These IQ motifs and amino acid residues indicate the locations of putative calmodulin interaction sites. Among the 67 IQD protein sequences, the predicted calmodulin binding sites of 50 sequences overlap with the IQ67 domain (Figure 2).
Chromosomal location and gene duplication
The 67 soybean IQD genes were mapped to all 20 soybean chromosomes. The distribution of soybean IQD genes varies depending on the chromosome and appears to be unequal. Both chromosomes 11 and 18 contain only one soybean IQD gene, while chromosomes 13, which possesses seven IQD genes, has the highest number of IQD genes per chromosome. Although high densities of IQD genes were found on some chromosomal regions, for instance, the bottom of chromosome 13, these is no substantial clustering of soybean IQD genes on the map (Figure 3).
We investigated gene duplication events to further understand the expansion mechanism of the soybean IQD family. Except for three genes (GmIQD11, -39 and -51) located outside of a duplicated block, 64 genes were mapped onto 48 related duplicated blocks (Figure 3 and Table S2). Among these, twenty-two block pairs retained thirty GmIQD gene pairs, whereas the remaining four duplication blocks harborGmIQD3, -32, -56 and -60 respectively, but lack IQD sisters in their corresponding synteny blocks (Figure 3 and Table S2). Analysis of GmIQD paralogous pairs showed that one pair (GmIQD11/-39) appear to be closely related paralogs, sharing 91.2% identity (Table S3) as well as similar exon–intron organization. However, both of them exist outside of any duplicated blocks. Except for
GmIQD11/-39, 30 out of 31 gene pairs have remained in conserved positions on segmental duplicated blocks, indicating that these genes were generated by segmental duplication. Furthermore, we analyzed the adjacent genes to determined whether tandem duplication has taken place. A pair of genes separated by three or fewer genes within a 100-kb region on a
Table 2.Number of IQD genes in the soybean, rice,Arabidopsis, tomato andBrachypodium distachyongenomes.
Subfamily Soybean Arabidopsis Tomato Rice Brachypodium distachyon
I 27 13 15 11 9
II 6 4 6 1 2
III 24 10 10 10 9
IV 10 5 3 3 2
Outgroup 1 4 1
Total number 67 33 34 29 23
chromosome may have resulted from tandem duplication. According to this criterion, no pair was found to be generated by tandem duplication. Therefore, segmental duplication appears to have played a crucial role in the expansion of the IQD gene family in soybean (Figure 3 and Table S2).
To explore the selective constraints on duplicated soybean IQD genes, we calculated the ratio of nonsynonymous versus synony-mous substitutions (Ka/Ks) for each pair of duplicated IQD genes. In general, a ratio of 1 indicates that both genes are drifting neutrally; a Ka/Ks ratio.1 indicates accelerated evolution with positive selection, while a ratio,1 indicates functional constraint, with negative or purifying selection of the genes[44]. The Ka/Ks ratios from 31 soybean IQD paralogous pairs (Table 4) were less than 0.6. This result suggests that the soybean IQD gene family has evolved mainly under the influence of strong purifying selection pressure, with limited functional divergence occurring after segmental duplication. Duplication of these 31 paralogous pairs was estimated to have occurred between 6.39 to 17.94 Mya (Table 4), according to the divergence rate of 6.161029 synon-ymous mutations per synonsynon-ymous site per year, as previously proposed for soybean [45,46].
Comparative analysis of the IQD genes in soybean,
Arabidopsis, rice, tomato andBrachypodium distachyon
The development of comparative genomics has enabled the analysis of the same protein families among different species. We constructed an NJ phylogenetic tree using 184 full-length protein sequence to reveal the evolutionary relationships among soybean,
Arabidopsis, rice, tomato and Brachypodium distachyon IQD proteins [34]. InArabidopsis, the IQD gene family is divided into four subfamilies, with AtIQD33 (containing a C-terminally truncated IQ67 domain) as the outgroup. Therefore, based on their phylogenetic relationships, the combined phylogenetic tree can be divided into five distinct subfamilies (I to V; Figure 4) [30]. In general, IQD I genes comprise the largest subfamily in these plant species, except for Brachypodium distachyon, where both IQD I and III comprise the largest subfamilies. By contrast, IQD V genes comprise the smallest IQD subfamily (Figure 4, Table 2). To illustrate the paralogous and orthologous relationships among IQD family members, the subfamilies were further divided into subgroups using previously defined clades from studies of
Arabidopsis, rice and tomato IQDs, as shown in Figure 4. IQD subfamily I was divided into four subclasses, i.e., a, b, c and d, and clade b was further divided into two clades, b1and b2. Because one of the IQD Ib clades only contains four IQD genes (BdIQD11,
BdIQD19,OsIQD19andOsIQD20) from monocots, we assigned these four genes to the rice- andBrachypodium distachyon-specific Ib2 clade. The clade containing the genes encoding C-terminal IQ67 domains was defined as Id. Notably, no members of
Brachypodium distachyon were detected in this clade, suggesting thatBrachypodium distachyonIQD family lost its members of this subgroup during the long period of evolution. Both IQD II and IQD III subfamilies were divided into two subclasses, a and b, which were designated as described by Zejun et al.(2013) and Abel et al. (2005) [35]. The C-terminally truncated IQ67
domain-containing genes (At IQD33,OsIQD28andBdIQD14) comprise IQD V subfamily (Figure 4) [30,34].
The combined phylogenetic tree reveals that most genes in the IQD family, especially the duplicated genes, are contained in paralogous pairs in each species, which supports the occurrence of species-specific IQD gene duplication events. By contrast, we identified 20 pairs of orthologous genes from monocotyledons (rice and Brachypodium distachyon) distributed among all of the subfamilies. In addition, two pairs of orthologous genes from dicotyledons (soybean and tomato) stemming from subfamily I (GmIQD56 and SlSUN9) and subfamily III (GmIQD60 and
SlSUN13) were found. AndAtIQD20andOsIQD26, members of subfamily I, formed a pair of orthologous genes.
Conserved microsynteny of IQD III genes from soybean,
Arabidopsisand tomato
The analysis of microsynteny provides valuable information for identifying gene expansion patterns and inferring gene orthology or paralogy. We combined genetic and phylogenetic analyses to perform microsynteny analysis of three dicotyledons, i.e., soybean, tomato andArabidopsis.
To provide a basic framework for the identification of IQD III orthologous or paralogous genes, 44 IQD III genes, including 24 predicted soybean IQDs, 10 Arabidopsis IQDs and 10 tomato IQDs, were classified into four distinct clades, clade 1 (thirteen genes), clade 2 (five genes), clade 3 (eleven genes) and clade 4 (fifteen genes), based on phylogenetic analysis (Figure S2). Clade 1, 2 and 3 correspond to IQD IIIa and clade 4 corresponds to IQD IIIb (Figure 4 and S2). Each clade contains at least one gene from soybean, tomato andArabidopsis, indicating that members from different species may be derived from a common ancestor.
Subsequently, to produce a comparative genetic map, 44 IQD III genes from the three dicot genomes were used as anchor genes. Conserved microsynteny was identified through reciprocal pair-wise comparisons of the chromosomal regions containing IQD III genes. Microsynteny relationships among AtIQD3, AtIQD4, AtIQD5, GmIQD32, GmIQD56 or SlSUN13 with other IQD III members in these three dicot genomes were not observed. The map reveals that the 38 conserved syntenic segments diverged into four groups (Figure 5), which were anastomosed with the classification revealed by phylogenetic tree analysis.
In clade 1 (Figure 5a), Map a shows a higher level of microsynteny, with both the same and opposite directions.
SlSUN11/GmIQD21andGmIQD53/GmIQD48exhibit remark-able opposite-direction microsynteny, while GmIQD10/
GmIQD18, GmIQD21/GmIQD28, AtIQD7/AtIQD8 and
AtIQD8/SlSUN11 are aligned with flanking gene pairs in the same order but discordant transcriptional orientation. In addition, genes in map a were divided into two groups (Figure 5a), i.e., one group with higher levels of microsynteny (GmIQD21,GmIQD28,
GmIQD53, GmIQD48, AtIQD7, AtIQD8 and AtIQD8 and
SlSUN11) and the other group with lower levels of microsynteny (GmIQD61, GmIQD50, GmIQD10, GmIQD18, AtIQD6 and
SlSUN22). These two groups were also detected in the phylogenetic tree of IQD III genes (Figure S2). In clade 2 (Figure 5b), two pairs from soybean and tomato, GmIQD41/
Figure 1. Phylogenetic relationships and exon/intron organization of soybean IQD genes. a:Unrooted tree generated with Clustal X2.0 using the full-length amino acid sequences of the 67 soybean IQD proteins by the Neighbor-Joining (NJ) method with 1,000 bootstrap replicates. Subfamilies and subclasses of IQD genes (I–IV) are highlighted with different colored backgrounds and vertical bars next to the gene names of the tree.b:Exon/intron organization of soybean IQD genes. Green boxes represent exons and black lines represent introns. Untranslated regions (UTRs) are indicated by blue boxes. Numbers 0 and 1 represent the splicing phases. The sizes of exons and introns can be estimated using the scale at the bottom. The exon encoding amino acids 17–67 of the IQ67 domain in each soybean gene is indicated with an asterisk.
SlSUN31 and GmIQD47/SlSUN31, exhibited microsynteny. However, the predicted duplicated pair GmIQD41/GmIQD47
had no detectable linkage with each other. High level of microsynteny exists in Clade 3, with most pairs in reverse order (Figure 5c), especially GmIQD42/GmIQD46, GmIQD45/
GmIQD54 and GmIQD25/GmIQD44. GmIQD45/GmIQD44
and GmIQD44/SlSUN33 were identified as having same-direction microsynteny. In clade 4 (Figure 5d), we also observed a higher level of microsynteny. Except for AtIQD2/SlSUN29,
SlSUN30/SlSUN29 and GmIQD67/GmIQD36, which are aligned in the opposite direction, most gene pairs in this clade have successive collinearity in order and the same orientation.
Two regions are considered to have originated from a large-scale duplication event when five or more protein-coding gene pairs flanking the anchor point are ligatured with the best non-self match (E-value,1e210) [47,48]. Applying this standard, except for the pair GmIQD41/GmIQD47, all soybean IQD III para-logous gene pairs were generated from a large-scale duplication event, which further supports the results of soybean gene duplication analysis (Figure 5, Table S4).
To estimate the degree of conserved gene content and order, the synteny quality was calculated [47]. The average synteny quality of IQD III genes from the three dicotyledons genomes was 18.41% (Table S5d). Due to the large number of syntenic genes between tomato and soybean, the synteny quality between these genomes is 26.39%; this value is higher than that observed in the Sl/At synteny blocks (16.68%). The lowest synteny quality (12.15%) was found between soybean and Arabidopsis (Table S5). Details of this comparative analysis are shown in Table S5.
Expression patterns of soybean IQD genes in various tissues
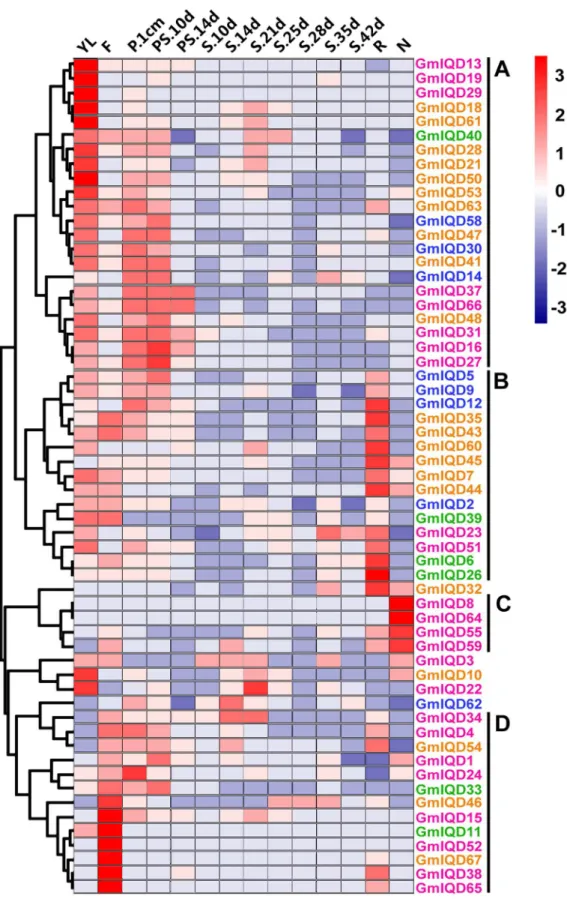
To gain insight into the expression patterns of soybean IQD genes in various tissues, we searched the RNA-Seq Atlas ofGlycine max; this atlas provides high-resolution gene expression data from 14 diverse tissues, including aerial tissues (young leaf, flower, one-cm pod, pod-shell 10-DAF and pod-shell 14-DAF), underground tissues (root and nodule) and seed tissue at various stages of development (seed 10-DAF, seed 14-DAF, seed 21-DAF, seed 25-DAF, seed 28-25-DAF, seed 35-DAF and seed 42-DAF). Because the expression profiles of eight IQD genes (GmIQD17,-20,-25,-36, -42, -49, -56, -57) weren’t obtained in the database, we only examined the expression patterns of fifty-nine IQD genes (Figure 6 and Table S6).
Most soybean IQD genes exhibit broad expression patterns (Figure 6). Forty-four soybean IQDs are expressed in all of the seven tissues (young leaves, flowers, one-cm pod, pod-shell, roots, nodules and seed). The heat map also revealed that the majority of GmIQDs showed preferential expression. Based on a hierarchical clustering analysis, fifty-nine IQD genes were mainly clustered into four groups (A–D) (Figure 6). Group A showed partial expression in young leaves, group B in roots, group C in nodules and group D in flowers. Eight GmIQDs (GmIQD8, -13, -19, -29, -36, -52, -64
and -67) showed marked high transcript abundance profiles in only a single tissue. Among the fifty-nine soybean IQD genes examined, six showed the highest transcript accumulation in young leaves (GmIQD13, -18, -19, -29, -50and-61), six in flowers
(GmIQD11, -15, -38, -52-65and -67), one in roots (GmIQD26) and two in nodules (GmIQD8 and -64; Figure 6). Genes in different subfamilies have their primary abundant transcripts, for instance, GmIQD I in leaves, flowers and nodules, GmIQD II in flowers and roots, GmIQD III in young leaves, flowers and roots and GmIQD IV in roots and young leaves (Figure 6). These subfamily-specific tissue expression patterns may be closely related to gene functions. The expression patterns of the paralogous pairs were also revealed by heat maps; paralogous pairs with high sequence similarity have similar expression patterns. The best examples of this includeGmIQD8/-64andGmIQD6/-26, which are strongly expressed in nodules and root respectively, with little or no expression in other tissues. Expression divergence was also found in paralogous pairs. For example, GmIQD15 is highly expressed in flowers, while its paralog, GmIQD59, is highly expressed in nodules.
Examination of soybean IQD gene expression by qRT-PCR
Since soybean production is limited by stress, it is important to identify the master regulators of stress responses in soybean, as well as their regulatory pathways. According to microsynteny analysis, the high level of microsynteny indicates that IQD III genes existed before the divergence of the three dicotyledon genomes examined (soybean, tomato andArabidopsis). In addition, IQD III genes in the same clade may share common ancestors and play similar roles in these species.AtIQD1, which belongs to the IQD III subfamily, plays a major role in the response to biotic stress, as it mediates the accumulation of glucosinolate in response to phytophagous insect attack. Jasmonic acid methyl ester (MeJA), the plant hormones and the signal molecules, widely exists in plants, which triggers expression of plants defense genes by exogenous applications and has similar effects with mechanical damage and insect herbivory [49,50]. Based on these, we subjected 24 members of the soybean IQD III subfamily to real-time quantitative PCR (qRT-PCR) analysis to examine their regulation by MeJA.
The qRT-PCR results show that all 24 genes are MeJA-responsive, but some differences were observed among these genes (Figure 7). Although 23 genes were upregulated by MeJA treatment,GmIQD21 was obviously downregulated (,0.5 folds) at all time points. Eleven of the twenty-three upregulated GmIQD III genes exhibited minor changes in expression (relative expression scale from 0 to 5 and lower), including GmIQD10, -18, -21, -25, -42, -47, -53, -61, -7, -36and -63. By contrast, 12 genes (GmIQD2, -32, -41, -44, -45, -46, -48, -50, -53, -54, -35, -43, -60and -67) exhibited major changes in expression (relative expression scales from 0 to 5 up 0 to 80). The expression of six genes (GmIQD35, -36, -47, -54, -63and -67) peaked relatively early (at 1 h of treatment); GmIQD54 and -67 were strongly upregulated (more than 26-fold and 34-fold, respectively). Eight genes (GmIQD10, -18, -28, -41, -42, -43, -53 and -60) were highly expressed at 4 h; GmIQD28 and -60 had the highest expression level more than 12-fold andGmIQD41had the highest expression level more than 28-fold. While seven genes (GmIQD7, -25, -32, -44, -46, -48 and-61) exhibited the highest expression levels at 8 h;GmIQD48were strongly induced by more than 35-fold. Only one gene (GmIQD45) had the highest expression level
Figure 2. Motif patterns in 67 IQD proteins of soybean.The schematic soybean IQD proteins were aligned relative to the IQ67 domain (motif 1, light blue box). The lengths of the proteins and motifs can be estimated using the scale. Motifs shared by at least four soybean IQD proteins are depicted at the reference bar on top of each alignment. The positions of putative calmodulin-binding sites predicted by the Calmodulin Target Database are indicated by vertical tick marks below each protein model. Subfamilies and subclasses (I–IV) of IQD proteins are highlighted with colored backgrounds and colored vertical bars as in Figure 1a to the right of the gene names.
Table 3.Predicted calmodulin binding sites in soybean IQD proteins.
Group Name Gene Identifier Predicted calmodulin binding sequence
Ia GmIQD1 Glyma01g01030 7-WVKSLFGIRREKEKKLN 100-VAVVRLTSQGRGRTMFG
GmIQD3 Glyma01g42620 94-VRGHIERKRTAEW
GmIQD15 Glyma05g03450 136-LVRGHIERKRTAEWL
GmIQD16 Glyma05g35920 120-GQERLAVVKIQTFFR
GmIQD22 Glyma07g01760 109-FSGSREKWAAVKI
GmIQD24 Glyma07g14910 39-MGRATRWVKSLFGIRKE
GmIQD27 Glyma08g03710 2-GRAIRWLKGLFGIRTDRER 102-RDTTFGGAGQERLAVVKI
164-LIRAQATVRSKKSRNEAHR
GmIQD29 Glyma08g21430 108-FSGSREKWAAVKI
GmIQD31 Glyma09g26630 123-RRVAEETTAAAVKIQSAFR 153-KALVKLQALVRGHIVRKQT
GmIQD37 Glyma10g38310 136-ALVKLQALVRGHIVRKQS 158-RRMQTLVRLQAQARASRA
GmIQD49 Glyma13g43031 8-LKG LLGKKKEKDYCGY
GmIQD52 Glyma15g02370 148-AQAVARSVRARRSM
GmIQD57 Glyma16g32161 121-RVANETTAAAVKIQSAFRG 150-KALVKLQALVRGHIVRKQT
GmIQD59 Glyma17g14000 137-LVRGHIERKRTAEW L
GmIQD66 Glyma20g29550 133-LKALVKLQALVRGHIVRKQS 155-RRMQTLVRLQAQARASRA
Ib GmIQD4 Glyma02g00710 133-LQALVRGHLVRKQARETL 155-ALVIAQSRARAQRA
GmIQD8 Glyma03g40630 46-RRWSFGKLTGAGHKF
GmIQD34 Glyma10g00630 148-LVRKQARETLRCIQALVIA
GmIQD38 Glyma10g39030 181-RKQAKATLRC 193-ALVTAQ
GmIQD64 Glyma19g43300 92-KDKNKAATKIQASF
GmIQD65 Glyma20g28800 182-RKQAKATLRC 194-ALVTAQAR
Ic GmIQD23 Glyma07g05680 152-LVKLQALVRGHNVRKQA 180-RVQARVLDQRIRSSL
GmIQD55 Glyma16g02240 154-LVKLQALVRGHNVR
Id GmIQD13 Glyma04g41380 109-YGRQSKEERAAILIQSYYR
GmIQD19 Glyma06g13470 119-ILIQSYYRGYLARRALRALKG
GmIQD51 Glyma14g25860 111-RQSKEERAATLIQSYYRGYLARRALRAL
GmIQD56 Glyma16g22935 13-RGRFLRSS 73-GHLARRAYKALKSLVKLQALVR
IIa GmIQD11 Glyma04g23760 119-KIQESSAIKIQIAFRGYL
GmIQD33 Glyma09g35920 125-IKESAAAIKIQTAFRGY
GmIQD39 Glyma11g20880 132-KIQESSAIKIQTAYRGYLA
GmIQD40 Glyma12g01410 125-IKESAAAIKIQTAFRGY
IIb GmIQD6 Glyma02g15590 1-MGKKGSWFSAI
GmIQD26 Glyma07g32860 1-MGKKGSWFSAI
IIIa GmIQD10 Glyma04g05520 131-VRGRQVRKQAAVTLRCMQALVRVQA
GmIQD18 Glyma06g05530 136-VRGRQVRKQAAVTLRCMQALVRVQAR
GmIQD21 Glyma07g01040 117-AIFRGWQVRKQAAVTLRCMQ
GmIQD25 Glyma07g32531 67-AYKARKYLHRLR
GmIQD28 Glyma08g20430 117-AIFRGWQVRKQAAVTLRCMQ
GmIQD32 Glyma09g30780 205-RQEAAAKRGRAMAYAL
GmIQD41 Glyma12g31610 3-VSGKWIKALVGLKKSEKPG 90-R EELAAIRIQTAFRGFLA
207-AKRERAMAYALSHQWQAG
GmIQD42 Glyma12g35711 68-AATRIQNAFRSFMARRTL 210-LGKESWGWSWTERWVAAR
GmIQD44 Glyma13g24070 27-AYKARKYLHRLRG
GmIQD45 Glyma13g30590 78-RAYKARKALRRMKGFTKLKILTEG
GmIQD46 Glyma13g34700 25-EIKHLIQRGWVV 90-LKRNKRMGAKKWF
GmIQD47 Glyma13g38800 3-VSGKWIKALVGLKKSEKP 204-AKRERAMAYALSHQWQAG
GmIQD48 Glyma13g42440 123-LRCMQALVRVQARVRAR
GmIQD50 Glyma14g11050 126-VRVQARVRAR 187-GAFK RERAIAYSLA
at 12 h, with a relative expression level approaching 70-fold. We also compared the expression profiles of paralogous pairs. Most paralogs in a pair had different expression profiles. For example, the expression of GmIQD28peaked at 4 h while its sister gene,
GmIQD21, was downregulated at all time points, suggesting that these genes may play diverse roles in the response to MeJA stress.
Discussion
Structural characteristics of IQD proteins
The plant-specific IQD gene family has previously been comprehensively analyzed in Arabidopsis, rice, tomato and
Brachypodium distachyon, this gene family has not been previously identified and annotated in soybean. We identified and charac-terized 67 IQ67 domain-encoding genes in soybean using genome-wide analysis. The IQD gene family in soybean is by far the largest one compared to that in other plant species (33 inArabidopsis, 29 in rice, 34 in tomato and 23 in Brachypodium distachyon). At ,1,150 Mbp, with ,46,400 predicted coding genes, soybean possesses 9.2-fold larger genome size and 1.75-fold higher gene count than Arabidopsis, which has a genome of 125 Mbp and ,26,500 coding genes [51]. Given the obvious difference in genome size and estimated gene count between soybean and
Arabidopsis, the IQD genes in soybean seems to be highly expanded. The presence of twice as many of these genes in soybean versus Arabidopsis may be mainly due to the recent polyploidy event and segmental duplication events in soybean’s evolutionary history. It can be speculated that the presence of more IQD genes in soybean genome may reflect the great needs
for these genes coding for calcium signal regulatory components with functions in plant development, defense response or others.
The common feature of IQ67 domain proteins is the arrangement of three IQ motifs separated by 11 and 15 intervening amino acid residues (Figure S1). To date, at least five protein families containing IQ motifs, which play a role in the calcium signaling pathway, have been identified in Arabidopsis. These protein families include the cyclic nucleotide gated channels family (CNGC), the IQ-Motif family (IQM), the CaM-binding transcriptional activator family (CAMTA), the myosin family and the IQD family, which contain one, one, two, five and up to three IQ motifs, respectively [52–54]. The unique spacing of IQ motifs and exon/intron organization of each family suggest that these IQD protein families represent separate classes of putative calmodulin targets. The calmodulin-interacting peptides in AtIQD20 and CNGC proteins, which were experimentally verified, were previously predicted using the algorithm provided by the Calmodulin Target Database successfully [30]. In the current study, using the Calmodulin Target Database, we detected calmodulin-binding sites in all soybean IQD proteins, which strongly suggests that all IQD proteins have the potential to interact with calmodulin (Figure 2 and Table 3). Three aspects of IQD proteins appear to underlie the mechanism of interaction between IQD proteins and calmodulin: the number and specific composition of the IQ, 1-5-10 and 1-8-14 motifs, the predicted calmodulin binding site and the overall tertiary structure of the IQD protein.
Of the 31 soybean IQD paralogs examined, 27 exhibit highly conserved exon-intron structures, which is consistent with the high
Table 3.Cont.
Group Name Gene Identifier Predicted calmodulin binding sequence
GmIQD54 Glyma15g08660 78-RAYKARKALRRMKGFTKLKILTEG
GmIQD61 Glyma17g34520 197-EGAF KRERAIAYSL
IIIb GmIQD7 Glyma03g33560 116-PKDEVAAIKIQTAFRGYL 227-LSKYEATTRRERALAYA
427-NGKAEKGSFGSAKKRLSF
GmIQD35 Glyma10g05720 111-EEMAAIRIQKAFRGYLA 218-KLLSKYEASMRRERAMAYS
GmIQD36 Glyma10g35721 1-MGRKGGWFSAV 292-HASAKSVASQTMSV
GmIQD43 Glyma13g20070 126-LARRELRALRGLV
GmIQD60 Glyma17g23770 1-MGKKGSWFSAV
GmIQD63 Glyma19g36270 116-PKDEVAAIKIQTAFRGYL 227-LSKYEATMRRERALAYA
427-NAKAEKGSFGSAKKRLSF
GmIQD67 Glyma20g31810 1-MGRKGGWFSAV 293-HASAKSVASQTMSV
IV GmIQD2 Glyma01g05100 130-LARQTFKKLEGV 175-RGYNVRRS
GmIQD5 Glyma02g02370 130-LARRTLQKLKGV
GmIQD9 Glyma04g02830 173-QAIIKMQILVRARRAR
GmIQD12 Glyma04g34150 13-LFGKKSSK SNISK 153-KLQALVRGGRIRQS
GmIQD14 Glyma05g01240 19-SKSNISKGREKLV
GmIQD17 Glyma06g02841 175-IIKMQILVRARRAWQ
GmIQD20 Glyma06g20341 20-KSNISKGRE
GmIQD30 Glyma08g40880 113-QAAIRGYQARG 163-LARGYKVRHS
GmIQD58 Glyma17g10660 12-VLFGKKSSKSNISK
GmIQD62 Glyma18g16130 115-IRGYQARGTFKTL 161-QALARGYKVRHSDV
Predicted calmodulin binding sites obtained from the Calmodulin Target Database are shown for strings of amino acid residues with a score of at least 7. Residues with the highest score (9) are highlighted in bold. Numbers before strings indicate the location of the first amino acid residues of the strings in soybean IQD protein sequences.
degree of position and phase conservation broadly found across angiosperms [41]. In addition, the sizes of related introns between paralogs are also highly conserved, indicating that few insertions and deletions have accumulated within introns over the past 13 million years [41]. Most introns in GmIQD genes are in phase-0. This strong bias for phase-0 introns in soybean IQD genes is also found in IQD genes of Arabidopsis, rice and Brachypodium distachyon. The strong bias for one intron phase class, along with the variation in the number of exons (two to six) and the sizes of encoded proteins, suggests that exon shuffling has played a prominent role during the evolution and diversification of IQD genes [30].
65 of 67 soybean IQD proteins have relatively high isoelectric points with an average of 10.1. It is very similar to Arabidopsis
(10.3), rice (10.4) andBrachypodium distachyon(10.3) [30,34]. The extensive presence of the basic isoelectric point and high frequency of serine residues (Arabidopsis:,11%, rice:,11%,Brachypodium
distachyon: ,11.5% and soybean: ,12%; Table S7) in IQDs suggest that the basic nature of IQDs is crucial to their biochemical functions [30,34]. The high isoelectric points are evocative of RNA-binding proteins although IQD proteins don’t comprise currently known RNA-binding motifs. Fifty-seven soybean IQD proteins are localized to the nucleus, because of their high content of basic residues revealed by Wolf PSORT. TargetP analysis revealed that fifteen soybean IQD proteins are located in the mitochondria by identifying the presence of mitochondrial targeting peptide (mTP). The contradicting
subcel-lular localization predictions is due to the different algorithm used by Wolf PSORT and TargetP. Most soybean IQD protein members are likely to function in the nucleus, as nucleus specific Ca2+-signatures are reported to generate in plant cells [55–57] and
calmodulin and related Ca2+sensor proteins may play a regulatory
role in nuclear processes such as transcription [58,59]. Observably,
Arabidopsis IQD1was reveraled to target to microtubules as well as the cell nucleus and nucleolus [32]. In vitro binding to single-stranded nucleic acids suggests AtIQD1 and other IQD family members may control and fine-tune gene expression and protein sorting by facilitating cellular RNA localization [32].
Phylogenetic analysis and evolution of IQD family genes IQD proteins are an ancient family of CaM/CML binding proteins that originated during the early evolution of land plants, as IQD genes are present in Physcomitrella patens. ESTs corresponding to IQD proteins for angiosperm species ( Arabidop-sis, rice, etc.) and at least nine homologous sequences in the gymnosperm pine (Pinus ssp.) corresponding to IQD proteins were identified suggesting that the IQD gene family originated not later than the split of gymnosperms and angiosperms about 300 Myr ago [30]. We performed a genome-wide comparison of plant IQD members from monocots (rice andBrachypodium distachyon) and eudicots (soybean,Arabidopsisand tomato) to explore how the IQD gene family has evolved. The plant IQD members from monocots (rice and Brachypodium distachyon) and eudicots (soybean, Arabidopsis and tomato) appear to be more closely
Figure 3. Chromosomal distribution and segmental duplication events for soybean IQD genes.The 67 IQD genes were mapped to the 20 soybean chromosomes. The duplicated paralogous pairs of IQD genes in the segmental duplicated blocks are indicated with small boxes of the same color and connected by dashed lines of the same color. Red triangles represent soybean IQD genes located on duplicated segments with the corresponding members lost. Black circles indicate soybean IQD genes not located in duplicated regions. Scale represents the length of the chromosome.
Group No. Paralogous pairs Ka Ks Ka/Ks Duplication date (MY) Duplicate type
Ia 1 GmIQD1-GmIQD24 0.0474 0.0802 0.5914 6.57 S
2 GmIQD16-GmIQD27 0.045 0.195 0.228 15.99 S
3 GmIQD22-GmIQD29 0.029 0.108 0.267 8.83 S
4 GmIQD49-GmIQD52 0.041 0.106 0.388 8.66 S
5 GmIQD15-GmIQD59 0.041 0.158 0.258 12.96 S
6 GmIQD31-GmIQD57 0.029 0.147 0.194 12.03 S
7 GmIQD37-GmIQD66 0.030 0.116 0.260 9.48 S
Ib 8 GmIQD4-GmIQD34 0.044 0.124 0.356 10.18 S
9 GmIQD38-GmIQD65 0.054 0.111 0.485 9.07 S
10 GmIQD8-GmIQD64 0.039 0.134 0.293 11.00 S
Ic 11 GmIQD23-GmIQD55 0.017 0.086 0.193 7.08 S
Id 12 GmIQD13-GmIQD19 0.057 0.164 0.346 13.47 S
IIa 13 GmIQD11-GmIQD39 0.043 0.093 0.460 7.60 O
14 GmIQD33-GmIQD40 0.022 0.094 0.238 7.70 S
IIb 15 GmIQD6-GmIQD26 0.022 0.091 0.245 7.49 S
IIIa 16 GmIQD10-GmIQD18 0.030 0.152 0.197 12.43 S
17 GmIQD50-GmIQD61 0.031 0.162 0.189 13.30 S
18 GmIQD21-GmIQD28 0.041 0.125 0.325 10.22 S
19 GmIQD48-GmIQD53 0.029 0.111 0.262 9.08 S
20 GmIQD25-GmIQD44 0.052 0.157 0.335 12.84 S
21 GmIQD45-GmIQD54 0.034 0.105 0.325 8.57 S
22 GmIQD42-GmIQD46 0.058 0.219 0.263 17.94 S
23 GmIQD41-GmIQD47 0.037 0.095 0.387 7.78 S
IIIb 24 GmIQD35-GmIQD43 0.033 0.114 0.293 9.34 S
25 GmIQD7-GmIQD63 0.024 0.093 0.253 7.61 S
26 GmIQD36-GmIQD67 0.045 0.127 0.349 10.43 S
IV 27 GmIQD12-GmIQD20 0.054 0.134 0.400 10.99 S
28 GmIQD14-GmIQD58 0.035 0.118 0.297 9.66 S
29 GmIQD2-GmIQD5 0.059 0.109 0.537 8.93 S
30 GmIQD30-GmIQD62 0.067 0.151 0.443 12.35 S
31 GmIQD9-GmIQD17 0.028 0.078 0.363 6.39 S
S: segmental duplication, O: other events. doi:10.1371/journal.pone.0110896.t004
IQD
Gene
Family
in
Soybean
ONE
|
www.ploson
e.org
13
October
2014
|
Volume
9
|
Issue
10
|
related to each other than to IQD genes of the same species in a different subfamily. This alternating distribution of monocots and eudicots in all subfamilies suggests that an ancestral set of IQD genes have existed before the dicot–monocot split (Figure 4, Table 4). The presence of five distinct subfamilies of IQD genes and the presence of both monocots and eudicots containing members in all five subfamilies indicate IQD genes have diversified before the monocot–eudicot split (Figure 4). These subfamilies include 23 pairs of orthologous genes, suggesting that orthologous genes may have originated from a common ancestor (Figure 4). About half of the orthologous genes (10 pairs;
BdIQD1/OsIQD8:N, BdIQD5/OsIQD3:N, BdIQD8/OsIQD1 0:C, BdIQD9/OsIQD23:C, BdIQD11/OsIQD19:N, BdIQD14/
OsIQD28:N,BdIQD17/OsIQD24:N BdIQD18/OsIQD7:N, BdI QD20/OsIQD2:N, SlSUN13/GmIQD60:N) have the same pre-dicted subcellular localization suggesting that the encoded proteins may play similar roles in both species [30,34]. A total of 87% (20 pairs) of orthologous gene pairs from rice and Brachypodium distachyon are distributed in all subfamilies. However, only two pairs of orthologous genes from dicotyledons (soybean and tomato) are from subfamily I and III. This difference may be due to the fact that both rice andBrachypodium distachyonare in the grass family and are therefore more closely related than Arabidopsis, soybean and tomato, which belong to Cruciferae, Solanaceae and Leguminosae, respectively. The number of soybean genes in each subfamily is greater than that of the other four species examined
Figure 4. Phylogenetic tree of full-length IQD proteins from soybean,Arabidopsis, rice, tomato andBrachypodium distachyon.The tree was generated with Clustal X2.0 using the NJ method. Dicotyledons (soybean, tomato andArabidopsis) IQD proteins are marked with colored dots. Monocotyledons (rice andBrachypodium distachyon) are marked with colored triangles. A moss IQD protein (Pp1s38230v6), used as the outgroup, is marked with a black box. Each IQD subfamily is indicated by a specific color.
suggesting that IQD counterparts in soybean may have undergone gene expansion.
The duplication of individual genes, chromosomal segments or entire genomes has been a major force in the evolution of plant genome structure and content during the process of genome evolution [60,61]. The soybean genome has undergone at least two round of duplication, resulting in the presence of significant features of remnants of a glycine-specific genome duplication that occurred ,13 Mya and fainter remnants of older polyploidies prior to the divergence of the papilionoids (58–60 Mya) that occurred ,58 Mya [41,51]. Thus, 75% of soybean genes are present in multiple copies [41]. Among 67 soybean IQD genes,
GmIQD3, -32, -56 and -60 were found as single copies on duplication blocks. These results suggest that segmental duplica-tion has occurred as a continuous process and dynamic changes may have occurred in a chromosomal segment that contained two ancestral IQD genes, leading to corresponding sister gene loss [62]. One paralogs (GmIQD11/-39) shares 91.2% identity and similar exon/intron organization, but exists outside of any duplicated blocks. this pair might have been produced by retrotransposition. A high proportion (approximately 96%) of soybean IQD genes reside preferentially in duplicated segments, suggesting that segmental duplications have played a prominent role in the expansion of the soybean IQD gene family. The duplicated IQD genes in soybean have been preferentially retained at the high rate of 92.5% (62/67), which is distinctly higher than the retention rate (67.3%) of duplicated paralogs in the 1.1-gigabase sequence of the soybean (cv. Williams 82) genome, in which 31,264 genes exist as 15,632 paralog pairs (out of the 46,430 predicted high-confidence genes that were duplicated and retained after the 13-Mya tetraploidy event) [63]. The higher retention rate corroborates previous findings that genes involved in signal transduction are preferentially retained following duplications[64]. Our calculation of the duplication dates of the 31 paralogous pairs revealed that all of the segmental duplication events in the soybean IQD family occurred during the recent whole genome duplication event.
During evolution, eukaryotic genomes have retained genes on corresponding chromosomes (synteny) and in corresponding orders (collinearity) to various degrees. Synteny broadly refers to parallels in gene arrangement in dissimilar genomes. Collinearity, a specific form of synteny, requires genes to occur in largely corresponding orders along the chromosomes of respective genomes. According to the microsynteny analysis, microsynteny relationships among AtIQD3, AtIQD4 or SlSUN13 with other IQD III members in these three dicot genomes were not observed indicating that either these genes are ancient genes without detectable linkage to other IQD genes or that they were formed through complete transposition and loss of their primogenitors. In addition, three different duplicated chromosomal segments (har-boring AtIQD5, GmIQD32 and GmIQD6) that lost their sister IQD genes lack detectable microsynteny relationships to all other IQD III genes in the soybean and Arabidopsis genome, respectively. In the four IQD III gene clades, genes from soybean, tomato andArabidopsisexhibit high levels of microsynteny, which indicates the IQD III genes existed before the divergence of the three dicotyledons genomes (soybean, tomato and Arabidopsis).
Microsynteny was detected in most pairs, and alignment in clade 1–3 was discordant, suggesting that these genes may all be present in genome regions that were inverted, expanded or contracted after the divergence. Notably, most gene pairs in clade 4 have successive collinearity in order and the same orientation, which indicates high conservation among these IQD III gene-residing regions, with little rearrangement. The low (18.41%) synteny quality of IQD III genes from the three dicotyledon genomes (soybean, tomato andArabidopsis) may have been due to the fact that these plants are not closely related; moreover, the gene density differs betweenArabidopsisand the two other species. Significant-ly, the number of synteny blocks (31) within the soybean genome is much more than the number (3 or 4) of synteny blocks between tomato orArabidopsisgenomes, which suggests that soybean IQD III genes may have undergone large-scale duplication events and less rearrangement was followed (Figure 5 and Table S5b). The gene expansion pattern analysis of soybean paralogs indicates that most pairs were generated from a large-scale duplication, which supports the results of soybean gene duplication analysis, with the exception ofGmIQD41/-47.
Organ- or tissue-specific expression of IQD genes and expression of GmIQD III genes under MeJA stress treatment
Organ- or tissue-specific expression patterns have been observed for quite a few members of the IQD family. However, the functions of soybean IQD genes remain unclear. We therefore performed a thorough analysis of the RNA-Seq Atlas to investigate organ- or tissue-specific expression of IQD genes and qRT-PCR to examine the expression of GmIQD III members under MeJA stress treatment.
The tissue expression data deficiency of eight soybean IQD genes potentially indicated that these are pseudogenes or express only at specific developmental stages or under special conditions. 65.7% soybean IQD genes constitutively express in all of the seven tissues suggesting that GmIQDs may play roles at multiple developmental stages. Eight GmIQD proteins peak in only one tissue indicating that these tissue-specific calmodulin target proteins may be limited to discrete cells or organs to regulate various cellular activities.
Except for group C comprised of genes from GmIQD I, group A, B and D comprise genes from four subfamilies indicating these soybean IQD genes exhibit similar transcript abundance profiles but are relatively phylogenetically distinct. The analysis indicated that only some members within the same phylogenetic subgroup share a similar expression profile in soybean organs/tissues during development, excluding GmIQD6 and GmIQD26 belong to GmIQD IIb. For instance,GmIQD4, -34, -38 and -65 belong to GmIQD Ib clustered in group with high expression in flowers suggesting their potential roles in flower formation. While the other two GmIQD Ib members (GmIQD8and -64) were detected in nodules indicating they may involve in fixing atmospheric nitrogen.
Members possessing similar sequences are clustered in the same subfamilies, which may have similar expression patterns or functions. In IQD subgroup Ia, Arabidopsis IQD22 is involved in the negative feedback regulation of GA-responsive DELLA
Figure 5. Microsynteny map of IQD III genes in soybean,Arabidopsisand tomato. a, b, candd:four groups of syntenic segments. The relative positions of all flanking protein-coding genes were defined by the anchored IQD III genes (red). Colored horizontal lines represent chromosome segments of soybean (green),Arabidopsis(yellow) and tomato (purple). Triangles of the same color represent individual genes and their transcriptional orientations. The total number of genes on each segment is indicated to the right below the segment. Colored lines connect the conserved gene pairs among the segments (anchor gene pairs, red; others, blue).
Figure 6. Hierarchical clustering of the expression profiles of soybean IQD genes in 14 tissues.RNA-seq relative expression data from 14 tissues were used to reconstruct the expression patterns of soybean genes. The raw data was normalized and retrieved from the online database http://soybase.org/soyseq/. The normal relative expression levels of 67 IQD genes are shown in Table S6. YL, young leaf; F, flower; P.1cm, one cm pod; PS.10d, pod shell 10 DAF; PS.14d, pod shell 14 DAF; S.10d, seed 10 DAF; S.14d, seed 14 DAF; S.21d, seed 21 DAF; S.25d, seed 25 DAF; S.28d, seed 28 DAF; S.35d, seed 35 DAF; S.42d, seed 42 DAF; R, root; N, nodule. Gene names in different subfamilies are highlighted with various colors. Genes clustered into four groups (A–D) are indicated by the black vertical bars.
genes [36]. Subgroup Ia members of Arabidopsis IQD26 has higher expression level in parts with divided vigorous growth and microtubule organization of leaves, root and flowers [65]. Eight of
the of the thirteen soybean IQD Ia members (GmIQD3, -16, -22, -27, -29, -31-37and -66) have high expression in young fleaves. And six of them (GmIQD15, -16, -27, -31-37and -66) have high
Figure 7. Expression patterns of 24 selected IQD III genes under MeJA stress using qRT-PCR.Relative expression levels of 24 IQD genes were examined by qRT-PCR and normalized to the expression ofCYP2. Bars represent standard deviations (SD) of three biological replicates. Y-axes indicate the scale of the relative expression levels. X-axes show time courses of MeJA stress treatments for each gene.aandb: data for genes from IIIa and IIIb, respectively.
expression in one-cm pod or pod-shell 10-DAF.GmIQD22have obviously higher expression at seed 21-DAF, the period of seed cell division (3, 4 weeks after flowering) [66]. These founding suggested that soybean IQD Ia members may function in transport of signaling molecules, nutrient transport and cell division.
Mapping and positional cloning of the SUN locus revealed that this member of the IQD II subfamily was generated by duplication of a 24.7-kb region carrying the tomatoIQD12gene, a major gene involved in the control of fruit shape, particularly length, in tomato [35].SUNis expressed the highest in hypocotyl and shoot apex. Overexpression of SUN causes root reduction when applied auxin and prostrate growth and twisted stems indicating thatSUNcan affect auxin transport or response [38].
SlSUN1shows slightly higher expression in the hypocotyl, flower at anthesis and fruit at 10 and 20 DPA [35]. SlSUN12 and
SlSUN21 highly are expressed in the hypocotyls and root respectively [35].SlSUN17evenly expressed in almost all tissues [35]. Soybean IQD II members showed the similar expression profile (GmIQD11: highest in flowers; GmIQD33, -39and -40: slight high in flowers and GmIQD6 and -26: highest in roots) indicating that GmIQD II members may play similar role in plant development.
Arabidopsis IQD1from the IQD III subfamily modulates the expression of several glucosinolate (GS) pathway genes, resulting in the alteration of glucosinolate content and composition to promote resistance to herbivory. Arabidopsis IQD1, the first functionally characterized IQD gene, is expressed in vascular tissues of hypocotyls, leaves, stems, flowers and roots, as revealed by histochemical analysis. Expression pattern analysis of soybean IQD genes revealed that genes from the soybean IQD III subfamily were mainly expressed in young leaves, flowers and roots (Figure 6). Jasmonic acid(JA) treatment leads to elevating levels of specific glucosinolate in Arabidopsis [67,68]. And overexpression ofAtIQD1causes the accumulation of glucosino-lates. However, AtIQD1 expression is independent of JA, as steady-stateAtIQD1mRNA expression levels are not appreciably altered when externally applied JA and are also unaffected in mutants defective in JA synthesis or signaling (JA -jar1andfad3-2 fad7-2 fad8) [31]. Indeed, AtIQD1 increases resistance against herbivory by augmenting and fine-tuning glucosinolate accumu-lation [31]. Glucosinolates with important roles in plant defense and human nutrition are a small but diverse class of defense related secondary metabolites in cruciferous species such as
Brassica crops and theArabidopsis thaliana [69,70]. Obviously, soybean doesn’t synthesize glucosinolates. Base on the micro-synteny analysis of IQDIII members, we auspiciously found there exsited highly conserved microsynteny relationship between
AtIQD1 and soybean IQDIII members. And combined with phylogenetic analysis of IQDIII members, we speculated soybean IQDIII members might have the similar biological function with
AtIQD1in defenses to insect herbivory.
Therefore, we performed qRT-PCR of 24 soybean IQD III with MeJA treatment to detect whether soybean IQD III genes defense to insect herbivory. Compared toAtIQD1, soybean IQD III genes exhibited different responses with the MeJA treatment. The qRT-PCR results showed that 23 of the 24 soybean IQD III subfamily genes were upregulated by MeJA treatment, except
GmIQD21, seven genes (GmIQD28, -41, -45, -48, -54, -60and
-67)were strongly induced by MeJA with relative expression more than 10-fold.GmIQD45even accumulated the highest transcripts approaching 70-fold at 12 h (Figure 7). Based on these, we speculate that IQD III genes in soybean may involve in defense to insect herbivory by JA pathway.
Orthologs may have equivalent functions, as they originated from a single ancestral gene in the last common ancestor of the species. Two pairs of orthologous genes (SlSUN22/AtIQD6and
SlSUN31/AtIQD5) were found between tomato andArabidopsis
(Figure S2). Similar expression patterns of these two pairs in tomato and Arabidopsis have been reported; SlSUN31 and
AtIQD5are almost ubiquitously expressed, whereasSlSUN22and
AtIQD6are highly expressed in young flower buds [30,34,35]. Duplicated genes may face three different fates: nonfunctiona-lization (one copy becomes silenced); neofunctionanonfunctiona-lization (one copy acquires a novel, beneficial function while the other copy retains the original function) or subfunctionalization (both copies become partially compromised by the accumulation of mutations) [45,71]. Paralogs originating from duplication within one organ-ism may have more divergent functions. In the current study, several pairs of paralogs showed similar expression patterns, which suggests that they may share a common or similar function. For example,GmIQD10/GmIQD18were highly expressed in young leaves, and their expression peaked at 4 h in response to MeJA (Figure 7). Several pairs of paralogs have different expression patterns, suggesting that they play diverse roles in soybean development. For example, GmIQD21/GmIQD28 are mainly expressed in young leaves. Upon MeJA treatment,GmIQD28was most highly expressed at 4 h while its sister geneGmIQD21was downregulated at all time points.
In conclusion, IQD proteins play fundamental roles in various plant developmental processes. Therefore, the systematic analysis of the soybean IQD gene family performed in the current study provides an important reference for further characterization of the biological functions of these proteins.
Materials and Methods
Identification of IQD family genes in soybean
To identify IQD proteins in soybean, theGlycine maxgenome database (release 1.0, http://www.phytozome.net/soybean.php) was searched using Basic Local Alignment Search Tool algorithms (BLASTP), with the publishedArabidopsisIQD protein sequences and their IQ67 domain used as initial query sequences. Redundant sequences were then removed manually, and the Hidden Markov Model of the Pfam (http://pfam.sanger.ac.uk/ search) [72] and SMART (http://smart.embl-heidelberg.de/) [73] databases were used to confirm each candidate sequence as a member of the IQD family [74]. A total of 33Arabidopsis, one moss (Physcomitrella patens) and 23 Brachypodium IQD protein sequences were downloaded from Phytozome v9.0 (http://www. phytozome.net/), and 34 tomato IQD protein sequences were retrieved from the tomato WGS chromosomes (2.40; SL2.40) (SGNhttp://solgenomics.net). Finally, 27 rice IQD protein sequences were obtained from the TAIR database (http://rice. plantbiology.msu.edu). Accession numbers of published IQD proteins for Arabidopsis, rice, tomato, Brachypodium and moss were listed in Table S8.