Prediction of Material removal rate for
Aluminum BIS-24345 Alloy
in wire-cut EDM
PUJARI SRINIVASA RAO*
Department of Mechanical Engineering, GITAM University, Visakhapatnam, Andhra Pradesh, India
pujari.vizag@gmail.com Dr. KOONA RAMJI
Department of Mechanical Engineering, Andhra University, Visakhapatnam, Andhra Pradesh, India
ramjidme@yahoo.co.in Prof. BEELA SATYANARAYANA
Vice-Chancellor, Andhra University, Visakhapatnam, Andhra Pradesh, India
snbeela@yahoo.com
Abstract :
In the present work, the parametric optimization method using Taguchi’s robust design is proposed for wire-cut electric discharge machining of Aluminum BIS-24345 alloy. In the recent past this material gained dominance, where high strength and/or hardness is required at elevated temperatures. So, experimentation has been done by using Taguchi’s L18 (21x37) orthogonal array. Each experiment was conducted under different conditions of pulse on time, pulse off time, peak current, flushing pressure of dielectric fluid, wire feed rate, wire tension, spark gap voltage and servo feed setting. The response of material removal rate is considered for improving the machining efficiency. Optimal combinations of parameters were obtained by this method. Mathematical and artificial neural network models has been developed relating the machining performance and process parameters. The study shows that the Taguchi’s method is suitable to solve the stated problem with minimum number of trails as compared with a full factorial design.
Keywords: Wire-cut EDM; Orthogonal array; Taguchi’s method; ANN; Regression analysis.
1. Introduction
for performance, quality and cost. The plan of experiments consists of acquiring data in a controlled way, executing these experiments and analyzing the data, in order to obtain information about the behavior of a given process. Two major tools used in Taguchi’s design are signal to noise ratio, which measures quality with emphasis on variation and orthogonal arrays (OA), which accommodates many design factors simultaneously. Orthogonality means that the factors can be evaluated independently of one another; the effect of one factor does not bother the estimation of another factor. The real power in using an OA is the ability to evaluate several factors in a minimum number of tests when compared to full factorial experiments. By applying this technique one can significantly reduce the time required for experimental investigation and can determine which factor has more influence and which has less. In order to improve the performance measures namely surface roughness, cutting speed, dimensional accuracy and material removal rate of the WEDM process several researches were attempted previously.[Aminollah Mohammadi et al. (2008)] optimized machining parameters for improvement of surface roughness in wire electrical discharge turning. [Ramakrishnan and Karunamoorthy (2008)] developed an artificial neural network model for optimization of inconel 718 on machining of CNC WEDM process. [Rao and Sarcar (2009)] evaluated the optimal parameters for machining brass with wire and studied the influence of these parameters on MRR and surface roughness. [Mahapatra and Patnaik (2007)] optimized the wire electrical discharge machining parameters. [Spedding and Wang (1997)] developed responsive surface methodology (RSM) and artificial neural network (ANN) models for the WEDM process. The ANN model is found to fit the data better and have a higher predictive capability of surface roughness value Ra and cutting speed. [Karthikkeyan, et al. (1999)] modeled EDM using a full factorial design while machining silicon carbide particulate composites. [Rozenek et al. (2001)] used a metal matrix composite as work piece material and investigated the variation of machining feed rate and surface roughness with machining parameters. [Tsai and Wang (2001)] adopted neural network models to predict the surface finish. [Qu et al. (2002)] derived a mathematical model for the material removal rate of cylindrical wire-cut EDM process. [Manna and Bhattacharya (2005)] developed a dual response approach for the hard SiC particles of Al/SiC-MMC which intermittently comes into contact to the hard surface during conventional machining act as small cutting edges like those of a grinding wheel on the cutting tool edge that, in due course, are worn out by abrasion.
The main objective of this paper is to study different parameters of the WEDM using Taguchi’s design methodology and standard matrix experiments L18 (21X37) orthogonal array to prepare the models for machining of Aluminum BIS-24345 alloy. In several references it is found that very few researches considered parameters like servo gap voltage and servo feed rate setting which also have significant effect on MRR. In this paper, in addition to the parameters like Pulse on time, Pulse off time, Peak current, Flushing pressure of dielectric fluid, Wire feed rate setting, Wire tension setting the above said parameters are also considered. The results obtained are analyzed for the selection of an optimal combination of WEDM parameters for the proper machining of Aluminum BIS-24345 alloy to achieve better material removal rate. Four different analyses were made on the data obtained from the experiments. Firstly, analysis of variance (ANOVA) is carried out to help one determine significant factors. Secondly, signal-to-noise (S/N) ratio analysis is conducted to find the optimal settings and factor levels. Thirdly, regression analysis establishes a relationship between factors and responses. Lastly, a feed-forward back propagation artificial neural network has been build to enhance the ability to predict the material removal rate.
2. Experimental Design
2.1 Experimental Set-Up and wire electrode
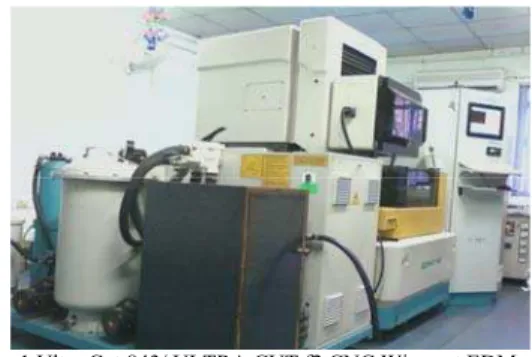
Fig: 1 Ultra Cut 843/ ULTRA CUT f2 CNC Wire-cut EDM machine
2.2 Data collection:
The cutting speed data (Vc, mm/min) is directly displayed on the computer monitor of the machine tool, Ultra Cut 843/ ULTRA CUT f2 for various settings of experimental machining operation. From this data Material removal rate is calculated as follows
MRR = Vc * b* h mm3/min Where :
Vc= Cutting speed in mm/min b = Width of cut in mm
h = Height of the work piece in mm
3.Taguchi Method:
3.1 Steps in Taguchi Methodology:
The major initial steps in designing, conducting and analyzing the experiment are Step (1): Selection of factors and/or interactions to be evaluated
Step (2): Selection of number of levels for the factors Step (3): Selection of the appropriate OA
VLN ≥ V required for factors and interactions VLN = N-1
(1) Where
VLN = The total degrees of freedom N = Total number of experiments V = Degrees of freedom available in OA
In this study, the total number of experiments is 18; hence total degree of freedom available as per Eq. (1) is 17.Whereas total degrees of freedom for factors and interactions available are 15. So the condition for the selection of appropriate OA is satisfied.
Step (4): Assignment of factors and/or interactions to columns Step (5): Conduct tests
Step (6): Analyze results
Step (7): Confirmation experiment
Table: 1 wire EDM parameters and their levels
Sl.No. Parameters Symbol Level 1 Level 2 Level 3 Units
1 Pulse On time TON 105 110 --- µ sec
2 Pulse Off time TOFF 53 58 62 µ sec
3 Peak Current IP 10 11 12 Ampere
4 Flushing pressure of dielectric fluid WP 5 7 11 Kg/cm2
5 Wire Feed rate setting WF 5 7 10 m/min
6 Wire tension setting WT 5 7 10 Kg-f
7 Spark gap Voltage Setting SV 8 15 22 Volts
8 Servo Feed Setting SF 500 1500 2100 mm/min
3.2 Analysis of Variance (ANOVA):
The purpose of ANOVA experimentation is to reduce and control the variation of a process; subsequently, deci-sions can be made concerning which parameters affect the performance of the process. ANOVA is the statistical method used to interpret experimental data to make the necessary decisions. Through ANOVA, the parameters can be categorized into significant and insignificant machining parameters. Table: 2 shows the ANOVA and F-test values with percentage of contribution (i.e. the effectiveness of the individual WEDM parameters) on the material removal rate during the machining of Aluminum BIS-24345 alloy.
Table: 2 ANOVA table for material removal rate
Source/Parameters
(Symbol) D.F SS V F %p
TON(A) 1 60065.78 60065.78 20.15593 11.57034
TOFF(B) 2 41502.87 20751.43 6.96344 7.994607
IP(C) 2 327655 163827.5 54.97465 63.11546
WP(D) 2 17056.92 8528.46 2.861847 3.285637
WF(E) 2 657.12 328.56 0.110253 0.12658
WT(F) 2 4311.09 2155.545 0.723324 0.830436
SV(G) 2 31172.07 15586.03 5.230117 6.004608
SF(H) 2 30754.89 15377.44 5.160121 5.924247
Error 2 5960.11 2980.055 1.148083
Total 17 519135.8
Where D.F = Degrees of Freedom; SS= Sums of square; V= Variance; F= Fisher value; %p = Percentage of contribution
3.3 Signal-to-Noise ratios (S/N ratio):
According to Taguchi method, the S/N ratio is the ratio of signal to noise where signal represents the desirable value (i.e., the mean for the output characteristics), and noise represents the undesirable value (i.e., the square deviation for the output characteristics). Therefore, the S/N ratio is the ratio of mean to square deviation. It is denoted by ‘η’ with a unit of dB. According to Quality Engineering, the characteristic that higher observed value represents better machining performance, as in case of MRR, is known as “higher is better”. Inversely, the characteristic that lower value represents better machining performance, such as surface roughness, is called ‘lower is better’. Therefore, for MRR ‘higher is better’ is selected for obtaining optimum machining performance characteristics. The S/N ratio can be calculated as a logarithmic transformation of the loss function as shown in Eq. (2). The S/N ratio values are calculated for the experiments conducted on the Aluminum BIS-24345 alloy, and the obtained values are tabulated in Table: 3.
S/N ratio for Material removal rate, ∑ (2)
3.4 Analysis of Data:
3.5 Confirmation Experiment:
The confirmation experiment is the final step in the Taguchi’s design of experiment (DOE) process. The purpose of the confirmation experiment is to validate the conclusions drawn during the analysis phase. The confirmation experiment is performed by conducting a test with specific combination of factors and levels previously evaluated. In this study, after determining the optimum levels, a new experiment is designed and conducted with optimum levels of the machining parameters. The final step is to predict and verify the improvement of the performance characteristics. The predicted S/N ratio using the optimal levels of the machining parameters can be calculated as in Eq. (3).
η η ∑ η η
(3)
where:
ηopt = Predicted optimal S/N ratio ηm = Total mean of the S/N ratios ηj = Mean S/N ratio at the optimal levels
k = Number of main design parameters that affect the quality characteristics
Confirmation test results proved that the determined optimal combination (A2B1C3D1E3F2G2H3 ) of machining parameter, with respect to the actual chosen initial setting (i.e., A2B2C2D2E2F2G2H2) improves the S/N ratio, satisfying the real requirement of wire-cut EDM operations for the proper machining of Aluminum BIS-24345 Alloy. The improvement in S/N ratio from the initial machining parameters to the level of optimal machining is 8.31238 dB. So, material removal rate is greatly improved by this approach. The confirmation experiment shows that, the used Taguchi’s method enhanced the machining performance and optimized the machining parameters.
Table: 3 Experimental design using L18 (21 X37
) orthogonal array
Sl.No TON TOFF IP WP WF WT SV SF MRR S/N ratio
1 105 53 10 5 5 5 8 500 110.4 40.85938
2 105 53 11 7 7 7 15 1500 452.7 53.11621
3 105 53 12 11 10 10 22 2100 603 55.60635
4 105 58 10 5 7 7 22 2100 252.6 48.04867
5 105 58 11 7 10 10 8 500 227.4 47.13581
6 105 58 12 11 5 5 15 1500 444.9 52.96525
7 105 62 10 7 5 10 15 2100 139.8 42.91014
8 105 62 11 11 7 5 22 500 150.3 43.53918
9 105 62 12 5 10 7 8 1500 393 51.88785
10 110 53 10 11 10 7 15 500 241.5 47.65834
11 110 53 11 5 5 10 22 1500 562.5 55.00245
12 110 53 12 7 7 5 8 2100 592.8 55.45816
13 110 58 10 7 10 5 22 1500 279 48.91208
14 110 58 11 11 5 7 8 2100 362.7 51.19095
15 110 58 12 5 7 10 15 500 599.4 55.55433
16 110 62 10 11 7 10 8 1500 156.6 43.89584
17 110 62 11 5 10 5 15 2100 491.7 53.834
18 110 62 12 7 5 7 22 500 527.7 54.44774
Table: 4 Mean S/N Ratios at each level for all the Parameters
Level TON TOFF IP WP WF WT SV SF
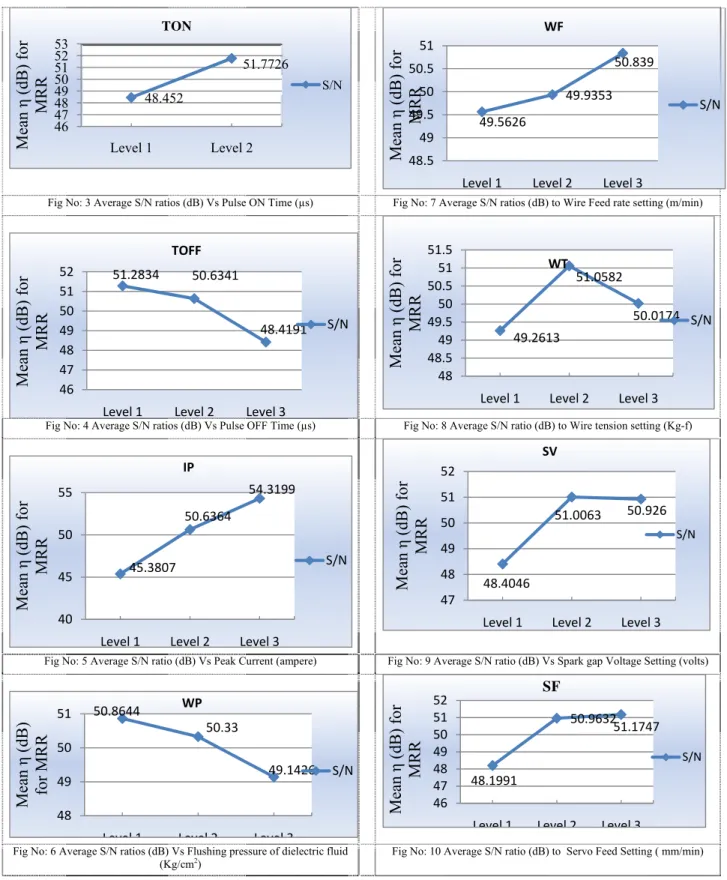
Fig No: 3 Average S/N ratios (dB) Vs Pulse ON Time (µs) Fig No: 7 Average S/N ratios (dB) to Wire Feed rate setting (m/min)
Fig No: 4 Average S/N ratios (dB) Vs Pulse OFF Time (µs) Fig No: 8 Average S/N ratio (dB) to Wire tension setting (Kg-f)
Fig No: 5 Average S/N ratio (dB) Vs Peak Current (ampere) Fig No: 9 Average S/N ratio (dB) Vs Spark gap Voltage Setting (volts)
Fig No: 6 Average S/N ratios (dB) Vs Flushing pressure of dielectric fluid (Kg/cm2
)
Fig No: 10 Average S/N ratio (dB) to Servo Feed Setting ( mm/min)
4. Mathematical Model for Machining Performance Criteria
Multiple linear regression models can often be an adequate representation of a more complicated structure, within certain ranges of the independent variables. Here, Eq. (4) represents the generalized model of multiple linear regression (MLR) analysis, which gives the relationship between response and independent
48.452 51.7726 46 47 48 49 50 51 52 53
Level 1 Level 2
Mean
η
(dB)
for
MRR
TON S/N 49.5626 49.9353 50.839 48.5 49 49.5 50 50.5 51Level 1 Level 2 Level 3
Mean
η
(dB) f
o
r
MR
R
WF S/N 51.2834 50.6341 48.4191 46 47 48 49 50 51 52Level 1 Level 2 Level 3
Mean
η
(dB) f
o
r
MRR
TOFF S/N 49.2613 51.0582 50.0174 48 48.5 49 49.5 50 50.5 51 51.5Level 1 Level 2 Level 3
Mean
η
(dB)
for
MRR
WT S/N 45.3807 50.6364 54.3199 40 45 50 55Level 1 Level 2 Level 3
M
ean
η
(dB)
for
MRR
IP S/N 48.4046 51.0063 50.926 47 48 49 50 51 52Level 1 Level 2 Level 3
Mean
η
(d
B) for
MRR
SV S/N 50.8644 50.33 49.1426 48 49 50 51Level 1 Level 2 Level 3
M
ean
η
(dB)
for MRR
WP S/N 48.1991 50.9632 51.1747 46 47 48 49 50 51 52Level 1 Level 2 Level 3
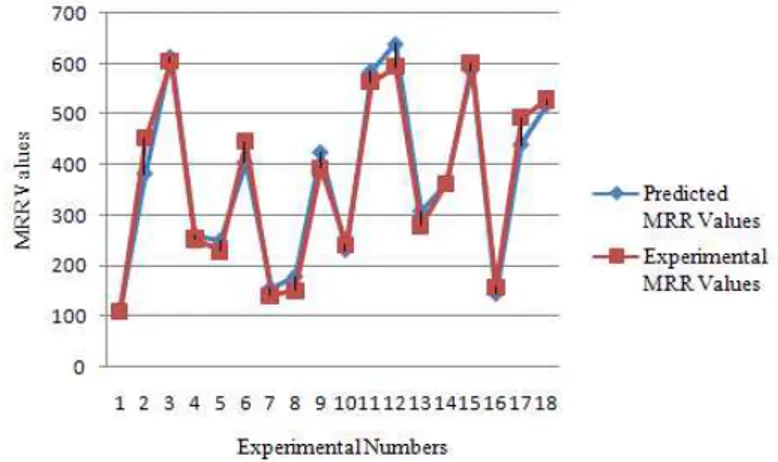
variables. The estimated response is obtained from the generalized simple regression equation as given in Eq. (5). In this study, material removal rate is considered as a response variable and all the eight parameters as independent variables as given in Eq. (6). Here, MRR is the performance output term and bi (i= 0, 1….…8) are the model constants. The constants were calculated by using linear regression analysis method with the help of MATLAB 7.7.0.471(2008b) software. The calculated coefficients from MATLAB7.7.0.471(2008b) software were substituted in Eq. (6) and the relations so obtained were given as in Eq. (7). Table: 5-6shows the values obtained in predicting the material removal rate and S/N ratio values using the developed mathematical model and the actual experimental results. Fig.11 show the good agreement of predicted values with experimental values. The above mathematical model for material removal rate in WEDM is of great importance for the selection of machining parameters during the machining of Aluminum BIS-24345 alloy.
nb b ∑ x b ∑ x … … … . . ∑ x ∑ y
b x b x b x x … … … b x x x y
: : : : : : : : : : : : b ∑ x b ∑ x x b ∑ x x … … … b ∑ x x ∑ x y
y b b x b x b x … … … … . … b x
(5)
So, the mathematical model suggested here is in the following form.
MRR b b TON b TOFF b IP b WP b WF b WT b SV
b SF
(6)
MRR . . TON . TOFF . IP . WP .
WF . WT . SV . SF
(7)
Fig. 11 Comparison of Experimental and predicted MRR values using Mathematical model.
5. Artificial Neural Network Modeling for WEDM
Neural networks are a highly flexible modeling tool with the ability to learn the mapping between the input and output. A neural network is a logical structure in which multiple processing elements communicate with each other through the interconnection between the processors. The knowledge is presented by the interconnection weight, which is adjusted during the learning stage. In this study, MATLAB
7.7.0.471(R2008b) version is used to create, train and test the ANNs. [Demuth and Beale (1998)] explained the usage of neural network tool box.
5.1 Training process:
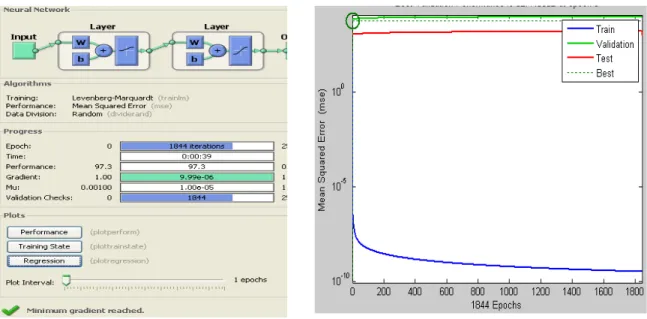
The Levenberg-Marquardt algorithm selected for training the ANN’s is a variation of the classic back propagation that, unlike other variations that use heuristics, relies on numerical optimization techniques to minimize and accelerate the required calculations, resulting in much faster training [Panda and Bhoi (2005)]. The experimental data given in Table: 3 are used for training the network, the machining data available for Aluminum BIS-24345 alloy (which is not included in the training data) is used for validation. The machining data at initial conditions and optimal conditions are used for testing the ANN. The performance assessment of each ANN was measured with the mean squared error (MSE) of the testing subset. It must be noted that because of the fact that the outcome of the training greatly depends on the initialization of weights, this is done randomly. Gradient descent with momentum weight and bias learning function is used to minimize the mean square between the actual output pattern of the network and the desired pattern. The transfer function used in this work is log-sigmoid on hidden layer and tan-sigmoid on output layer.
5.2 Determination of the best model:
Fig. 12 Neural network training window
Fig.13 Performance plot of MSE Vs No.of Epochs Table: 5 Comparisons of experimental Material removal rate data with
Mathematical and ANN model
Sl.No. Experimental Mathematical
model ANN model 1
Material removal rate Value obtained at Initial
conditions
458.168 432.2921 446.9937
2
Material removal rate Value obtained at Optimum conditions
714.999 738.8621 694.1746
3 Improve of Material
removal rate obtained 1.560 times 1.709 times 1.553 times
Table: 6 Comparison of Signal to Noise ratio (dB) values
Sl.No. Experimental Mathematical
model
ANN model 1 S/N ratio obtained at
Initial conditions 53.220 52.715 53.006
2 S/N ratio obtained at
Optimum conditions 57.086
57.371
56.830
3 Improve of S/N ratio
obtained 3.866 4.656 3.824
7. Results and Discussion
The energy content of a single spark discharge can be expressed as a product of TON x IP. Energy contained in a tiny spark discharge removes a fraction of workpiece material. Large number of such time spaced tiny discharges between the workpiece and wire electrode causes the electro erosion of the workpiece material. The experimental results obtained in machining the Aluminum BIS-24345 alloy also proved that, the parameters IP is most significant and TON, TOFF, SV and SF are significant.
From the signal to noise ratio, optimal combination of parameters was obtained as A2B1C3D1E3F2G2H3. A separate experiment was conducted at this optimal combination and an improved material removal rate value of 714.999 mm3/min was obtained, when compared to 458.168 mm3/min at initial machining parameters i.e. A2B2C2D2E2F2G2H2. This improved material removal rate value is 1.560 times the initial material removal rate (i.e. 35.92%). The S/N ratio is also improved by 3.866 dB; this is an indication of improvement in the machining performance i.e. material removal rate.
It can be seen that MRR tends to increase significantly with increase in peak current and pulse on time due to their dominant control over the input energy. The maximum MRR is obtained at high peak current (12 A) and high TON (110 µ sec). It can be noted that the MRR increases with decrease in TOFF, this is because when TOFF increases, there will be an undesirable heat loss which does not contribute to MRR. This will lead to drop in the temperature of the workpiece before the next spark starts and therefore MRR decreases. The maximum MRR is achieved at minimum TOFF ( 53 µ sec).
Fluctuation of average gap voltage within ± 10% of set value can be considered as a stable machining. If the gap voltage is too low, i.e narrower discharge gap between the wire and workpiece in the direction of motion results in larger voltage fluctuations. This in turn causes frequent wire breakage. If the gap voltage is high, on the other hand machining speed decreases which will in turn increases the overcut. The optimum gap voltage obtained in this case is 15 volts. Servo feed setting (SF) can be adjusted to get the optimum speed with stable gap voltage. A mathematical model using multiple linear regression analysis was made to validate the experimental work. The material removal rate value at optimum conditions predicted by mathematical model is 738.8621 mm3/min which is 3.34% error when compared to experimental value (714.999 mm3/min) at the same conditions. Similarly, the Material removal rate value at initial conditions predicted by mathematical model is 432.2921 mm3/min which is 5.64% error when compared to experimental value 458.168 mm3/min at the same conditions. For the validation of the experimental results, in addition to the mathematical model, an artificial neural network model with feed-forward back-propagation was adopted to enhance the prediction ability of Material removal rate. The Material removal rate value at optimum conditions predicted by ANN model is 694.1746 mm3/min which is 2.91% error when compared to experimental value (714.999 mm3/min ) at the same conditions. Similarly, the Material removal rate at initial conditions predicted by ANN model is 446.9937 mm3/min which is 2.43% error when compared to experimental value (458.168 mm3/min) at the same conditions. A good agreement of results was obtained with mathematical model and ANN model when compared to the experimental work.
8. Conclusion
The effects of Pulse On time, Pulse Off time, Peak Current, Flushing pressure of dielectric fluid, Wire Feed rate setting, Wire tension setting, Spark gap Voltage Setting and Servo Feed Setting are experimentally investigated in machining of Aluminum BIS-24345 alloy using CNC Wire-cut EDM process. The level of importance of the machining parameters on the material removal rate is determined by using ANOVA and it is shown that IP is most significant and TON, TOFF, SV and SF are significant. An optimum parametric combination for the maximum material removal rate was obtained by using Signal-to-Noise (S/N) ratio. Improved S/N ratio and conformation test indicated that it is possible to increase material removal rate by using the proposed statistical technique. The developed mathematical model for the performance characteristic i.e. Material removal rate in the CNC Wire-cut EDM process is successfully proposed for the proper selection of the machining parameters. A feed-forward back propagation neural network model is developed to predict the material removal rate. During the training process several neural network configurations were studied and it has been found that one hidden layer with 8 neurons provides a better prediction. Hence a neural network of the type 8-8-1 was adapted to model the process and the proposed model enhanced the prediction ability.
References
[2] Aminollah Mohammadi, et al. A new approach to surface roughness and roundness improvement in wire electrical discharge turning based on statistical, Int J Adv Manuf Technol analysis Vol. 39, pp. 64–73, 2008.
[3] C.V.S. Parameshwara Rao and M.M.M. Sarcar. Evaluation of optimal parameters for machining brass with wire cut EDM, Journal of scientific & Industrial research, Vol. 68, pp. 32-35, 2009.
[4] D.K. Panda and R.K. Bhoi. Artificial neural network prediction of material removal rate in electro discharge machining , Materials and Manufacturing Processes 20, pp. 645-672, 2005.
[5] H. Demuth and M. Beale. Neural network toolbox: User’s Guide, version 3.0, The MathWorks, Inc., Natick, MA ,1998. [6] J. Qu, AJ. Shih and RO. Scattergood. Development of the cylindrical wire electrical discharge machining process, part 1: concept,
design and material removal rate, J Manuf Sci Eng 124: pp. 702-707, 2002.
[7] K.M. Tsai, and P.J. Wang. Predictions on surface finish in electrical discharge machining based upon neural network models, Int J Mach Tools Manuf 41: pp. 1385-1403, 2001.
[8] L. Fausett. Fundamentals of neural networks: architecture, algorithms and applications, Prentice-Hall, New York , 1994.
[9] M. Rozenek, J. Kozak, L. Dabro Vwki and K. Lubko Vwki. Electrical discharge machining characteristics of metal matrix composites, J. Mater. Process. Technol. 109: pp. 367-370, 2001.
[10] Phillip J. Ross. Taguchi techniques for quality engineering, McGraw-Hill Book company, New York.
[11] R. Karthikkeyan, et al. Mathematical modeling for electric discharge machining of aluminum- silico carbide particulate composites, J Mater Process Technol 87: pp. 59-63, 1999.
[12] R. Ramakrishnan and L. Karunamoorthy. Modeling and multi-response optimization of inconel 718 on machining of CNC WEDM process, Journal of Materials Processing Technology, Vol. 207, pp. 343–349, 2008.
[13] S.S. Mahapatra and Amar Patnaik. Optimization of wire electrical discharge machining (WEDM) process parameters using Taguchi method, Int J Adv Manuf Technol 34, pp. 911-925, 2007.
[14] T.A.Spedding and Z.Q. Wang. Parametric optimization and surface characterization of wire electrical discharge machining process.