CLARICE APARECIDA MEGGUER
ENZYMATIC ACTIVITIES OF THE GLYCOLYTIC PATHWAY AND
GLYCOLYTIC FLUX IN SUGAR BEET ROOTS
VIÇOSA
MINAS GERAIS – BRASIL 2010
Tese apresentada à Universidade
Federal de Viçosa, como parte das
exigências do Programa de
Pós-Graduação em Fisiologia Vegetal,
para obtenção do título de
Doctor Scientiae.
ACKNOWLEDGMENTS
To God, for protection and constant presence in my life, for giving me support to finish this study.
For my family’s support, recognition and understanding of the many moments of absence.
Viçosa Federal University, in particular the Plant Biology Department, for the opportunity to develop the Plant Physiology course.
Professor Fernando Luiz Finger, who, always encouraged me to grow professionally and scientifically. And for his friendship.
Karen Klotz Fugate, NCSL – USDA researcher, for her valuable teaching, understanding and companionship.
Co-advisers, professors Raimundo Santos Barros and José Geraldo Barbosa for their friendship, teaching and confidence.
The “brothers,” Ana Maria, Ana Paula, Angela, Camila, Caroline, Cleiton, Daniel, Eber, Eulene, Fernanda, Fernando, Giovanni, Hermes, Jocleita, Luciana, Larissa, Marialva, Ray, Roseli and Teresa, wonderful people, who, made my path easier just by crossing my life and their acceptance as part of my tree of friends.
Karen, William and Ellen for friendship, receptivity, companionship and for making me feel at home.
To lab friends and Geraldo, Sebastião, John Eide, Abbas Lafta and Joe for support and good tips that made my study better.
BIOGRAPHY
CLARICE APARECIDA MEGGUER, daughter of Maria Dudar Megguer and Antonio Pascoal Megguer, was born on June 19th, 1975, in Almirante Tamandaré, Paraná, Brazil.
In 1997, she entered Santa Catarina State University, graduating in agronomy engineering on July 2002.
In 2006, she got her Master’s degree in Plant Science from Santa Catarina State University.
CONTENTS
RESUMO...VIII
ABSTRACT ...X
GENERAL INTRODUCTION... 1
LITERATURE ... 6
CHAPTER 1 ... 9
GLYCOLYTIC ENZYME ACTIVITY IN ROOTS OF SUGARBEET ... 9
ABSTRACT ... 9
1. INTRODUCTION... 11
2. MATERIAL AND METHODS... 17
2.1. Plant material and postharvest treatments ... 17
2.2. Respiration rate determination ... 17
2.3. Protein extraction and quantification ... 17
2.4. Enzyme activity assays ... 18
2.5. Statistical analysis ... 19
3. RESULTS AND DISCUSSION... 20
3.1. Storage period effects on root respiration rate... 20
3.2. Enzymatic activity... 21
3.3. Principal component analysis (PCA)... 30
CONCLUSIONS ... 33
LITERATURE ... 34
CHAPTER 2 ... 38
GLYCOLYTIC FLUX IN ROOTS OF SUGARBEET ... 38
ABSTRACT ... 38
1. INTRODUCTION... 40
2. MATERIAL AND METHODS... 42
2.1. Plant material and postharvest treatments... 42
2.2. Respiration rate determination ... 42
2.3. Labelling experiments ... 42
2.3.1. Tissue labelling... 43
2.3.2. Tissue extraction ... 43
2.3.3. Analysis of ethanol-soluble components... 44
2.3.3.1. Neutral fraction ... 44
2.3.3.2. Phosphoester fraction ... 44
2.3.3.3. Acidic fraction ... 45
2.3.4. Analysis of ethanol-insoluble components ... 45
2.4. HPLC analysis of sucrose, glucose and fructose... 45
2.5.1. Sample preparation ... 46
2.5.2. TLC separation... 47
2.6. Quantification of radioactivity ... 49
2.7. Statistical analysis ... 49
3. RESULTS AND DISCUSSION... 50
3.1. Preliminary test... 50
3.2. Experiment 1: Effects of incubation time and protein synthesis inhibition ... 50
3.3. Experiment 2: Effect of incubation temperature ... 53
CONCLUSIONS ... 58
LITERATURE ... 60
APPENDIX ... 62
Appendix 1: ENZYME ASSAYS ... 63
Appendix 2: CHEMICALS USED FOR ENZYME ASSAYS AND MOLECULAR WEIGHT . 67 Appendix 3: ENZYMES USED AND RESPECTIVES UNIT ... 68
Appendix 4: Scott-Knott statistical analysis of glycolytic enzymes storage UP TO 100 days. ... 69
Appendix 5: WEIGHTING FACTORS USED TO CALCULATE EIGENVECTORS FOR THE PRINCIPAL COMPONENT ANALYSIS OF THE ENZYMATIC ACTIVITY IN THE POSTHARVEST OF SUGARBEET ROOTS. ... 70
RESUMO
MEGGUER, Clarice Aparecida, D.Sc. Universidade Federal de Viçosa, março de 2010, Atividade enzimática da via glicolítica e fluxo glicolítico em raízes de beterraba açucareira. Orientador: Fernando Luiz Finger. Coorientadores: Raimundo Santos Barros e José Geraldo Barbosa.
análise canônica (PCA) identificou quatro grupos de enzimas que compartilham similaridades na maneira em que suas atividades mudam similarmente durante o armazenamento. No experimento para determinar o fluxo de carbono observou-se que a maioria do material radioativo incorporado pelas raízes permaneceu como sacarose e não foi metabolizado. A concentração de glucose e fructose foi maior para discos de raízes incubados a 4oC do que aqueles incubados a 10 or 20oC. O aumento da temperatura de incubação promoveu mudanças na quantidade relativa de material radioativo na glicose, frutose e fração fosfoester, sugerindo que a elevação da temperatura favorece o fluxo glicolítico.
ABSTRACT
MEGGUER, Clarice Aparecida, D.Sc. Universidade Federal de Viçosa, March, 2010, Enzymatic activities of the glycolytic pathway and glycolytic flux in sugar beet roots. Adviser: Fernando Luiz Finger. Co-advisers: Raimundo Santos Barros and José Geraldo Barbosa.
GENERAL INTRODUCTION
Sugarbeet (Beta vulgaris L.) is produced throughout the world, especially in the USA, Russia, the European Union and Ukraine. Europe is the major producer sugar of sugarbeet and responsible for 75% of total beet sugar produced. The USA and Asia make up 19% of world production; South America and Africa account for the remainder (Draycott, 2006).
In 2007, the USA produced about 32 million tons of sugarbeet in 504 mil hectares (FAOSTAT, 2007). Production for the 2009/2101 crop has yet to be quantified, but the National Agricultural Statistics Service (NASS) forecasts that for 2009/10, sugarbeet will be harvested from 470 mil hectares, a 15.3 percent increase over that of 2008/09, and 31 million tons of sugarbeet will be produced. In contrast, in the USA sugar cane production is estimated at approximately 303 mil hectares and 4 million tons (Haley & Dohlman, 2009). These numbers demonstrate the importance of sugarbeet for sugar production in the USA.
In the USA, sugarbeet is cultivated in different regions including the Upper Midwest (Minnesota and North Dakota), the Far West (California, Idaho, Oregon, and Washington State), the Great Plains (Colorado, Nebraska, Montana, and Wyoming) and the Great Lakes (Michigan) (Harveson et al., 2009). The sugarbeet crop can be grown commercially in a wide variety of temperate climates, but is mostly grown at latitudes between 30 and 60oN (Draycott, 2006). In recent years, the development of tropical sugarbeet varieties has created an interest in cultivation in regions of tropical climates (Joshi et al., 2005).
root yield and sucrose content are directly dependent on the production region (Went, 1954).
After harvest, sugarbeet roots are typically stored in large outdoor piles. Postharvest storage conditions and practices, however, vary substantially between production regions. In Mediterranean regions, including Southern Europe and North Africa, and in California, roots are processed shortly after harvest, usually within a few days, with harvest extending over two to five months to provide a constant supply of roots to processing factories. In Western Europe, sugarbeet roots are harvested until the first frost and roots are stored on-farm in piles called clamps for 3-6 weeks. In regions with short growing seasons and cold winters, e.g. those in the Northern USA, and parts of Russia, harvesting is delayed until just before the first frost, and roots are stored for up to 200 days prior to processing (Tungland et al., 1998). In the USA, roots are delivered to central piling stations where they are stored in piles 6-10 m high and 55-70 m wide and 400 m long. The piles are cooled by ambient winter air by natural or forced air ventilation. In these regions, roots may be stored up to 120 days prior to freezing or processing.
A major challenge for the sugarbeet industry is to preserve the sugar accumulated during postharvest storage. Sugarbeet roots lose, on average, 0.1% of their sucrose content per day in storage at 3oC, although losses can reach 1.8% of their sugar content per day at temperatures higher than 30oC (Wyse & Dexter, 1971). Given the duration of storage, it is common for 10 to 15% of the sucrose present at harvest to be lost during storage. Sucrose loss in storage is due to respiration, disease and conversion of sucrose to other carbohydrates including glucose, fructose, and raffinose. Respiration, however, is the principal cause of sucrose loss with estimates that 60 to 80% of the sucrose lost during storage is due to this process (Wyse & Dexter, 1971).
principal substrate (Barbour & Wang, 1961) and generates the energy and substrates needed to maintain healthy tissue, heal wounds incurred during harvest and piling, and defend against pathogens (Wyse & Dexter, 1971; Wyse, 1973). Respiration, therefore, is essential for biological process, but economically detrimental, and limiting its impact on sucrose loss is a major goal for the sugarbeet industry.
Respiration involves a complex series of reactions and involves sucrolysis, glycolysis, the citric acid cycle (TCA), and electron transfer/oxidative phosphorylation (Campbell & Klotz, 2006). In sugarbeet root, respiration begins with cleavage of sucrose by sucrolytic enzymes which cleave sucrose to hexose sugars. Glycolytic enzymes degrade the hexose sugars to the three carbon organic acid, pyruvate and with a concomitant release of energy. Pyruvate enters the TCA cycle which degrades the pyruvate to carbon dioxide and generates NADH and FADH2 which are substrates for the electron transfer chain (Klotz et al., 2006; Salveit, 2004).
While the environmental factors that affect sugarbeet root respiration rate are known, the internal factors regulating root respiration rate are unknown. In plants, respiration rate is regulated by substrate availability, total respiratory activity, or energy status of the cell (Klotz et al., 2008; Shugaev & Bukhov, 1997). In sugarbeet root, the mechanism by which respiration rate is controlled has not been established. Studies, however, have demonstrated that root respiration rate is not associated with total respiratory activity or energy status of the cell. The lack of association between root respiration rate and total respiratory activity and cellular energy status suggests that respiration is regulated by the availability of respiratory substrates (Klotz et al., 2008).
Understanding the processes involved in the generation of substrates for respiration is, therefore, extremely important to understanding postharvest sucrose loss in sugar beet roots. The metabolic reactions involved in sucrose catabolism are well known. Sucrose is cleaved by one of three sucrolytic enzymes – sucrose synthase, acid invertase or alkaline invertase – and the products of these enzyme activities are catabolized by glycolysis to provide substrates for the TCA cycle, which provides substrates for the electron tranfer chain (Siedow & Day, 2000; Klotz & Finger, 2004). While sucrolytic enzymes have been studied in considerable detail, few studies have examined the activity of glycolytic enzymes and the flux of carbon substrates through this pathway. The paucity of studies dealing with the glycolytic pathway is surprising considering its central role in plant metabolism and its ability to limit respiration and anabolic pathways by restricting the availability of substrates for these processes.
LITERATURE
Barbour, R.D.; Wang, C.H. (1961). Carbohydrate metabolism of sugarbeets. I. Respiratory catabolism of mono and disaccharides. Journal of the American Society of Sugarbeet Technologists, 11: 436-442.
Campbell, L.G.; Klotz, K.L. (2006). Storage. In: Draycott, A.P.(ed). Sugarbeet. Blackwell Publising Ltd, Garsington Road, Oxford. p.387-408.
Draycott, A.P. (2006). Introduction. In: Draycott, A.P.(ed). Sugarbeet. Blackwell Publising Ltd, Garsington Road, Oxford. p.1-8.
FAO.(2007). FAOSTAT, Production – core production data. Web address:
http://faostat.fao.org/site/567/DesktopDefault.aspx?PageID=567#ancor. Access
in November 27, 2009.
Fugate, K.; Campbell, L. (2009). Postharvest Deterioration of Sugarbeet. In:
Compendium of the Beet Diseases and Insects, ed. by R.M. Harveson, L.E. Hanson, and G. O. Hein, APS Press. St. Paul, MN pp.140.
Haley, S.; Dohlman, E. (2009). Sugar and sweeteners outlook. USDA, A report from economic research service, SSS-256. Web address:
http://usda.mannlib.cornell.edu/usda/ers/SSS//2000s/2009/SSS-10-05-2009.pdf.
Access in December 10, 2009.
Harveson, R.M.; Panella, L.; Lewellen, R.T. (2009). Introduction. In:
Compendium of the Beet Diseases and Insects, ed. by R.M. Harveson, L.E. Hanson, and G. O. Hein, APS Press. St. Paul, MN pp.140.
Jaggard, K. W.; Qi, A. (2006). Agronomy. In: Draycott, A.P.(ed). Sugarbeet. Blackwell Publising Ltd, Garsington Road, Oxford. p. 134-168.
Joshi, S.S.; Pawar, M.W.; Datir, S.S.; More, D.B. (2005). Physiologycal studies and sucrose metabolism during root development in three sugarbeet cultivars.
Sugar Technology, 7: 150-153.
Klotz, K.; Finger, F.L.; Anderson, M.D. (2006). Wounding increases glycolytic but not soluble sucrolytic activities in stored sugarbeet root. Postharvest Biology and Technology, 41: 48-55.
Klotz, K.; Finger, F.L.; Anderson, M.D. (2008). Respiration in postharvest sugarbeet roots is not limited by respiratory capacity or adenylates. Journal of Plant Physiology, 165: 1500-1510.
Lewellen, R.T., Panella, L.W., Harveson, R. (2009). Botany of the Beet Plant. In:
Compendium of the Beet Diseases and Insects, ed.by R.M. Harveson, L.E. Hanson, and G. O. Hein, APS Press. St. Paul, MN pp.140.
Milford, G.F.J. (2006). Plant Structure and Crop Physiology. In: Draycott, A.O. (ed). Sugarbeet. Blackwell Publising Ltd, Garsington Road, Oxford. p.30-49. Moorhead, G.B.G., Plaxton, W.G. (1988). Binding of glycolytic enzymes to a particulate fraction in carrot and sugarbeet storage roots. Plant Physiology. 86: 348-351.
Munford, D.L.; Wyse, R.E. (1976). Effect of fungus infection on respiration and reducing sugar accumulation of sugarbeet roots and use of fungicides to reduce infection. Journal of American Society of Sugar Beet Technologists, 19: 157-162.
Sakalo, V., & Tyltu, A. (1997). Enzymes of carbohydrate metabolism in sugarbeet roots in the course of short-term storage under unfavorable conditions. Russian Journal of Plant Physiology, 44: 70-76.
Salveit, M.E. (2004). Respiratory metabolism. In: Gross, K.C.; Wang, C.Y.; Salveit, M.E. The commercial storage of fruits, vegetables, and florist and nursery stocks. USDA, ARS: Agricultural Handbook (66), 130p.
Siedow, J.D.; Day, D.A. (2000). Respiration and photorespiration. In: Buchanan, B.; Gruissem, W.; Jones, R. Biochemistry and Molecular Biology of Plants. American Society of Plant Physiologists, Rockville, M.D. p.676-728.
Shugaev, A.G.; Bukhov, N.G. (1997). Opposite trends of seasonal changes in ADP content and respiration rate in sugar beet roots. Journal of Plant
Tungland, B.C.; Watkins, R. E.; Schmidt, P.V. (1998). Sugarbeet storage. In: van der Poel, P.W.; Schiweck, H.; Schwartz, T. (eds). Sugar Technology: beet and cane sugar manufacture. Verlag Dr. Albert Bartens KG, Berlin, Germany, p.267-289.
Went, F.W. (1954). The physiology of the growth of sugarbeets. Proceedings: The American Society of Sugar Beet Technologists, 8: 319-324.
Wiltshire, J.J.J.; Cobb, A.H. (2000). Bruising of sugarbeet roots and
consequential sugar loss: current understanding and research needs. Annals of Applied Biology, 136: 159-166.
Wyse, R.E.; Dexter, S.T. (1971).Source of recoverable sugar losses in several sugarbeet varieties during storage. Journal of the American Society of Sugarbeet Technologists, 16: 390-398.
Wyse, R.E. (1973). General postharvest physiology of the sugarbeet. In: Postharvest losses of sucrose in sugarbeets. Proceedings of the Beet Sugar Development Foundantion Conference. Monterey, CA. p.47-60.
Wyse, R.E. (1978) Effect of low and fluctuating temperatures on the storage life of sugarbeets. Journal of the American Society of Sugarbeet Technologists, 20: 33-42.
CHAPTER 1
GLYCOLYTIC ENZYME ACTIVITY IN ROOTS OF SUGARBEET
ABSTRACT
Glycolysis is ubiquituous in nearly all organisms and serves as the primary pathway for carbohydrate catabolism. The oxidative pentose phosphate pathway (OPPP) provides an alternative pathway for carbohydrate catabolism. Glycolysis and the OPPP operate somewhat independently in plant cells, but interact through common intermediates. In most plants and plant organs, however, and in sugarbeet root in particular, glycolysis, is the predominant pathway for hexose catabolism. Control of glycolysis in plants is not well understood. Little is known about the activities of glycolytic enzymes or the regulation of glycolysis in sugarbeet root. The present study determined the activity of glycolytic enzymes in sugarbeet roots throughout 100 days of storage. The purpose of this work was to provide basic information for understanding the activities of the enzymes involved in glycolysis, their relative activities, and the effect of storage on them. Sugarbeet hybrid VDH66156 was greenhouse grown for 16 weeks, when roots were harvested, gently hand washed, and kept at 10oC and 90 ± 5% relative humidity for 10 days, then incubated at 4oC, 90 ± 5% relative humidity for up to 100 days. Respiration rate of individual roots was determined at 10oC after 0, 1, 2, 3, 4, 7, 10, 30, 60 and 100 days of storage, then tissue samples were flash frozen in liquid nitrogen, lyophilized, ground to a fine powder, and stored at −80oC until analysis of enzymatic activity. Respiration rate was nearly 23 mg CO2 kg-1 h-1 after harvest, but declined 65% after one day
of storage. A second decline of 55%, occurred during the first week in storage to a rate of 3.6 mg CO2 kg-1 h-1, after which respiration rate was practically. The
1.INTRODUCTION
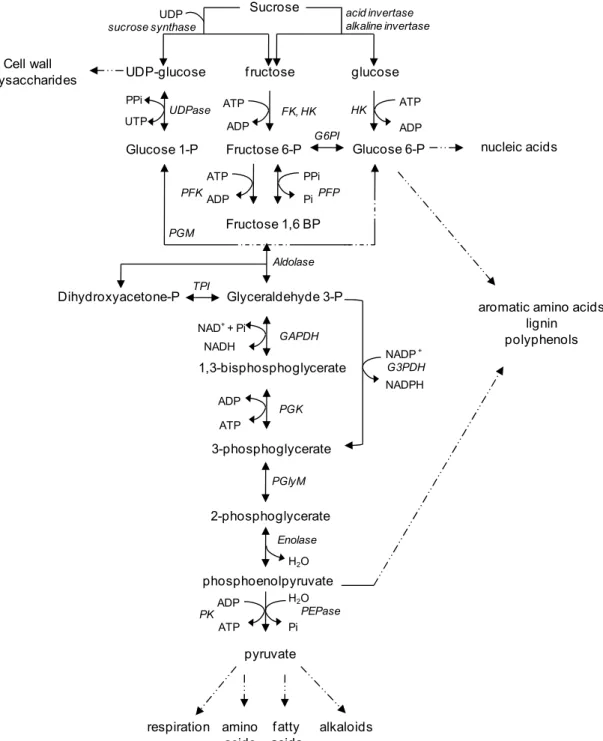
Glycolysis is the metabolic pathway that converts hexose sugars to pyruvate, releasing energy and generating substrates for the tricarboxylic acid cyle, respiration and the biosynthesis of biological compounds including amino acids, fatty acids, nucleic acids, phenolic compounds, and alkaloids. Overall, glycolysis catalyzes the following reaction:
glucose + 2 ADP + 2 Pi + 2 NAD+
→
2 pyruvate + 2 ATP + 2 NADH + 2 H+Glycolysis is ubiquituous in nearly all organisms and serves as the primary pathway for carbohydrate catabolism. The oxidative pentose phosphate pathway (OPPP) provides an alternative pathway for carbohydrate catabolism. Glycolysis and the OPPP operate somewhat independently in plant cells, but interact through the common intermediates, glucose phosphate, fructose 6-phosphate, and glyceraldehyde 3-phosphate (Bowsher et al., 2008). In most plants and plant organs, however, and in sugarbeet root in particular, glycolysis, is the predominant pathway for hexose catabolism (ap Rees, 1980; Wang & Barbour, 1961).
Fourteen enzymes catalyze the 10 chemical reactions of glycolysis with 9 distinct intermediates (Table 1, Fig. 1). In plants, the number of participating enzymes is greater than the number of reactions since glycolysis can utilize two substrates, glucose and fructose, and three of the pathway’s reactions are catalyzed by two enzymes. Glycolysis requires 5 cofactors, ATP, ADP, NAD+, phosphate, and pyrophosphate. The pathway consumes energy in the form of ATP in its initial two steps, and produces 4 ATP in later reactions for an overall net energy yield of two ATP and two NADH molecules per hexose oxidized (Nelson & Cox, 2008).
5’-diphosphate (UDP) with sucrose, generating fructose and UDP-glucose. The fructose formed in this reaction can readily be used as a substrate for glycolysis. UDP-glucose can also be utilized as a glycolytic substrate after its conversion to glucose 6-phosphate by the combined activities of UDP-glucose pyrophosphorylase (UDPase) and phosphoglucomutase (PGM) (Leigh et al., 1979). UDPase is a cytoplasmic enzyme that catalyzes the reversible reaction of UDP-glucose with pyrophosphate to form glucose 1-phosphate and UTP. PGM catalyzes the conversion of glucose 1-phosphate to glucose 6-phosphate. Although reversible, the equilibrium constant of PGM favors glucose 6-phosphate formation (Dennis et al., 1997).
Table 1. Glycolytic enzymes, Enzyme Commission (E.C.) numbers and abbreviations used.
Enzyme E.C. abbreviation
Aldolase 4.1.2.13 ALD
ATP-dependent phosphofructokinase 2.1.7.11 PFK
Enolase 4.2.1.11 ENO
Fructokinase 2.7.1.4 FK
Glucose 6-phosphate isomerase 5.3.1.9 G6PI
Glyceraldehyde 3-phosphate dehydrogenase 1.2.1.12 GAPDH
Nonphosphorylating glyceraldehyde 3-phosphate dehydrogenase 1.2.1.13 NGAPDH
Hexokinase 2.7.1.1 HK
Phosphoglucose mutase 5.4.2.2 PGM
Phosphoglycerate kinase 2.7.2.3 PGK
Phosphoglycerate mutase 2.7.5.3 PGlyM
Phosphoenolpyruvatephosphatase 3.1.3.60 PEPase
Pyrophosphate-dependent phosphofructokinase 2.7.1.90 PFP
Pyruvate kinase 2.7.1.40 PK
Triose phosphate isomerase 5.3.1.1 TPI
UDP-glucose f ructose glucose UDPase PPi UTP Glucose 1-P ATP ADP FK, HK Fructose 6-P ATP ADP Glucose 6-P G6PI ATP ADP PPi Pi
Fructose 1,6 BP
PGM HK PFK PFP Aldolase Glyceraldehyde 3-P Dihydroxyacetone-P TPI 1,3-bisphosphoglycerate 3-phosphoglycerate
NAD++ Pi
NADH ADP ATP GAPDH PGK NADP+ NADPH G3PDH PGlyM phosphoenolpyruvate pyruvate ADP ATP Enolase PEPase 2-phosphoglycerate PK Pi Cell wall polysaccharides nucleic acids
aromatic amino acids lignin polyphenols
respiration amino alkaloids acids f atty acids Sucrose UDP sucrose synthase acid invertase alkaline invertase
H2O
H2O
Fig. 1. Schematic representation of glycolysis, including the enzymes that provide substrates for the pathway and the biological compounds synthesized from the pathway.
(Renz & Stitt, 1993). Hexokinases are highly reactive with glucose and limitedly reactive with fructose; fructokinases react specifically with fructose (Claeyssen & Rivoal, 2007). In addition, HK can act as a hexose sensor and mediate changes in gene expression in response to carbohydrate status (Rolland et al., 2002). The glucose phosphate formed by HK reaction is converted to fructose 6-phosphate by the action of glucose 6-6-phosphate isomerase (G6PI), a reversible enzyme with an equilibrium constant that slightly favors glucose 6-phosphate formation (Dennis et al., 1997).
Fructose 6-phosphate is converted to fructose 1,6-bisphosphate by the activities of ATP-dependent phosphofructokinase (PFK) and pyrophosphate-dependent phosphofructokinase (PFP). PFK, however, is primarily responsible for fructose 1,6-bisphosphate formation in most plant cells (Dennis & Blakely, 2000). PFK catalyses an irreversible reaction and is an important control point in the glycolytic pathway (Bowsher et al., 2008). In contrast, PFP, located exclusively in the cytosol, catalyzes a readily reversible reaction with an equilibrium constant that favors fructose 1,6 bisphosphate formation and operates near equilibrium in vivo (Plaxton, 1996; Dennis et al., 1997).
Aldolase (ALD) catalyzes an aldol cleavage of fructose 1,6-bisphosphate (F1,6BP) to form glyceraldehyde 3-phosphate and dyhydroxyacetone, two compounds that are interconverted by the action of triose phosphate isomerase (TPI). Both ALD and TPI catalyze reversible reactions with equilibrium constants that strongly favor F1,6BP and dihydroxyacetone formation, respectively (Dennis et al., 1997). Since the aldolase reaction equilibrium favors the reverse reaction, TPI has the important role of pulling the ALD reaction forward by keeping glyceraldehyde 3-phosphate concentrations low. Reactions in the lower part of the glycolytic pathway also consume glyceraldehyde 3-phosphate, and function to drive the ALD reaction forward (Bowsher et al., 2008).
phosphoglycerate kinase (PGK) transfers a phosphate group from 1,bisphosphoglycerate to ADP. The reaction produces ATP and 3-phosphoglycerate and is the first of two ATP-generating reactions in glycolysis (Dennis et al., 1997; Nelson & Cox, 2008). While reversible, PGK reaction favors 3-phosphoglycerate formation. A bypass of the ATP-forming PGK reaction is catalyzed by nonphosphorylating glyceraldehyde 3-phosphate dehydrogenase (NGAPDH). NGAPDH catalyzes the oxidation of glyceraldehyde 3-phosphate to 3-phosphoglycerate with concommittal reduction of NADP+ to NADPH (Dennis et al., 1997).
Phosphoglycerate mutase (PGlyM) catalyzes the interconversion of 3-phosphoglycerate and 3-phosphoglycerate (Nelson & Cox, 2008). The 2-phosphoglycerate formed by PGlyM reaction is dehydrated by enolase (ENO) to produce the high-energy compound phosphoenolpyruvate (PEP) (Bowsher et al., 2008). Both PGlyM and ENO catalyze readily reversible reactions.
In the final reaction of glycolysis, PEP is converted to pyruvate by pyruvate kinase (PK). The phosphate attached to the 2-position of PEP has a high negative free energy of hydrolysis and is transferred to ADP with the resulting formation of ATP and pyruvate in an irreversible reaction (Bowsher et al., 2008). Conversion of PEP to pyruvate can also be catalyzed by phosphoenolpyruvate phosphatase (PEPase). PEPase cleaves the phosphate group from PEP without ATP formation. PEPase, however, is located in the vacuole and inhibited by inorganic phosphate and is thought to be inactive under normal cellular conditions (Dennis et al., 1997).
that other glycolytic enzymes contribute to glycolytic control (Hatzfeld et al., 1989), and a growing body of evidence suggests that all enzymes of a pathway incrementally contribute to pathway regulation (Geigenberger et al., 2004).
2. MATERIAL AND METHODS
2.1. Plant material and postharvest treatments
Sugarbeet hybrid VDH66156 (VanDerHave, Rillands, Netherlands) was greenhouse grown in 15 L pots with supplemental light under a 16 h light/8 h dark regime, in United States Department of Agriculture (USDA). Roots were harvested 16 weeks after planting, gently hand washed, and kept at 10oC and 90 ± 5% relative humidity for 10 days, then incubated at 4oC, 90 ± 5% relative humidity for up to 100 days. Samples were collected after 0, 1, 2, 3, 4, 7, 10, 30, 60 and 100 days of storage. Longitudinal root sections, comprising approximately one quarter of the root and containing crown and root tissue that was representative of the whole root, were collected at each time point, with 7 replicate roots collected at each time point. Tissue samples were flash frozen in liquid nitrogen, lyophilized, ground to a fine powder, and stored at −80oC until analysis. The experiment was conducted twice.
2.2. Respiration rate determination
Respiration rate of individual roots was determined at 10oC by infrared CO2 analysis using an open system with a continuous airflow of 1000 μmol s-1.
Respiration rates were determined using a LICOR 6400 gas analyzer (Lincoln, NE, USA) modified for use with a 7 L sample chamber (Haagenson et al., 2006). For respiration rate determinations at 30, 60 and 100 days, roots were equilibrated at 10oC for 2 days prior to measurement.
2.3. Protein extraction and quantification
dithiothreitol (DTT), and 20 mM Na2SO3. Tissue and extraction buffer were
mixed by vortexing and homogenized by sonication for 10 min at 4oC. Extracts were clarified by centrifuging for 20 min at 17,000 x g and the supernatants were desalted by passage over a Sephadex G-25 (GE-Health Care Bio Sciences AB, Uppsala, Sweden) which was pre-equilibrated with 10 mM Hepes-NaOH (pH 7.2). Desalted extracts were centrifuged for 1 min at 2000 rpm at 4oC.
Total protein concentration was determined using the Bio-Rad Protein Assay Kit (Hercules, CA, USA) with bovine serum albumin as a standard. Protein assays for each replicate were performed in triplicate.
2.4. Enzyme activity assays
Enzyme activity assays were performed using modifications of the protocols of Moorhead & Plaxton, 1988 (HK, FK, PFK, and PK), Davies et al., 2003 & Manjunath et al., 1998 (PGM), Burrell et al., 1994 (G6PI, ALD, TPI, PGlyM, PGK, ENO, PEPase, PFP, and UDPase), and Plaxton, 1990, (GAPDH). All enzyme assays had a final volume of 180 µL and were performed in triplicate at 25oC by monitoring NADH oxidation or NAD+ reduction at 340 nm using a SpectraMax Plus microplate spectrophotometer (Molecular Devices Corp., Union City, CA). Assay components are as follows. HK: 125 mM HEPES-NaOH (pH 7.5), 10 mM MgCl2, 7 mM glucose, 1.5 mM NAD, 2 U glucose 6-phosphate
dehydrogenase, and 0.25 mM ATP; FK: 125 mM HEPES-NaOH (pH 7.5), 10 mM MgCl2, 3 mM fructose, 1.5 mM NAD, 2U glucose 6-phosphate
dehydrogenase, 6U phosphoglucose isomerase, and 0.25 mM ATP; PFK: 50 mM Tris-HCl (pH 8.0), 5 mM MgCl2, 2 mM EDTA, 2 mM fructose 6-phosphate,
0.1 mM NADH, 2U aldolase, 2U triose phosphate isomerase, 5 U glycerol 3-phosphate dehydrogenase, and 0.12 mM ATP; PK: 50 mM HEPES-NaOH (pH 7.0), 50 mM KCl, 10 mM MgCl2, 2 mM DTT, 0.4 mg mL-1 BSA, 1 mM
phosphoenolpyruvate, 0.075 mM NADH, 26 U lactate dehydrogenase, and 1 mM ADP; PGM: 50 mM Tris-HCl (pH 7.5), 10 mM MgCl2, 30 uM glucose
1,6-bisphosphate, 0.5 mM NAD, 2U glucose 6-phosphate dehydrogenase, and 0.9 mM glucose 1-phosphate; G6PI: 75 mM Gly-Gly (pH 8.5), 10 mM MgCl2, 1 mM
isomerase; TPI: 100 mM HEPES-NaOH (pH 8.0), 5 mM EDTA, 0.2 mM NADH, 1.5 mM DL-glyceraldehyde 3-phosphate, and 1 U glycerol 3-phosphate dehydrogenase; PGK: 100 mM HEPES-NaOH (pH 7.6), 1 mM EDTA, 2 mM MgSO4, 0.2 mM NADH, 6.5 mM 3-phosphoglycerate, 1 mM ATP, and 3.3 U
glycerol 3-phosphate dehydrogenase; PGlyM: 100 mM Tris-HCl (pH 7.6), 10 mM MgSO4, 2.7 mM ADP, 0.2 mM NADH, 3 mM 3-phosphoglycerate, 1 U enolase, 5
U pyruvate kinase, 6 U lactate dehydrogenase, and 50 mM 3-phosphoglycerate; ENO: 100 mM HEPES-NaOH (pH 7.5), 10 mM MgCl2, 1 mM NADH, 2.7 mM
ADP, 0.5 mM 2-phosphoglycerate, 5 U pyruvate kinase, 6 U lactate dehydrogenase, and 10 mM 2-phosphoglycerate; PEPase: 50 mM Tris-HCl (pH 7.5), 1 mM phosphoenolpyruvate, 4 mM MgCl2, 0.2 mM NADH, and 3 U lactate
dehydrogenase; PFP: 100 mM Tris-HCl (pH 8.0), 5 mM fructose 6-phosphate, 2 mM sodium pyrophosphate, 5 mM MgCl2, 0.20 mM NADH, 1U aldolase, 1.3 U
glycerol 3-phosphate dehydrogenase, and 10 U triose phosphate isomerase; UDPase: 100 mM Tris-HCl (pH 8.0), 5 mM MgCl2, 1.6 mM NAD, 0.8 mM
UDP-glucose, 4 U phosphoglucomutase, 4 U glucose 6-phosphate dehydrogenase, and 0.4 mM sodium pyrophosphate; GAPDH: 100 mM Tris-HCl (pH 7.8), 4.5 mM 3-phosphoglycerate, 8 mM MgSO4, 0.32 mM NADH, 2 mM ATP, 1 mM EDTA, 2
mM DTT, and 1.8 U 3-phosphoglycerate kinase. Assay reactions were initiated by the addition of ATP for HK, FK and PFK; ADP for PK assay; glucose 1-phosphate for PGM; 3-PGA for PGlyM; 2-PGA for ENO; sodium pyro1-phosphate for UDPase; and protein extract for G6PI, ALD, TPI, PGK, PEPase, PFP, and GAPDH. See appendix 1, 2 and 3 for more details.
2.5. Statistical analysis
3. RESULTS AND DISCUSSION
3.1. Storage period effects on root respiration rate
Respiration rate was nearly 23 mg CO2 kg-1 h-1 after harvest, but declined
65% after one day of storage (Fig. 2). Respiration rate declined another 55% during the first week in storage to a rate of 3.6 mg CO2 kg-1 h-1. Between 7 and
60 days in storage, respiration rate was practically constant. After 100 days storage, respiration rate increased by 48%.
The high respiration rate observed after harvest is likely due to both temperature and injury effects on respiration rate. Although the temperature of roots after harvest was not determined, root temperature was greater than 10 oC since roots did not have sufficient time to equilibrate to their storage temperature, and respiration rate is known to be affected by temperature (Wyse, 1978). Injury may also have contributed to the high respiration rate after harvest as well as during the first week of storage. Although roots were gently hand harvested, injury was inevitable, as roots were scalped to remove all leaves and vegetative buds from the root crown, lateral roots were removed during harvest and the lower portion of the root tail was excised. Many studies have demonstrated that root injury increases root respiration rate, with the greatest impact of injury on root respiration rate occurring in the first three days after injury (Dilley et al., 1970; Akeson, et al., 1974; Cole, 1977; Wyse & Peterson, 1979).
That respiration rate declined during the first week of storage is probably due to healing of harvest-related injuries during the first week. Ibrahim et al. (2001) have shown that most wound-healing processes occur within the first 9 days after injury. Wound healing in sugarbeet root involves the deposition of polymers including lignin and suberin to seal off wound sites. Biosynthesis of these compounds prevents dehydration and restricts entry by microorganisms, but requires substrates and energy which are provided by the respiratory pathway.
postharvest storage and is known to increase root respiration rate (Lafta & Fugate, 2009). The increase in respiration is not thought to be related to the development of storage diseases since no visual signs of fungal or bacterial contamination were evident.
0 2 4 6 8 10 30 45 60 75 90 105 0
3 6 9 12 15 18 21 24
Re
spi
ratio
n ra
te
(mg C
O 2
kg
-1 h -1 )
Storage at 4oC (Days)
Fig. 2. Respiration rate of sugarbeet roots (VDH66156) storage for 10 days at 10oC, followed by 4oC until 100 days. Respiration rate were determined after equilibrium of temperature at 10oC. Vertical bars represent the standard error of the mean (n=7).
3.2. Enzymatic activity
Activities of the enzymes of the glycolytic pathway and UDP-glucose pyrophosphorylase were determined throughout 100 days storage. Prior to determining activities, all enzyme activity assays were optimized for substrate concentrations and checked for linearity.
groups by activity level: 1) very high (higher than 500 µmol min-1 g-1 protein); 2) high (101 - 500 µmol min-1 g-1 protein); 3) moderate (26 - 100 µmol min-1 g-1 protein); 4) low (2.1 - 25 µmol min-1 g-1 protein); 5) very low (≤ 2.0 µmol min-1 g-1 protein).
Table 2. Clustering of glycolytic enzymes by catalytic activity in sugarbeet roots
Activity (µmol min-1 g-1 protein) Classification Enzyme
Mean Range
Very High TPI 6608 5680 – 7271
High UDPase 362 287 – 507
G6PI 245 168 – 334
PGM 103 93 – 113
Moderate PK 71 61 – 84
ENO 30 27 – 34
Low PGK 16 12 – 21
ALD 15 14 – 16
PGlyM 13 10 – 16
PFK 4.9 4.2 - 5.5
GAPDH 3.9 3.4 - 4.3
PEPase 3.0 2.6 – 3.4
Very low HK 2.0 1.4 - 2.3
FK 1.0 0.9 - 1.2
PFP 0.9 0.6 - 1.0
pathway (HK and FK) and a bypass of the reaction catalyzed by PFK. Low PFP activity is perhaps not surprising, since little glycolytic flux typically occurs through this enzyme (Dennis & Blakely, 2000).
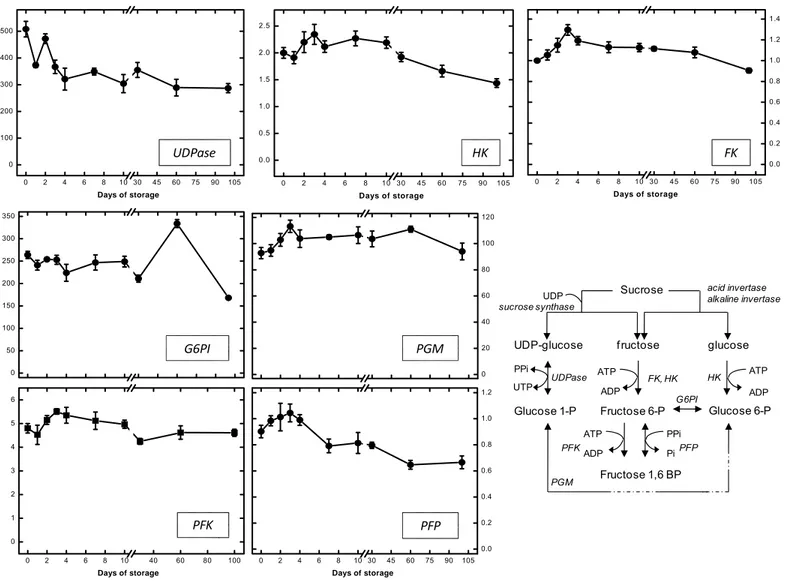
The enzymatic activities of sugarbeet roots, presented in Fig. 3, 4, 5 and appendix 4, are represented individually for UDPase and glycolytic enzymes. UDPase activity generally declined between 0 – 4 days, and was reduced nearly 40% by 4 days in storage. For the remaining 100 days of the storage period, UDPase activity was practically constant. The activity ranged from 508 µmol min-1 g-1 protein at harvest to 290 µmol min-1 g-1 protein at 100 days of storage (Fig. 3).
24
0 2 4 6 8 10 30 45 60 75 90 105 0.0 0.2 0.4 0.6 0.8 1.0 1.2 1.4
Days of storage
0 50 100 150 200 250 300 350 HK G6PI PGM PFK PFP FK UDPase 0 20 40 60 80 100 120
UDP-glucose f ructose glucose
UDPase PPi UTP Glucose 1-P ATP ADP FK, HK Fructose 6-P ATP ADP Glucose 6-P G6PI ATP ADP PPi Pi
Fructose 1,6 BP PGM HK PFK PFP Sucrose UDP sucrose synthase acid invertase alkaline invertase
0 2 4 6 8 10 30 45 60 75 90 105 0 100 200 300 400 500
Days of storage
0 2 4 6 8 10 30 45 60 75 90 105 0.0 0.5 1.0 1.5 2.0 2.5
Days of storage
0 2 4 6 8 10 40 60 80 100 0 1 2 3 4 5 6
Days of storage
0 2 4 6 8 10 30 45 60 75 90 105 0.0 0.2 0.4 0.6 0.8 1.0 1.2
Days of storage
Fig. 3. Enzymatic activities (µmol min-1 g-1 protein) of UDP-glucose pyrophosphorylase (UDPase), hexokinase (HK), fructokinase (FK), phosphoglucose
Phosphofructokinase activity increased during 2 - 10 days of storage (Fig. 3). Maximum PFK activity, 5.4 µmol min-1 g-1 protein, occurred after 3 days in storage, when activity increased by 13% relative to the activity at harvest. With continued storage, PFK activity returned to levels similar to those occurring after harvest. Pyrophosphate-dependent phosphofructokinase activity, which produces the same glycolytic intermediate as PFK, was statistically unchanged during the first four days in storage (Fig. 3). With continued storage, PFP activity declined stepwise, declining, on average, 11% from harvest levels in roots stored for 7 - 30 days, and declining, on average, 27% from harvest levels in roots stored 60 and 100 days. On average, PFK activity was 5.4 fold greater than PFP activity.
Aldolase activity was unchanged during storage, with activity at harvest and after 100 days of storarge equal to 15.6 µmol min-1 g-1 protein (Fig. 4). While some minor fluctuations in ALD activity occurred during the storage period, these were all statistically non-significant. Triose phosphate isomerase activity was generally increased throughout storage with TPI activity between 1 and 100 days elevated by an average of 11% (Fig. 4). At 60 days storage, a transient decrease in TPI activity was observed, although TPI activity was elevated after 30 and 100 days storage. Maximum TPI activity, 7271 µmol min-1 g-1 protein, occurred after 100 days of storage, activity was increasing by 21% relative to the activity at harvest. Glyceraldehyde 3-phosphate dehydrogenase activity did not change during storage. Minor fluctuations in GAPDH activity were observed but these were not significant. Phosphoglycerate kinase activity was constant for the first 4 days in storage, but increased 56% at day 7, relative to activity at harvest. PGK activity remained elevated for the remainder of the storage period (Fig. 4). Maximum PGK activity occurred at 7 days, when activity was 21.5 µmol min-1 g-1 protein.
0 2 4 6 8 10 30 45 60 75 90 105
0 1 2 3 4 5
Days of storage
0 3 6 9 12 15 18 0 1000 2000 3000 4000 5000 6000 7000 8000 ALD TPI PGK GAPDH
Fructose 1,6 BP
Aldolase
Glyceraldehyde 3-P Dihydroxyacetone-P TPI
1,3-bisphosphoglycerate
3-phosphoglycerate
NAD++ P i NADH ADP ATP GAPDH PGK NADP+ NADPH G3PDH
0 2 4 6 8 10 30 45 60 75 90 105
0 5 10 15 20 25
Days of storage
Fig. 4. Enzymatic activities (µmol min-1 g-1 protein) of aldolase (ALD), triose phosphate isomerase (TPI), glyceraldehyde 3-phosphate
dehydrogenase (GAPDH) and phosphoglycerate kinase (PGK) in sugarbeet roots stored for 10 days at 10oC, followed by storage
Phosphoglycerate mutase activity, which catalyzes the reversible conversion of 3-phosphoglycerate to 2-phosphoglycerate, was elevated throughout 100 days in storage, with the increase occurring in two steps. PGlyM activity increased 23% after one day in storage and generally remained elevated through day 30 (Fig. 5). At 60 days, PGlyM activity increased an additional 30% and remaining at this level through 100 days storage.
Enolase activity also exhibited a two-step increase during storage (Fig. 5). Enolase activity was constant between 0 - 2 days of storage, increased 12% in the third day in storage, and generally remaining at this elevated level through day 30 in the storage period. At 60 days, ENO activity increased an additional 11% and remained at this level through 100 days storage.
The irreversible conversion of phosphoenolpyruvate to pyruvate can occur by PK and PEPase activity. In the present study, PK activity transiently increased during days 1 to 4 of the storage period, with an average increase in activity of 31%, relative to activity at harvest (Fig. 5). A second, transient elevation in PK activity occurred between days 10 and 60 in the storage period when activity increased, on average, 8% relative to the activity at harvest. Maximum PK activity, 84.44 µmol min-1 g-1 protein, was observed 2 days after harvest. Phosphoenolpyruvate phosphatase activity also exhibited a transient increase in activity during days 1 to 4 of the storage period. The increase in PEPase activity, however, was much smaller than that observed for PK activity with an average 9% increase in PEPase activity during this period. With prolonged storage, PEPase activity increased. The increase in activity was first evident in roots stored for 60 days and continued until 100 days when activity was elevated by 30% relative to activity at harvest. PEPase activity, on average was 4% the activity of PK.
0 5 10 15 20 25 30 35 0 3 6 9 12 15 PGlyM Enolase PK PEPase 3-phosphoglycerate PGlyM phosphoenolpyruvate pyruvate ADP ATP Enolase PEPase 2-phosphoglycerate PK Pi H2O
H2O
0 2 4 6 8 10 30 45 60 75 90 105
0 20 40 60 80
Days of storage
0 2 4 6 8 10 30 45 60 75 90 105
0.0 0.5 1.0 1.5 2.0 2.5 3.0 3.5 4.0
Days of storage
Fig. 5. Enzymatic activities (µmol min-1 g-1 protein) of phosphoglycerate mutase
(PGlyM), enolase, pyruvate kinase (PK) and phosphoenolpyruvate
phosphatase (PEPase) in sugarbeet roots stored for 10 days at 10oC, followed
by storage at 4oC for up to 100 days. Vertical bars represent the standard error
of the mean (n = 7).
activity was greatest for FK. FK activity increased as much as 26% relative to its activity at harvest; HK and PFK activities peaked at levels that were 16% and 13% of their activities at harvest. The elevation in FK activity also endured longer than was observed for HK and PFK activities, and FK activity remained elevated at 30 days storage. The activity of all three enzymes declined with prolonged storage, and by 100 days, HK and FK activities had decreased to levels below those occurring at harvest and PFK activity decreased to levels similar to those occurring at harvest.
Transient increases in HK, FK and PFK have previously been observed in severely wounded roots (Klotz et al., 2006). The increases in severely wounded roots exceeded those found in this study, which was conducted with minimally wounded roots. In severely wounded roots, HK, FK and PFK activities increased maximally by 60, 150, and 70%, respectively. The differences in magnitude of the elevation between the two studies may reflect differences in the intensity of wounding. In the previous study, it was postulated that HK, FK and PFK activities in wounded roots were elevated to meet the demand for glycolytic intermediates and products for wound-healing processes. Interestingly, in both studies, FK activity was elevated to a greater extent and for a longer portion of the storage period than HK or PFK activities. HK, FK and PFK were all present in stored sugarbeet roots at low concentrations, indicating that their activities may be limiting. All three enzymes catalyze irreversible reactions and have been suggested to have a role in the regulation of glycolysis, with PFK attributed a central role in the regulation (Plaxton, 1996).
moderate activity and was more than 30-fold, 60-fold and 15-fold greater than HK, FK, and PFK, respectively (Appendix 4). The high activity of PK in relation to these early glycolytic enzymes suggests this enzyme is not limiting in sugarbeet root. A similar conclusion was drawn in an earlier study with wounded roots (Klotz et al., 2006). PK, however, may have a key role in regulating glycolysis by affecting cellular PEP concentrations, as suggested by Plaxton (1996). PEP is a potent inhibitor of PFK activity and a reduction in PEP levels, brought about by an enhancement of PK activity, will stimulate PFK activity (Plaxton, 1996, Dennis et al., 1997).
While many similarities were observed between enzymes in the glycolytic pathway, no relationship was observed between root respiration rate and any glycolytic enzyme activity. Respiration in sugarbeet root is thought to be limited by the availability of respiratory substrates which are provided by the combined actions of sucrolytic, glycolytic, and TCA cycle pathway enzymes. Previous research has demonstrated that respiration rate is not associated with any sucrolytic enzymes (Klotz et al., 2006). The lack of association between respiration rate and any glycolytic enzymes suggests that glycolysis does not control the availability of respiratory substrate or that no single enzyme in the glycolytic pathway controls respiration rate. This is perhaps not surprising, since a growing body of evidence suggests that all enzymes of a pathway incrementally contribute to pathway regulation (Geigenberger et al., 2004).
3.3. Principal component analysis (PCA)
variability in the data; principal component 2 accounted for 26% of the variability. The procedure used to calculate the principle components is shown in Appendix 5.
The distance between data points in a PCA analysis reflects the extent that data sets vary. Therefore, data points that are in close proximity to each other reflect data sets that are similar. In the PCA of sugarbeet root glycolytic enzymes, four distinct groupings of enzymes was apparent (Fig. 6).
-2 -1 0 1 2
-2 -1 0 1 2 UDPase PFP TPI PK PGK PEPase ALD PGM PFK G6PI GAPDH PGlyM ENO FK HK Principal c o mponent 2
Principal component 1
Fig. 6. Principal component analysis 1 and 2, for glycolytic enzymes and UDPase
standardized as enzymatic activity of sugarbeet roots storage for 10 days at
10oC, followed by 4oC up to 100 days.
were not obvious (Fig. 4 and 5), but on closer analysis, the activities of all of these enzymes were elevated from days 7 - 100 of the storage period. The last cluster contained PEPase and TPI. These enzymes had elevated activities during days 1 - 4 and 100 of the storage period. The significance of the similarities observed between the behaviors of different glycolytic enzymes during storage or revealed by PCA is unknown. However, similar changes in activity suggest that their expression may be regulated similarly.
CONCLUSIONS
• The high activities observed for UDPase, TPI, G6PI, and PGM suggest that their activities are probably not limiting.
• High activities of G6PI and PGM suggest that the hexose phosphates, fructose 6-phosphate, glucose 6-phosphate and glucose 1-phosphate, are readly interconverted.
• PFK activity was 5.4 fold greater than PFP activity, indicating that most of the conversion of fructose 6-phosphate to fructose 1,6-phosphate was catalyzed by PFK.
• PK activity was, on average, 24-fold greater than PEPase activity suggesting that most of the conversion of phosphoenolpyruvate to pyruvate is catalyzed by PK.
• HK, FK and PFK were present at low activities throughout storage, and these low activities may limit the flow of carbon through the glycolytic pathway.
• HK, FK, and PFK activities exhibited similar changes during storage.
• ALD and GAPDH activity were constant during the storage period.
• PGM, TPI, PGK, PGlyM, and ENO activities generally increased during storage.
• The lack of correlation between any individual glycolytic enzyme and root respiration rate during storage suggests that glycolysis does not control the availability of respiratory substrate or that no single enzyme in the glycolytic pathway controls respiration rate.
LITERATURE
ap Rees, T. (1980). Assessment of the contributions of metabolic pathways to plant respiration. In: Stumpf, P.K.; Conn, E.E (eds). The Plant Biochemistry of Plants, V.2, Academic Press, New York, pp. 1-29.
Akeson, W.R.; Fox, S.D.; Stout, E.L. (1974). Effect of topping procedure on beet quality and storage losses. Journal of the American Society of Sugarbeet Technologists, 18: 125-135.
Barbour, R.D.; Wang, C.H. (1961). Carbohydrate metabolism of sugarbeets. I. Respiratory catabolism of mono and disaccharides. Journal of the American Society of Sugarbeet Technologists, 11: 436-442.
Bowsher, C.; Steer, M.; Tobin, A. (2008). Respiration. In: Plant Biochemistry. Garland Science, Taylor & Francis Group, LLC. p.143-193.
Burrell, M.M.; Mooney, P. J.; Blundy, M.; Carter, D.; Wilson, F.; Green, J.; Blundy, K. S.; Rees, T.A. (1994). Genetic manipulation of 6-phosphofructokinase in potato tubers. Planta 194: 95-101.
Claeyssen, E.; Rivoal, J. (2007). Isozymes of plant hexokinase: Occurrence, properties and functions. Phytochemistry, 68: 709-731.
Cole, D.F. (1977). Effect of cultivar and mechanical damage on respiration and storability of sugarbeet roots. Journal of the American Society of Sugarbeet Technologists, 19: 240-245.
Davies, E.J.; Tetlow, I.J.; Bowsher, C.G.; Emes, M.J. 2003. Molecular and
biochemical characterization of cytosolic phosphoglucomutase in wheat endosperm
(Triticum aestivum L. cv. Axona). Journal Experimental Botany, 54: 1351-1360.
Dennis, D.T.; Huang, Y.; Negm, F.B. (1997). Glycolysis, the pentose phosphate pathway and anaerobic respiration. In: Dennis, D.T.; Turpin, D.H.; Lefebvre, D.D.; Layzell, D.B. (eds). Plant Metabolism. Longman Singapore Publising Ltd,
Dennis, D.T.; Blakeley, S.D. (2000). Carbohydrate metabolism. In: Buchanan, B.B.; Gruissem, W.; Jones, R.L. (eds). Biochemistry Molecular Biology of Plants. American Society of Plant Physiologists, Rockville, Maryland. p.630-675.
Dilley, D.R.; Wood, R.R.; Brimhall, P. (1970). Respiration of sugarbeets, following harvest in relation to temperature, mechanical injury and selected chemical
treatment. Journal of the American Society of Sugarbeet Technologists, 15: 671-683.
Echeverría, E.; Gonzalez, P. (2003). Evidence for a tonoplast associated form of sucrose syntahse and its potential involvement in sucrose mobilization from the vacuole. Journal Experimental Botany, 54: 1407-1414.
Geigenberger, P.; Stitt, M.; Fernie, A.R. (2004). Metabolic control analysis and regulation of the conversion of sucrose to starch in growing potato tubers. Plant, Cell and Environment, 27: 655-673.
Givan, C.V. (1999). Evolving concepts in plant glycolysis: two centuries of progress.
Biological Reviews, 74: 277-309.
Haagenson, D.M.; Klotz, K.L.; Campbell, L.G.; Khan, M.F.R. (2006). Relationships between root size and postharvest respiration rate. Journal of Sugarbeet
Research, 43: 129-144.
Hatzfeld, W-D.; Dancer, J.; Stitt, M. (1989). Direct evidence that pyrophosphate: fructose-6-phosphate phosphotransferase can act as a glycolytic enzyme in plants.
FEB, 254: 215-218.
Ibrahim, L.; Spackman, V.M.T.; Cobb, A.H. (2001). An investigation of wound healing in sugarbeet roots using light and fluorescent microscopy. Annals of Botany, 88: 313-320.
Klotz, K.L.; Finger, F.L. (2004). Impact of temperature, length of storage and
Klotz, K.L.; Finger, F.L.; Anderson, M.D. (2006). Wouding increases glycolytic but not soluble sucrolytic activities in stored sugarbeet root. Postharvest Biology and Technology, 41: 48-55.
Kruger, N.J. (1997). Carbohydrate synthesis and degradation. In: Dennis, D.T.; Turpin, D.H.; Lefebvre, D.D.; Layzell, D.B. (eds). Plant Metabolism. Longman Singapore Publising Ltd, Singapore, p.83-104.
Lafta, A.M.; Fugate, K.K. (2009). Dehydration accelerates respiration in postharvest sugarbeet roots. Postharvest Biology and Technology, 54: 32-37.
Leigh, R.A.; ap Rees, T.; Fuller, W.A.; Banfield, J. (1979). The location of acid invertase activity and sucrose in the vacuoles of storage roots of beetroot (Beta
vulgaris). Biochemical Journal, 179: 539-547.
Manjunath, S.; Lee, C.-H.K.; VanWinkle, P.; Bailey-Serres, J. (1998). Molecular and biochemical characterization of cytosolic phosphoglucomutase in maize. Plant Physiology, 117:997-1006.
Moorhead, G.B.G., Plaxton, W.G. (1988). Binding of glycolytic enzymes to a particulate fraction in carrot and sugarbeet storage roots. Plant Physiology. 86: 348-351.
Nelson, D.L.; Cox, M.M. (2008). Glycolysis, gluconeogenesis, and the pentose phosphate pathway. In: Lehninger – Principles of Biochemistry.W.H. Freeman and Company, New York, p.527-568.
Plaxton, W.C. ( 1990). Glycolysis. In: Dey, P.M. and Harborne, J.B. (eds). Methods in Plant Biochemistry, Academic Press London. Vol 3, p. 145-173.
Plaxton, W.C. (1996). The organization and regulation of plant gltcolysis. Annual Rev. Plant Physiology. Plant Molecular Biology. 47: 185-214.
Renz, A.; Stitt, M. (1993). Substrate specificity and product inhibition of different forms of fructokinases and hexokinases in developing potato tubers. Planta, 190: 166–175.
Rolland, F.; Moore, B.; Sheen, J. (2002). Sugar sensing and signaling in plants.
Sakalo, V.; Tyltu, A. (1997). Enzymes of carbohydrate metabolism in sugarbeet roots in the course of short-term storage under unfavorable conditions. Russian Journal of Plant Physiology, 44: 70-76.
Thomas, S.; Mooney, P.J.F.; Burrell, M.M.; Fell, D.A. (1997). Finite change analysis of glycolytic intermediates in tuber tissue of lines of transgenic potato (Solanum
tuberosum) overexpressing phosphofructokinase. Biochemical Journal, 322:
111-117.
Wang, C.H.; Barbour, R.D. (1961). Carbohydrate metabolism of sugarbeets. II. Catabolic pathways for acetate, glyoxylate, pyruvate, glucose and gluconate.
Journal of the American Society of Sugarbeet Technologists, 11: 443-454. Wyse, R.E. (1978) Effect of low and fluctuating temperatures on the storage life of sugarbeets. Journal of the American Society of Sugarbeet Technologists, 20: 33-42.
CHAPTER 2
GLYCOLYTIC FLUX IN ROOTS OF SUGARBEET
ABSTRACT
The metabolic flux through glycolysis depends, in part, on the activity of the pathway’s individual enzymes. Enzymatic activities are determined using optimum substrate concentrations, pH and temperature conditions and provide a measure of the quantities of active enzymes present. The quantity of enzyme present, measured as enzyme activity, is dependent on the rate of an enzyme’s biosynthesis and degradation. Knowledge of the glycolytic enzyme activities in postharvest sugarbeet roots is useful, but may not accurately reflect the flux of carbon through the pathway. Flux through a pathway is usually determined by measuring the rate at which labeled compounds are metabolized. No studies, however, have examined the flux of carbon compounds through the glycolytic pathway in sugarbeet roots. The purpose of this work was to determine the flux of carbon through glycolysis in sugarbeet roots by following the catabolism of radiolabelled sucrose in tissue discs in response to temperature. Sugarbeet hybrid VDH66156 was greenhouse grown and roots were harvested, gently hand washed and kept at 10oC and 90 ± 5% relative humidity for 10 days in Experiment 1, and at 4, 10 or 20oC and 90 ± 5% relative humidity for 10 days for Experiment 2. Respiration rate was determined using whole roots. For labelling experiments, discs were collected with a cork borer. In Experiment 1, discs were incubated in 1 mL of 50 mM Mes-KOH (pH 6.5) and 70 kBq mL-1 [U-14C] sucrose or in 50 mM Mes-KOH (pH 6.5), 70 kBq mL-1 [U-14C] sucrose and 50 µM cycloheximide (CHI) at 20oC for 3 or 5 hours. In Experiment 2, discs (14) were incubated in 1 mL of 50 mM Mes-KOH (pH 6.5), 70 kBq mL-1 [U-14C] sucrose and 50 µM CHI for 5 hours at 4, 10 and 20 oC. Incubations were performed in petri dishs. 14CO2 was trapped with 5 N KOH-impregnated paper filters cut to the
1. INTRODUCTION
The metabolic flux through glycolysis depends, in part, on the activity of the pathway’s individual enzymes. Enzymatic activities are determined using optimum substrate concentrations, pH and temperature conditions and provide a measure of the quantities of active enzymes present. The quantity of enzyme present, measured as enzyme activity, is dependent on the rate of an enzyme’s biosynthesis and degradation. The activities of glycolytic enzymes are believed to provide a coarse control of glycolysis in plants (Plaxton, 1996).
The optimum conditions used to determine enzyme activities, however, are not found living organisms, and enzyme activities in planta typically differ from those measured in vitro. Substrate concentrations, pH and temperature conditions deviate from those that produce maximum activity, and many glycolytic enzymes activities are affected by the concentrations of products, inhibitors, and activators, oligomerization, reversible modifications such as phosphorylation or reduction of internal disulfide bonds, and intracellular compartmentalization of sequential enzyme activities (Plaxton, 1996). For example, phosphofructokinase (PFK) activity is inhibited by phosphoenolpyruvate, 3-phosphoglycerate, 2-phosphoglycerate and ATP, and activated by inorganic phosphate and Mg+2. Phosphoenolpyruvate phosphatase (PEPase) activity is affected by intracellular compartmentalization and inhibited by inorganic phosphate. Enolase (ENO) activity is thought to be affected by phosphorylation (Miernyk & Dennis, 1992). The activity of another glycolytic enzyme, pyruvate kinase (PK) is activated by its substrate, phosphoenolpyruvate, inhibited by ATP, a product of its reaction, and affected by oligomerization (Kowallik et al., 1990; Plaxton, 1996).
2. MATERIAL AND METHODS
2.1. Plant material and postharvest treatments
Sugarbeet hybrid VDH66156 (VanDerHave, Rillands, Netherlands) was greenhouse grown in 15 L pots with supplemental light under a 16 h light/8 h dark regime. Roots of 1.0 to 1.5 kg were harvested, gently hand washed and kept at 10oC and 90 ± 5% relative humidity for 10 days in Experiment 1, and at 4, 10 or 20oC and 90 ± 5% relative humidity for 10 days for Experiment 2. Respiration rate was determined using whole roots with 3 and 6 replicates in Experiments 1 and 2, respectively. For labelling experiments, discs (5 x 3 mm, diameter x height) were collected with a cork borer, perpendicular to the roots’ central axis. Tissue was collected at the widest portion of the root and contained the internal tissue between the epidermis and the central vascular cylinder. Experiments were conducted with 6 replicates comprised of 14 discs collected from a single root, with enough discs collected from each root to provide a replicate for each treatment. In Experiment 1, two replicates were collected per root; in Experiment 2, one replicate was collected per root. Discs were washed 3 times for 3 min in 3 mL of 50 mM Mes-KOH, pH 6.5, to remove debris prior to use.
2.2. Respiration rate determination
Respiration rate of individual roots was determined at the same temperature at which sugarbeet roots were stored by infrared CO2 analysis using an open system
with a continuous air flow of 1000 μmol s-1. Respiration rates were determined using a LICOR 6400 gas analyzer (Lincoln, NE, USA) modified for use with a 7 L sample chamber (Haagenson et al., 2006).
2.3. Labelling experiments
2.3.1. Tissue labelling
In Experiment 1, discs (14) were incubated in 1 mL of 50 mM Mes-KOH (pH 6.5) and 70 kBq mL-1 [U-14C] sucrose (21.8 GBq/mmol, MP Biomedical, Solon, OH) or in 50 mM Mes-KOH (pH 6.5), 70 kBq mL-1 [U-14C] sucrose and 50 µM cycloheximide (CHI) at 20oC for 3 or 5 hours. In Experiment 2, fourteen discs were incubated in 1 mL of 50 mM Mes-KOH (pH 6.5), 70 kBq mL-1 [U-14C] sucrose and 50 µM CHI for 5 hours at 4, 10 and 20 oC. Incubations were performed in petri dish (35 x 10 mm, Easy Grip™, Becton Dickison, Franklin Lakes, NJ). 14CO2 was trapped
with 5 N KOH-impregnated paper filters cut to the same size as the lid. Plates in Experiment 2 were sealed with petroleum jelly (Vaseline®, Unilever, Greenwich, CT). Plates were gently shaken on a rotary shaker during incubation.
2.3.2. Tissue extraction
Tissue extractions were performed using modifications of the protocols of Viola & Davies (1994).
NF BF AF PE
Beets Discs
incubation
[14C] sucrose
extraction
soluble
components
insoluble
components
scintillation counting
+ HPLC
discs filter paper
CO2
cell content
fraction
CO2
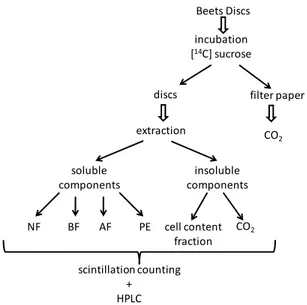
Fig. 1. Representative scheme of the separation and scintillation counting of soluble
components (neutral fraction - NF; basic fraction - BF; acidic fraction - AF; and phosphoester - PE) and insoluble components (cell wall contains fraction and CO2).
nitrogen and lyophilized (-80oC) for 24 h. Freeze-dried discs were ground to a fine powder with a glass pestle, homogenized in 10 mL of boiling 80% v/v (aq.) ethanol and sonicated for 15 min at 4oC. Samples were extracted in boiling 80% ethanol (hot plate) for 20 min. Extracts were clarified by centrifuging at 17,000 x g for 20 min at 25oC. Pellets were washed two more times with 80% v/v (aq.) ethanol and the supernatants were combined and then dried overnight on a rotary film evaporator. Samples were then resuspended in 1 mL (final volume) distilled water. The samples were separated into soluble and insoluble components (Appendix 6).
2.3.3. Analysis of ethanol-soluble components
Soluble components were partitioned into neutral, basic, acidic and phosphate-ester fractions.
2.3.3.1. Neutral fraction
Soluble extracts described in Section 2.3.2 were transferred to microcentrifuge tubes containing 500 mg of a cation-exchange resin (Dowex-50W x 81, charged with 2 M HCl, then washed with distilled water). Tubes were incubated for 30 min at 20oC with gentle shaking. Supernatants were removed with a pipette, and the resin was washed 4 times with 1 mL distilled water for 10 min. Supernatants were combined and transferred to 15 mL disposable test tubes containing 250 mg of anion-exchange resin (Dowex-1 x 4200, charged with 1M sodium acetate, followed by 0.1 M acetic acid and distilled water). Tubes were incubated as describ for cation-exchange resin and supernatants were combined, forming the neutral fraction.
2.3.3.2. Phosphoester fraction
resin-containing tube with a pipette. The resin was washed 4 times with 1.5 mL distilled water for 10 min. All supernatants were combined to form the phosphate-ester fraction.
2.3.3.3. Acidic fraction
The acidic fraction was obtained by washing the anion-exchange resin 4 times with 1 mL 4 M formic acid for 10 min. All supernatants were combined to form the acidic fraction.
2.3.3.4. Basic fraction
The basic fraction was obtained by washing the cation-exchange resin 5 times with 2 mL of 14.8 M NH4OH for 10 min. All supernatants were combined to form the
basic fraction.
2.3.4. Analysis of ethanol-insoluble components
The pellet obtained following extraction of ethanol soluble components was resuspended in 10 mL distilled water and incubated for 1 h at 100oC. After thorough mixing, a 1 mL aliquot was rapidly removed and added to 1 mL of 200 mM acetate buffer, pH 4.5, containing 20 units amyloglucosidase (Aspergillus niger, Sigma). The samples were incubated at 37oC for 12 h. Samples were then centrifuged for 30 min at 17,000 x g and the pellet was washed 4 times with 1 mL of distilled water for 10 min each time. Supernatants were combined and analyzed by HPLC. Pellets were transferred to paper thimbles which were oxidized using a Packard Model 307 Oxidizer (Packard Chemical, Meridan, CT). Radioactivity released as CO2 was
trapped and determined by liquid scintillation counting. 2.4. HPLC analysis of sucrose, glucose and fructose
isocraticly with 62 mM NaOH eluent at 1 mL min-1. Compounds were identified and quantified using external standards.
2.5. TLC separation of sucrose, glucose and fructose
2.5.1. Sample preparation
Aliquots (3.5 mL) of the neutral fractions were dryed overnight on a rotary film evaporator and resuspended in 1 mL distilled water. Resuspended samples were passed over a 3 mL charcoal:Celite (1:1, w/w) column which had previously been washed sequentially with water, methanol and water (Tarpley & Vietor, 1997). Glucose and fructose were removed from the column by eluting three times with 1 mL distilled water and the eluates were combined (Fig. 2).
Sequence of washing :
water – methanol ‐water
Charcoal + Celite (1:1)
3 mL column + glass filter
sucrose glucose
+
fructose
Neutral fraction
sucrose glucose+fructose
TLC plate
scintillation counting
+ HPLC
Fig. 2. Separation of sucrose, glucose + fructose from neutral fraction by charcoal column.
2.5.2. TLC separation
The glucose and fructose-containing fraction (3 µL) was loaded onto a preparative silica gel TLC plate (50 µM silica gel G , 20 x 20 cm; Analtech, Newark, DE), as shown in Fig. 3.
20
c
m
1.5 cm
500µM
20 cm
2 cm .
.
std
. . . .
. . .
3µL sample
1 cm 2 cm 2 cm
solvent
front
origin
Fig. 3. Neutral fraction was loading in the origin of TLC plate. The identification of compounds was by standard comparison (sucrose, glucose and fructose).
vacuum system was approximately 80%. When TLC spots were removed by conventional methods, i.e., scraping spots with a metal spatula or a razor blade, recoveries were approximately 40%.
Fig. 4. Development of TLC plates (panel A) to separate sucrose, glucose and fructose and visualization of carbohydrates (panel B) using a hot plate at maximum temperature for 2 min.
Fig. 6. Removal of spots from TLC plate and transfer to vials for scintillation counting.
2.6. Quantification of radioactivity
Radioactivity for all samples was quantified by liquid scintillation counting using a LS 6500 Multi-purpose Scintillation Counter (Beckman Coulter™, Fullerton, CA) and Bio Safe II liquid scintillation fluid (Research Products International Corp., Mount Prospect, Illinois).
2.7. Statistical analysis
3. RESULTS AND DISCUSSION
3.1. Preliminary test
Since protocols for radiolabelling sugarbeet root tissue are not available, a preliminary test was conducted to determine the effect of incubation time. The discs were incubated for 3 h and 5 h, using the methodology of Viola & Davies (1994). Incubation for 5 h increased the amount of labeling. However, glucose and fructose concentrations were elevated in discs incubated for 5 h relative to discs incubated for 3 h, suggesting that sucrolytic enzymes activities were induced when discs were incubated for the longer period (data not shown). It is known that acid invertase activity is induced when tissue discs are incubated in solution, with the increase in activity due to increased protein synthesis (Leigh et al., 1979).
3.2. Experiment 1: Effects of incubation time and protein synthesis inhibition