Submitted18 March 2016
Accepted 12 September 2016
Published20 October 2016
Corresponding authors
Haiyan Wei, [email protected] Wei Gu, [email protected]
Academic editor
Chiyuan Miao
Additional Information and Declarations can be found on page 17
DOI10.7717/peerj.2554 Copyright
2016 Guo et al.
Distributed under
Creative Commons CC-BY 4.0 OPEN ACCESS
Predictions of potential geographical
distribution and quality of
Schisandra
sphenanthera
under climate change
Yanlong Guo1,2,3, Haiyan Wei3, Chunyan Lu4, Bei Gao1,3and Wei Gu1,5 1National Engineering laboratory for Resource Development of Endangered Chinese Crude Drugs in
Northwest of China, Shaanxi Normal University, Xian, China
2Cold and Arid Regions Environmental and Engineering Research Institute, Chinese Academy of Sciences, Lanzhou, China
3College of Tourism and Environment, Shaanxi Normal University, Xian, China
4Fujian Agriculture and Forestry University, College of Computer and Information Sciences, Fuzhou, China 5College of Life Sciences, Shaanxi Normal University, Xian, China
ABSTRACT
Climate change will significantly affect plant distribution as well as the quality of medicinal plants. Although numerous studies have analyzed the effect of climate change on future habitats of plants through species distribution models (SDMs), few of them have incorporated the change of effective content of medicinal plants. Schisandra sphenantheraRehd. et Wils. is an endangered traditional Chinese medical plant which is mainly located in the Qinling Mountains. Combining fuzzy theory and a maximum entropy model, we obtained current spatial distribution of quality assessment for S. spenanthera. Moreover, the future quality and distribution ofS. spenantherawere also projected for the periods 2020s, 2050s and 2080s under three different climate change scenarios (SRES-A1B, SRES-A2 and SRES-B1 emission scenarios) described in the Special Report on Emissions Scenarios (SRES) of IPCC (Intergovernmental Panel on Climate Change). The results showed that the moderately suitable habitat of S. sphenanthera under all climate change scenarios remained relatively stable in the study area. The highly suitable habitat ofS. sphenantherawould gradually decrease in the future and a higher decline rate of the highly suitable habitat area would occur under climate change scenarios SRES-A1B and SRES-A2. The result suggested that in the study area, there would be no more highly suitable habitat areas forS. sphenanthera when the annual mean temperature exceeds 20◦
C or its annual precipitation exceeds 1,200 mm. Our results will be influential in the future ecological conservation and management ofS. sphenantheraand can be taken as a reference for habitat suitability assessment research for other medicinal plants.
SubjectsBiodiversity, Biogeography, Ecology, Environmental Sciences, Plant Science
Keywords Climate change, GIS, Medicinal plants, Fuzzy membership function,Schisandra
sphenanthera, Species distribution modeling
INTRODUCTION
Bystriakova, Peregrym & Dragicevic, 2015). Global warming is likely to change the structure and function of essential terrestrial ecosystems (Wu et al., 2010;Euskirchen, Carman & McGuire, 2014) by changing the range of habitats and the distribution area, which has strong effects on herb spatial patterns and can increase the risk of extinction among endangered plants (Bartholomeus et al., 2011;Li et al., 2013). Recent studies have focused on the potential impact of climate change on vegetation distribution and nature reserves (Araújo et al., 2011;Zhang et al., 2014) and have raised great concerns about the future of a range of animal and plant species (Araújo & Rahbek, 2006;Fan et al., 2014;Guo et al., 2014). Although there are an increasing number of studies on the effect of climate change on the spatial distribution of plant species, only a few of them refer to endangered geo-herbs, and studies about the impact of climate change on herb quality are even fewer. Medicinal plants play a very important role in health care, particularly in developing countries (Madaleno, 2010;Williamson et al., 2013). At present, many medicinal plant species are severely threatened by over exploitation, destructive harvesting, deforestation and habitat deterioration (Guo et al., 2014). The production and quality of medicinal plants are not only influenced by plant genetic characteristics but are also closely related to various environmental factors. Specific geographic spatial information about species is an important part of species conservation (Lu et al., 2012;Guo et al., 2013). This information is essential to addressing the many challenges facing species conservation, such as those induced by climate change, as well as other ecological or biological factors. It is also important for the domestication of wild species.
Schisandra sphenanthera(S. sphenanthera) is an important Chinese herbal medicine (Smith, 1947;Committee of Flora of China, 1996). Currently, it has been included in the Chinese Key Protected Wild Medicinal Species List, and it is considered to be a severely reduced resource among the major common species of wild medicinal herbs (Lu et al., 2012;Guo et al., 2013). Without enough knowledge about the habitat requirements of this species, species resource protection is improbable.
Models are essential tools to assess the potential response of vegetation to climate change, particularly if large spatial and temporal scales are considered (Araújo & Luoto, 2007;Austin & Van Niel, 2011;Adhikari, Barik & Upadhaya, 2012;Bean et al., 2014). SDMs are increasingly used to forecast the potential changes in species distributions under climate change scenarios. However, traditional SDMs can neither predict the change of plants’ medicinal component contents in different geographical conditions nor the potential response of plants’ medicinal component contents to climate change (Lu et al., 2012;
Guo et al., 2013).
system (GIS) spatial analysis. Researchers obtained the suitable range of each variable affecting plant growth and spatial distribution. By using this habitat-suitability assessment model and the same climatic data from three general circulation models (GCM) for three different climate change scenarios (Special Report On Emissions Scenarios, SRES) (SRES-A1B, SRES-A2 and SRES-B1 emission scenarios), the researchers predicted the potential geographic distribution ofS. sphenantherain the Qinling Mountains for the years 2020–2029 (2020s), 2050–2059 (2050s) and 2080–2089 (2080s). This information will supply construction and advice for the protection and sustainable utilization of resources, and provide some measures and proposals for the prediction of the distribution and quality of medicinal plants under climate change conditions.
MATERIALS AND METHODS
Study area and species dataIn this study, we selected the Qinling Mountains as our study area. The Qinling Mountains are one of the main producing areas of medicinal materials and plants. And this area also contains a large number of endangered geoherbs (Dang et al., 2010;Lu et al., 2012). Climate change will certainly affect the Qinling Mountains climate, which will inevitably affect the habitable environment and moisture and temperature conditions in the Qinling Mountains (Fan et al., 2014), thus affecting herb spatial patterns and quality in the region. According to the literature record of the distribution ofS. sphenantheraand studies on the range of the Qinling Mountains (Liu & Chen, 1986;Kang & Zhu, 2007), we defined the whole study area to encompass the Qinling Mountains (Fig. 1). Latitude in this area ranges from N30◦
30′
to N35◦ 30′
and longitude from E103◦ 45′
to E113◦ 45′
. It runs across six provinces (or municipalities) from the west to the east, including Gansu, Sichuan, Shaanxi, Chongqing, Hubei, and Henan, and it covers nearly 190,000 km2.
We collectedS. sphenantherasamples throughout the range of the Qinling Mountains from 2007–2011 (Fig. 1). We chose the reasonable sampling sites by considering the different environmental conditions in traditional and original producing area of S. sphenanthera. Meanwhile, to improve the sampling accuracy, the sampling points were distributed evenly. But because of the influence of human activities,S. sphenantherawild resources are being depleted, and some traditional areas where the plant could be found no longer host this species, at the same time in complex terrain, we are unable to obtain sample point data, so the spatial distribution of the sampling points in this study are not completely evenly distribution. At every sampling point, 10–20 plant samples had been collected, and to prevent cloning, the distance between samples was controlled more than 100 m. We used global positioning system (GPS) to record basic geographic information, including the longitude, latitude, altitude, slope and aspect. TheCommittee of National Pharmacopoeia (2010) has clearly defined that schisantherin A is a symbol component in the fruit of S. sphenanthera. Therefore, the content of schisantherin A in fruit of S. sphenanthera was chosen as the indicator, and it was tested by HPLC (Gu, Wei & Wang, 2008;
Figure 1 Study area and sampling sites distribution.a Huating, in Gansu; b Zhouqu, in Gansu; c Ningqiang, in Shaanxi; d Fengxian, in Shaanxi; e Longxian, in Shaanxi; f Liuba, in Shaanxi; g Maoping, in Shaanxi; h Foping, in Shaanxi; i Taibai, in Shaanxi; j Ningshan, in Shaanxi; k Yingpan, in Shaanxi; l Zhen’an, in Shaanxi; m Fengzhen, in Shaanxi; n Zhenping, in Shaanxi; o Xunyang, in Shaanxi; p Huaxian, in Shaanxi; q Qingchuan, in Sichuan; r Wuxi, in Chongqing; s Lushi, in Henan. 1 Lingchuan, in Shanxi; 2 Xiuwu, in Henan; 3 Jinzhai, in Anhui; 4 Lin’an, in Zhejiang.
Climatic variables, future scenarios and spatial conversion
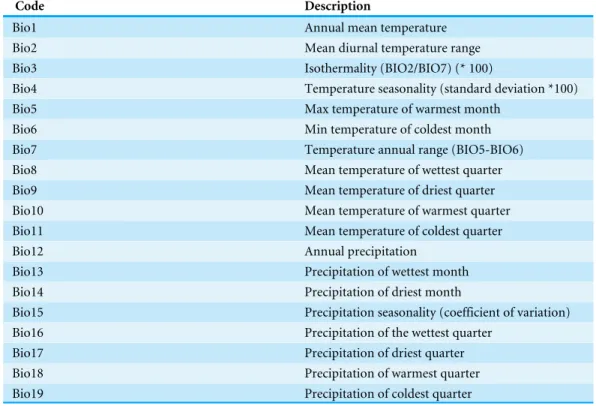
In order to work out the geographic distribution of suitable habitat of a target species, a set of characteristics about this species must be defined (Lu et al., 2012). In this study,we used 19 bioclimatic variables (Table 1) (Nix, 1986). And we obtained bioclimatic variables from the WorldClim database (www.worldclim.org/current). These variables were generated using averaged interpolated climate data during the period from 1950 to 2000 (Hijmans et al., 2005), and the resolution was 30’’ (about 1 km2).
Table 1 Explanatory variables used to model of the distribution forS. sphenanthera.
Code Description
Bio1 Annual mean temperature
Bio2 Mean diurnal temperature range
Bio3 Isothermality (BIO2/BIO7) (* 100)
Bio4 Temperature seasonality (standard deviation *100)
Bio5 Max temperature of warmest month
Bio6 Min temperature of coldest month
Bio7 Temperature annual range (BIO5-BIO6)
Bio8 Mean temperature of wettest quarter
Bio9 Mean temperature of driest quarter
Bio10 Mean temperature of warmest quarter
Bio11 Mean temperature of coldest quarter
Bio12 Annual precipitation
Bio13 Precipitation of wettest month
Bio14 Precipitation of driest month
Bio15 Precipitation seasonality (coefficient of variation)
Bio16 Precipitation of the wettest quarter
Bio17 Precipitation of driest quarter
Bio18 Precipitation of warmest quarter
Bio19 Precipitation of coldest quarter
(BC), CCCMA_CGCM3 (CC), and MIROC32_medres (MI), under for the SRES-A1B, SRES-A2 and SRES-B1 emission scenarios (IPCC, 2001).The SRES was a report by the IPCC which was published in 2000. The SRES was a set of emissions scenarios. It covers a wide range of the main driving forces of future emissions, from demographic to technological and economic developments (IPCC, 2001). SRES-A1B means a balanced across energy sources in future world. The SRES-A2 driven by economic growth although at regional scale, create a diversified political and social world and regionally oriented economic growth that is more fragmented and slower than that in other storylines. The SRES-B1 is undoubtedly the ‘‘greenest’’ of all projections, with high levels of environmental and social consciousness and a global sustained development (IPCC, 2001).
The bioclimatic variables for the future scenarios were from the IPCC Fourth Assessment Report (available from the International Centre for Tropical Agriculture:
http://ccafs-climate.org). This method assumes changes in climates only over large distances and the relationships between variables are maintained from the present towards the future (seehttp://ccafs-climate.org/for more details). Future climate variables also had a resolution of 30’’ (about 1 km2).
Modeling procedures and testing
Based on the selection criteria of the standardization method, perfect results could be obtained by using the membership function in the fuzzy mathematics (Lu et al., 2012;
between the content of schisantherin A and each factor was used to quantify the relation between habitat variables and habitat suitability. For each environmental variable, a suitability curve is defined that assigns every possible value of the variable a degree of suitability. The degree value ranges from 0 to 1. A value of 0 indicates that an attribute has complete non-membership (not suitable at all) in a fuzzy set, which means that under these environmental conditions,S. sphenantheracannot grow or cannot completely synthesize and accumulate schisantherin A. Meanwhile, a value of 1 indicates that an attribute has a complete membership (optimal suitable) in a fuzzy set, which means that under these environmental conditions, the synthesis and accumulation of schisantherin A inS.sphenantherais optimal, and the environment in this scenario is suitable for the growth ofS. sphenanthera. Grades between 0 and 1 imply that an attribute has partial of membership in a fuzzy set. (Rüger, Schlüter & Matthies, 2005;Mouton et al., 2011).
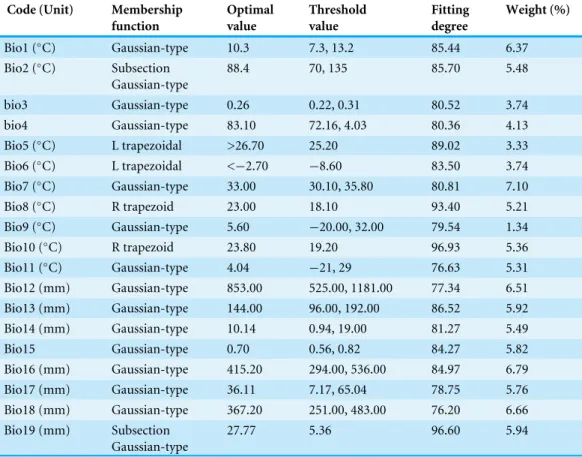
In this study, 75 % of the distribution points were selected at random as the training data set, and the remaining points were used as the test data set. Among various existing membership functions, the Gaussian membership function (Eq. (1)) and the Trapezoidal membership function (Eqs.(2)and(3)) were used to standardize each factor (Table 2) (Lahdelma, Salminen & Kuula, 2003). The error inspection of each factor to the membership function was computed by Matlab 2011 (MathWorks, 2011).
A(x)=e(−x −a
σ )2, −∞<x<∞ (1)
wherexis the independent variable, and a,σare parameters, in this definition whenx=a, the membership value is 1.
A(x)=
1, x<a b−x
x−a, a≤x≤b 0, b<x
(2) A(x)=
0, x<a x−a
b−a, a≤x≤b 1, b<x
(3)
Table 2 Membership functions of factors and its fitting degree. Code (Unit) Membership
function Optimal value Threshold value Fitting degree Weight (%)
Bio1 (◦C) Gaussian-type 10.3 7.3, 13.2 85.44 6.37
Bio2 (◦
C) Subsection Gaussian-type
88.4 70, 135 85.70 5.48
bio3 Gaussian-type 0.26 0.22, 0.31 80.52 3.74
bio4 Gaussian-type 83.10 72.16, 4.03 80.36 4.13
Bio5 (◦C) L trapezoidal >26.70 25.20 89.02 3.33
Bio6 (◦C) L trapezoidal <
−2.70 −8.60 83.50 3.74
Bio7 (◦
C) Gaussian-type 33.00 30.10, 35.80 80.81 7.10
Bio8 (◦C) R trapezoid 23.00 18.10 93.40 5.21
Bio9 (◦C) Gaussian-type 5.60
−20.00, 32.00 79.54 1.34
Bio10 (◦
C) R trapezoid 23.80 19.20 96.93 5.36
Bio11 (◦C) Gaussian-type 4.04 −21, 29 76.63 5.31
Bio12 (mm) Gaussian-type 853.00 525.00, 1181.00 77.34 6.51 Bio13 (mm) Gaussian-type 144.00 96.00, 192.00 86.52 5.92
Bio14 (mm) Gaussian-type 10.14 0.94, 19.00 81.27 5.49
Bio15 Gaussian-type 0.70 0.56, 0.82 84.27 5.82
Bio16 (mm) Gaussian-type 415.20 294.00, 536.00 84.97 6.79
Bio17 (mm) Gaussian-type 36.11 7.17, 65.04 78.75 5.76
Bio18 (mm) Gaussian-type 367.20 251.00, 483.00 76.20 6.66 Bio19 (mm) Subsection
Gaussian-type
27.77 5.36 96.60 5.94
space are identified. Additionally, it does not require much data, which are rarely available (Phillips, Anderson & Schapire, 2006) can produce solutions with a small set of observations (Weber, 2011).
Based on the MEM and the fuzzy mathematics, membership functions were calculated to obtain the values of all factors and units, while the weights were obtained from the MEM. Then, the weighted average method [Eq.(4)] was used to comprehensively assess the values ofS. sphenantheraecological suitability in the study area (Lu et al., 2012;Guo et al., 2013).
yi= n
X
j=1
wj×xij (4)
The root mean square error (RMSE) and determination coefficient (R-squared) were used to validate the results of the habitat suitability assessment for this plant. RMSE and R-squared were calculated as (Eq.(5)) (Willmott, 1984) and (Eq.(6)) (Magee, 1990):
RMSE=
r
1 N
XN
i=1(Pi−Qi) 2
(5)
R2=1−
PN
i=1(Qi−Pi)2
PN
i=1(Qi−Q)2
(6)
whereN is the number of samples,Pi is theith predicted value andQirepresents theith observed value and Qis the mean of the observed value. The smaller the RMSE is, the better the interpolation method (Li & Heap, 2011). R-squared summarize the discrepancy between observed values and their predicted values, the values of R-squared vary from 0 to 1. Meanwhile, to test the applicability of our model in other habitats besides the Qinling Mountains, 60 samples from four locations (Fig. 1, 1–4) were collected, and the data were assessed using the above mentioned habitat suitability assessment model.
Potential change in the distributions of species
We used the above mentioned model to study the potential changes in the distributions ofS. sphenanthera. The future scenarios were regionalized for the study area from three general circulation models (GCM) for the SRES-A1B, SRES-A2 and SRES-B1 (IPCC, 2001), and for the three time (2020s, 2050s and 2080s) periods. All operations were automated with a script made in python programming language and incorporated as a toolbox in ArcGIS 9.3 (Redlands, CA, USA).
RESULTS
The determination of the fuzzy membership functions
Figure 2 Habitat suitability comprehensive distribution ofS. sphenantherain Qinling area.
Distribution of suitable habitats in the current climate environment The Chinese Pharmacopoeia clearly states that the minimum content of schisantherin A in S.sphenantherafruit is 0.2 % (Committee of National Pharmacopoeia, 2010). In this study, the content of schisantherin A in the 307 samples was 0.015–1.948 %, we designated the content proportions of schisantherin A less than 0.2 % as unsuitable. According to the content of schisantherin A and the ecological suitability index calculated by our model, the habitat suitability ofS. sphenantherain the Qinling Mountains can be classified into four grades: unsuitable, marginally suitable, moderately suitable, and highly suitable (yi<0.3, unsuitable habitat; 0.3≤yi<0.5, marginally suitable habitat; 0.5≤yi<0.7, moderately suitable habitat; andyi≥0.7, highly suitable habitat). We have applied spatial analysis using ArcGIS 9.3 (Redlands, CA, USA) to draw the comprehensive distribution map of habitat suitability ofS.sphenantherain the Qinling area (Fig. 2), and we calculated the area of all of the habitat suitability grades. The results show that the proportions of unsuitable, marginally suitable, moderately suitable, and highly suitable habitats forS. sphenantherain the Qinling Mountains are 1.12 %, 11.76 %, 43.69 % and 43.43 %, respectively. The highly suitable habitats are mainly located in southern Shaanxi, eastern Gansu, western Henan, and northern Hubei province, and their surrounding areas, with an elevation of 800 to 2000 m.
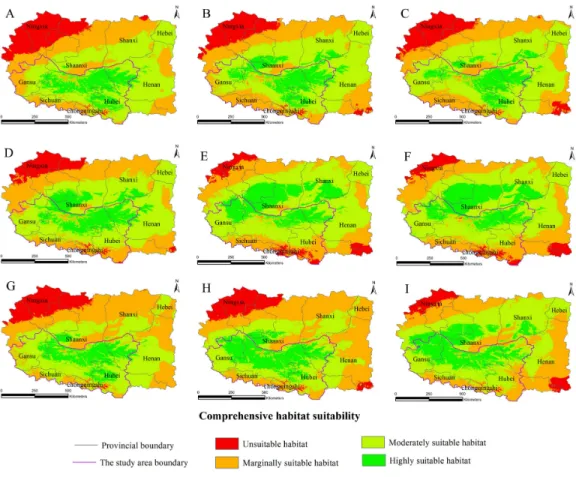
Figure 3 Distribution map of habitat acclimatization forS. sphenantherabased on three GCM in SRES-A1B. (A) 2020s in GCM of BC; (B) 2050s in GCM of BC; (C) 2080s in GCM of BC; (D) 2020s in GCM of CC; (E) 2050s in GCM of CC; (F) 2080s in GCM of CC; (G) 2020s in GCM of MI; (H) 2050s in GCM of MI; (I) 2080s in GCM of MI. Future scenarios were regionalized within the study area from the following general circulation models (GCM): BCCR-BCM2.0 (BC), CCCMA_CGCM3 (CC), and MIROC32_medres (MI).
Moreover, the RMSE is 0.075 and the R-squared is 0.68 for the data from the 60 sample sites outside of the Qinling Mountains district, which demonstrates that the model is applicable to other areas besides the Qinling Mountains.
Projecting the effects of climate change on the distribution and
qual-ity ofS. sphenanthera in the Qinling Mountains
The habitat suitability assessment model based on GIS and the fuzzy mathematics could be used to accurately determine the habitat suitability ofS. sphenantheraand to quantify the area of suitable habitat. Using it as a base, the future distributions ofS. sphenanthera in the 2020s, 2050s and 2080s under the climate change scenarios of SRES-A1B (Fig. 3), SRES-A2 (Fig. 4) and SRES-B1 (Fig. 5) from IPCC were projected. The SRES scenarios were constructed to explore future developments in the global environment with special reference to the production of greenhouse gases and aerosol precursor emissions, which is an important means of evaluating the future climate change.
Figure 4 Distribution map of habitat acclimatization forS. sphenantherabased on three GCM in SRES-A2.(A) 2020s in GCM of BC; (B) 2050s in GCM of BC; (C) 2080s in GCM of BC; (D) 2020s in GCM of CC; (E) 2050s in GCM of CC; (F) 2080s in GCM of CC; (G) 2020s in GCM of MI; (H) 2050s in GCM of MI; (I) 2080s in GCM of MI. Future scenarios were regionalized within the study area from the following general circulation models (GCM): BCCR-BCM2.0 (BC), CCCMA_CGCM3 (CC), and MIROC32_medres (MI).
Figure 5 Distribution map of habitat acclimatization forS. sphenantherabased on three GCM in SRES-B1. (A) 2020s in GCM of BC; (B) 2050s in GCM of BC; (C) 2080s in GCM of BC; (D) 2020s in GCM of CC; (E) 2050s in GCM of CC; (F) 2080s in GCM of CC; (G) 2020s in GCM of MI; (H) 2050s in GCM of MI; (I) 2080s in GCM of MI. Future scenarios were regionalized within the study area from the following general circulation models (GCM): BCCR-BCM2.0 (BC), CCCMA_CGCM3 (CC), and MIROC32_medres (MI).
Table 3 The correlation between Bio1, Bio 12 andS. sphenanthera’s different grades of habitat suit-ability in the studied area.
Code Unsuitable habitat
Marginally suitable habitat
Moderately suitable habitat
Highly suitable habitat
Bio1 .151 .380* .292 −.514**
Bio12 .326 .558** .051 −.598**
Notes.
*Correlation is significant at the 0.05 level (2-tailed),
**Correlation is significant at the 0.01 level (2-tailed).
Figure 7 Linear regression analysis of Bio1, Bio12 and its corresponding percentage of highly suitable habitats ofS. sphenanthera.(A) Bio1 (Annual mean temperature); (B) Bio12 (Annual precipitation).
Climate change will significantly affect plant distribution. With the support of the ArcGIS 9.3 (Redlands, CA, USA) platform, we carried out statistics that can represent the future climate data in the model operations. To explore the relationships between climatic change and the distribution ofS. sphenanthera, SPSS 19.0 software (IBM, Armonk, North Castle, NY, USA) was used to determine the correlations between Bio1 (annual mean temperature), Bio12 (annual precipitation) and the area proportion of the four habitat types ofS. sphenantherain the studied area.Table 3shows that Bio1, Bio12 and the area of highly suitable habitat have a significant negative correlation. As Bio1 and Bio12 increased, the highly suitable habitat area gradually decreased. To further explore this quantitative relation and future change trend, we performed linear regression analysis (Fig. 7). The results indicate that when Bio1 of the studied area exceeds 20◦
C and Bio12 exceeds 1200 mm, the study area will no longer have highly suitable habitat areas forS. sphenanthera. The result showed that climate change will affect the distribution and quality ofS. sphenanthera, which will further increase the rate of this species’ extinction.
DISCUSSION
records associated with environmental variables to determine the essential environmental requirements of a particular species. The suitability evaluation model was integrated with the GIS software ArcGIS, which could quickly provide evaluation results after inputting the parameters of the model. Fuzzy theory was widely used in ecological environment modeling (Rocchini, 2014;Mouton et al., 2011), and how to determine membership function is a crux of this theory. Usually, the parameters of fuzzy membership functions were calculated based on the expert knowledge (Zhu et al., 2010;Wang, Hong & Tseng, 2000). But in this study, to make sure the consistency between the sampling data and the bioclimatic data, we extract bioclimatic variables values by sampling sites, and then get the bioclimatic data sequence for model training. Finally, using this data, the fuzzy membership function was defined, which include the information on relationship between the value of 19 climatic variables and schisantherin A content ofS. sphenantherasamples. This method can standardize variables with no prior knowledge as well as retain information about the original data. There are many methods for determining the weight of factors, such as the Delphi (Lehtonen & Tykkyläinen, 2014), AHP (Houshyara et al., 2014) and principal component analysis (Alfaro et al., 2014). The methods such as Delphi and AHP need priori knowledge or additional expertise, butS. sphenantherais a wildlife species, and is lacking sufficient expert knowledge and conventional established definitions. For principal component analysis, to get reasonable results, the model requires a lot of data, so it is not suitable for this research. MEM is an objective approach using information provided by the observation data to determine the weight of climatic variables. It can objectively evaluate the habitat suitability and eliminate subjective influence. MEM emphasizes the influence of strongly restrictive factors on targets. Moreover it determines the dominant influencing factor of schisantherin A.
through this method we can obtain suitable range of each factor for medical plant, and this information is significant for wildlife protection. Finally, this method does not require large amounts of data, and gives a satisfactory result.
The reasonability of the bioclimatic variables
Bioclimatic variables are derived from the monthly temperature and rainfall values in order to generate more biologically meaningful variables. These variables were created by the thin-plate smoothing spline algorithm implemented for interpolation, using latitude, longitude, and elevation as independent variables, and the uncertainty arising from the input data and the interpolation was quantified by mapping weather station density, elevation bias in the weather stations, and elevation variation within grid cells and through data partitioning and cross validation. All of this guarantees the accuracy of the bioclimatic data (Hijmans et al., 2005). Furthermore, those data had been proven to be useful for SDMs; at the same time, it’s also one of the most widely used data (Rödder & Lötters, 2009).
Previous researches indicated that temperature and the moisture factor (especially in spring and autumn) are the main climate factors which control the growth of plants (Trisurat, Shrestha & Kjelgren, 2011). Only under the circumstances of appropriate temperatures and sufficient water can plants have normal growth and accumulate particular organics.S. sphenantherais a woody vine, supporting itself on rocks, shrubs, and trees in broad-leaved evergreen forests or coniferous mixed forests (Committee of Flora of China, 1996). On the base of phenological observation, we have a preliminary understanding of the mechanism of theS. spenanthera. InS. sphenantheragrowth process, the period of sap flow begin in early March, and the sprout leaves period is from late March to mid-April, in this period, low temperature or low rainfall will kill the buds or delay sprout leaves period. In late AprilS. spenantherabegin to blossom, and the blossom and young fruit period continue to end of June, at the same time it’s also a peak-growth period. The developing fruit period is begin in early July, and the fruit ripe period begin in early August, then its followed by abscission period which last from October to November, and from July to September is the warmest quarter in study area and usually, the wettest month also happen in this three months, it is the key period for generation and accumulation of schisantherin A. Therefore, in the whole growth period, suitable temperature and precipitation is significant forS. sphenanthera. The bioclimatic variables represent annual trends, seasonality, and extreme or limiting temperature and precipitation factors in plant life history, so they are sufficient for this research.
Bio1 (annual mean temperature). The weight of each of these features is higher than 6 %. Our results are therefore somewhat similar with those ofLu et al. (2012)andHu et al. (2012).
The effects of climate change on the highly suitable habitat of
S. sphenanthera
Over time, a new suitable habitat forS.sphenantherawould be generated while its normally suitable habitat would be lost. To show this change, we expanded the areas around the studied area to generate the future suitable habitat ofS. sphenanthera. The highly suitable habitat ofS. sphenantheraunder the climate change scenarios of SRES-A1B and SRES-A2 was shifted to the north and gradually reduced (Figs. 3and4). By the 2020s, the highly suitable habitat area in eastern Gansu would be significantly reduced. The same situation would occur in Shaanxi, Hubei and Henan provinces with habitat fragmentation in the study area (Figs. 3A, 3D,3G,4A, 4Dand4G). By the 2050s, there would be a highly suitable habitat in the east of Gansu, which is located in the north of the studied area. There was little or almost no highly suitable habitat in Hubei. The highly suitable habitats ofS. sphenantherawould continue to reduce in Shaanxi and Henan, with further habitat fragmentation occurring in the study area. In the meantime, outside of the studied area, new highly suitable habitats are likely to appear in northern Gansu, central Shaanxi and central Shanxi (Figs. 3B,3E,3H,4B,4Eand4H). By the 2080s, in the study area, the highly suitable habitat ofS. sphenantherawould fall sharply and only a little area in parts of southern Shaanxi and west Henan would remain. However, outside of the study area in northern Gansu, central Shaanxi and central Shanxi, new highly suitable habitat areas would be further expanded, leading to a new distribution area of S. sphenanthera (Figs. 3C,3F,3I,4C,4Fand4I).
The other factors which affect the distribution ofS. sphenanthera
If all factors were considered, we can deduce that in the study area, the suitable habitat of S. sphenantheraunder the climate change scenarios would reduce by a larger range, and new suitable habitat range will be smaller.
CONCLUSIONS
Medicinal plants represent a significant contribution to human health, and with the continuous development of global warming, some of wild medicinal plants would change their distribution patterns as well as quality. This study provided a new case for that theory. Firstly, samples of wild herb plantS. sphenantherawere collected form field work in Qinling Mountains, and the content of schisantherin A in the fruit were examined by HPLC, then with this data combining fuzzy theory and a maximum entropy model, we developed a method to project the spatial assessment of medicinal plants quality, and used this model we predict future quality and distribution ofS. spenantherain Qinling Mountains. The result showed that under future climate scenarios, the habitats of high qualityS. sphenantherawill continue to decrease and draw near to extinction. As the prediction of species distribution is influenced by multiple factors, this study predicted the effects of climate change on the distribution and quality of medicinal plants. Further research is required, and the present study only provides a reference for related research and native habitat protection.
ADDITIONAL INFORMATION AND DECLARATIONS
Funding
This work is supported by the National Natural Science Foundation of China (No.31070293), the National Eleventh-Five Year Science and Technology Support Program from Ministry of Science and the Technology of the People’s Republic of China (No.2006BAI06A13-06). The funders had no role in study design, data collection and analysis, decision to publish, or preparation of the manuscript.
Grant Disclosures
The following grant information was disclosed by the authors: National Natural Science Foundation of China: No.31070293.
Ministry of Science and the Technology of the People’s Republic of China: No.2006BAI06A13-06.
Competing Interests
The authors declare there are no competing interests
Author Contributions
• Yanlong Guo conceived and designed the experiments, performed the experiments,
analyzed the data, contributed reagents/materials/analysis tools, wrote the paper, prepared figures and/or tables, reviewed drafts of the paper.
• Haiyan Wei conceived and designed the experiments, performed the experiments,
• Chunyan Lu reviewed drafts of the paper, have made great contributions to revision.
• Bei Gao analyzed the data, contributed reagents/materials/analysis tools, prepared figures
and/or tables, reviewed drafts of the paper.
• Wei Gu conceived and designed the experiments, performed the experiments,
contributed reagents/materials/analysis tools, reviewed drafts of the paper.
Data Availability
The following information was supplied regarding data availability: The raw data has been supplied as aSupplemental File.
Supplemental Information
Supplemental information for this article can be found online athttp://dx.doi.org/10.7717/ peerj.2554#supplemental-information.
REFERENCES
Adhikari D, Barik SK, Upadhaya K. 2012.Habitat distribution modelling for reintroduc-tion of Ilex khasiana Purk., a critically endangered tree species of northeastern India. Ecological Engineering 40:37–43DOI 10.1016/j.ecoleng.2011.12.004.
Alfaro CA, Aydin B, Valencia CE, Bullitt E, Ladha A. 2014.Dimension reduction in principal component analysis for trees.Computational Statistics and Data Analysis
74:157–179DOI 10.1016/j.csda.2013.12.007.
Araújo MB, Alagador D, Cabeza M, Nogués-Bravo D, Thuiller W. 2011.Climate change threatens European conservation areas.Ecology Letters14:484–492
DOI 10.1111/j.1461-0248.2011.01610.x.
Araújo MB, Luoto M. 2007.The importance of biotic interactions for modelling species distributions under climate change.Global Ecology and Biogeography 16:743–753
DOI 10.1111/j.1466-8238.2007.00359.x.
Araújo MB, Rahbek C. 2006.How does climate change affect biodiversity?Science
313:1396–1397DOI 10.1126/science.1131758.
Austin MP, Van Niel KP. 2011.Improving species distribution models for climate change studies: variable selection and scale.Journal of Biogeography38:1–8
DOI 10.1111/j.1365-2699.2010.02416.x.
Bartholomeus RP, Witte JPM, Van Bodegom PM, Van Dam JC, Aerts R. 2011.Climate change threatens endangered plant species by stronger and interacting water-related stresses.Journal of Geophysical Research Atmospheres116(G4):116–120
DOI 10.1029/2011JG001693.
Bean WT, Prugh LR, Stafford R, Butterfield HS, Westphal M, Brashares JS. 2014.
Species distribution models of an endangered rodent offer conflicting measures of habitat quality at multiple scales.Journal of Applied Ecology51:1116–1125
DOI 10.1111/1365-2664.12281.
Bystriakova N, Peregrym M, Dragicevic S. 2015.Effect of environment on distributions of rock ferns in the mediterranean climate: the case of the genus asplenium in montenegro.Flora - Morphology Distribution Functional Ecology of Plants215:84–91
DOI 10.1016/j.flora.2015.07.003.
Committee of Flora of China. 1996.Flora of China. vol.30. Beijing: Science Press, pp. 231–269 (in Chinese).
Committee of National Pharmacopoeia. 2010.Pharmacopoeia of the People’s Republic of China. vol. 1. Beijing: China Medical Science Press, pp. 227–228 (in Chinese).
Dang H, Zhang Y, Zhang K, Jiang M, Zhang Q. 2010.Age structure and regen-eration of subalpine fir (Abies fargesii) forests across an altitudinal range in the Qinling Mountains, China.Forest Ecology & Management 259:547–554
DOI 10.1016/j.foreco.2009.11.011.
Euskirchen ES, Carman TB, McGuire AD. 2014.Changes in the structure and func-tion of northern Alaskan ecosystems when considering variable leaf-out times across groupings of species in a dynamic vegetation model.Global Change Biology
20:963–978DOI 10.1111/gcb.12392.
Fan J, Li J, Xia R, Hu L, Wu X, Li G. 2014.Assessing the impact of climate change on the habitat distribution of the giant panda in the Qinling Mountains of China.Ecological Modelling 274:12–20DOI 10.1016/j.ecolmodel.2013.11.023.
Gu W, Wei NY, Wang ZZ. 2008.LC analysis of lignans fromSchisandra sphenanthera Rehd. et Wils.Chromatographia67:979–983DOI 10.1365/s10337-008-0621-7.
Guo YL, Gu W, Lu CY, Wei HY. 2013.Deoxyschizandrin andγ-schizandrin con-tent in wildSchisandra sphenantherato determine potential distribution in the Qinling Mountains.Chinese Bulletin of Botany48:411–422 (in Chinese)
DOI 10.3724/SP.J.1259.2013.00411.
Guo YL, Wei HY, Lu CY, Zhang HL, Gu W. 2014.Predictions of potential geographical distribution ofSinopodophyllum hexandrumunder climate change.Chinese Journal of Plant Ecology 38:249–261 (in Chinese)DOI 10.3724/SP.J.1258.2014.00022.
Hijmans RJ, Cameron SE, Parra JL, Jones PG, Jarvis A. 2005.Very high resolution in-terpolated climate surfaces for global land areas.International Journal of Climatology
25:1965–1978DOI 10.1002/joc.1276.
Houshyara E, Javad SheikhDavoodi M, Almassi M, Almassia M, Bahramia H, Azadib H, Omidic M, Sayyadd G, Witlox F. 2014.Silage corn production in conventional and conservation tillage systems. Part I: sustainability analysis using combina-tion of GIS/AHP and multi-fuzzy modeling.Ecological Indicators39:102–114
DOI 10.1016/j.ecolind.2013.12.002.
Hu LL, Zhang HY, Qin L, Yan BQ. 2012.Current distribution ofSchisandra chinensis in China and its predicted responses to climate change.Chinese Journal of Applied Ecology 23:2445–2450 (in Chinese).
IPCC. 2001.Emission scenarios: a special report of working group III of the intergovernmen-tal panel on climate change. Cambridge: Cambridge University Press, pp. 595–600.
Lahdelma R, Salminen P, Kuula M. 2003.Testing the efficiency of two pairwise compar-ison methods in discrete multiple criteria problems.European Journal of Operational Research145:496–508 DOI 10.1016/S0377-2217(02)00214-X.
Lehtonen O, Tykkyläinen M. 2014.Delphi path simulator for unveiling development opportunities in the forest industries by contrasting forest management practices-the case of North Karelia.Technological Forecasting & Social Change84:171–185
DOI 10.1016/j.techfore.2013.08.005.
Lenoir J, Gégout JC, Marquet PA, De Ruffray P, Brisse H. 2008.A significant up-ward shift in plant species optimum elevation during the 20th century.Science
320:1768–1771DOI 10.1126/science.1156831.
Li J, Heap AD. 2011.A review of comparative studies of spatial interpolation methods in environmental sciences: performance and impact factors.Ecological Informatics
6:228–241DOI 10.1016/j.ecoinf.2010.12.003.
Li X, Tian H, Wang Y, Li R, Song Z, Zhang F, Xu M, Li D. 2013.Vulnerability of 208 endemic or endangered species in China to the effects of climate change.Regional Environmental Change13:843–852DOI 10.1007/s10113-012-0344-z.
Liu JD, Chen YW. 1986.New geography of China. Shanghai: Shanghai People’s Press, pp. 26–27 (in Chinese).
Lu CY, Gu W, Dai AH, Wei HY. 2012.Assessing habitat suitability based on geographic infomation system (GIS) and fuzzy: a case study ofSchisandra sphenanthera Rehd. et Wils. in Qinling Mountains, China.Ecological Modelling 242:105–115
DOI 10.1016/j.ecolmodel.2012.06.002.
Madaleno IM. 2010.Traditional uses of organic medicinal plant species. In XXVIII inter-national horticultural congress on science and horticulture for people (IHC2010): a new look at medicinal and aromatic plants seminar.ISHS Acta Horticulturae
925:321–326.
Magee L. 1990.R2measures based on Wald and likelihood ratio joint significance tests.
American Statistician44(3):250–253DOI 10.2307/2685352.
MathWorks. 2011.MATLAB 2011a. USA: MathWorks, Inc.
Mouton AM, Alcaraz-Hernández JD, De Baets B, Goethals PLM, Martínez-Capel F. 2011.Data-driven fuzzy habitat suitability models for brown trout in Span-ish Mediterranean rivers.Environmental Modelling & Software 26:615–622
DOI 10.1016/j.envsoft.2010.12.001.
Nix HA. 1986. A biogeographic analysis of Australian elapid snakes. In: Longmore R, ed.Atlas of Elapid Snakes of Australia. Canberra: Australian Government Publishing Service, 4–15.
Parmesan C, Yohe G. 2003.A globally coherent fingerprint of climate change impacts across natural systems.Nature421:37–42DOI 10.1038/nature01286.
Phillips SJ, Anderson RP, Schapire RE. 2006.Maximum entropy modeling of species ge-ographic distributions.Ecological Modelling 190:231–259
DOI 10.1016/j.ecolmodel.2005.03.026.
Root TL, Price JT, Hall KR, Schneider SH, Rosenzweig C, Pounds JA. 2003. Fin-gerprints of global warming on wild animals and plants.Nature421:57–60
DOI 10.1038/nature01333.
Rödder D, Lötters S. 2009.Niche shift versus niche conservatism? Climatic char-acteristics of the native and invasive ranges of the Mediterranean house gecko (Hemidactylus turcicus).Global Ecology and Biogeography 18(4):674–687
DOI 10.1111/j.1466-8238.2009.00477.x.
Rüger N, Schlüter M, Matthies M. 2005.A fuzzy habitat suitability index forPopulus euphraticain the Northern Amudarya delta (Uzbekistan).Ecological Modelling
184:313–328DOI 10.1016/j.ecolmodel.2004.10.010.
Smith AC. 1947.The families Illiciaceae and Schisandraceae.Sargentia7:1–244.
Trisurat Y, Shrestha RP, Kjelgren R. 2011.Plant species vulnerability to climate change in Peninsular Thailand.Applied Geography31:1106–1114
DOI 10.1016/j.apgeog.2011.02.007.
Wang CH, Hong TP, Tseng SS. 2000.Integrating membership functions and fuzzy rule sets from multiple knowledge sources.Fuzzy Sets & Systems112(1):141–154
DOI 10.1016/S0165-0114(97)00385-0.
Weber TC. 2011.Maximum entropy modeling of mature hardwood forest distribution in four US states.Forest Ecology & Management 261:779–788
DOI 10.1016/j.foreco.2010.12.009.
Williamson EM, Lorenc A, Booker A, Robinso N. 2013. The rise of traditional Chinese medicine and its materia medica: a comparison of the frequency and safety of materials and species used in Europe and China.Journal of Ethnopharmacology
149:453–462DOI 10.1016/j.jep.2013.06.050.
Willmott CJ. 1984. On the evaluation of model performance in physical geography. In: Gaile GL, Willmott CJ, eds.Spatial Statistics and Models. Boston: D. Reidel Publishing Company, 443–460.
Wu S, Yin Y, Zhao D, Huang M, Shao X, Dai E. 2010.Impact of future climate change on terrestrial ecosystems in China.International Journal of Climatology30:866–873
DOI 10.1002/joc.1938.
Zhang MG, Zhou ZK, Chen WY, Cannon CH, Raes N, Slik JW. 2014.Major declines of woody plant species ranges under climate change in Yunnan, China.Diversity & Distributions20:405–415DOI 10.1111/ddi.12165.
Zhu AX, Yang L, Li BL, Qin CZ, Pei T, Liu BY. 2010.Construction of membership functions for predictive soil mapping under fuzzy logic.Geoderma155:164–174