Evidence for a Shared Mechanism in the
Formation of Urea-Induced Kinetic and
Equilibrium Intermediates of Horse
Apomyoglobin from Ultrarapid Mixing
Experiments
Takuya Mizukami¤, Yukiko Abe, Kosuke Maki*
Graduate School of Science, Nagoya University, Nagoya, Aichi, Japan
¤ Current address: Fox Chase Cancer Center, Philadelphia, Pennsylvania, United States of America *[email protected]
Abstract
In this study, the equivalence of the kinetic mechanisms of the formation of urea-induced kinetic folding intermediates and non-native equilibrium states was investigated in apomyo-globin. Despite having similar structural properties, equilibrium and kinetic intermediates accumulate under different conditions and via different mechanisms, and it remains
unknown whether their formation involves shared or distinct kinetic mechanisms. To investi-gate the potential mechanisms of formation, the refolding and unfolding kinetics of horse apomyoglobin were measured by continuous- and stopped-flow fluorescence over a time range from approximately 100μs to 10 s, along with equilibrium unfolding transitions, as a function of urea concentration at pH 6.0 and 8°C. The formation of a kinetic intermediate was observed over a wider range of urea concentrations (0–2.2 M) than the formation of the
native state (0–1.6 M). Additionally, the kinetic intermediate remained populated as the
pre-dominant equilibrium state under conditions where the native and unfolded states were unstable (at ~0.7–2 M urea). A continuous shift from the kinetic to the equilibrium
intermedi-ate was observed as urea concentrations increased from 0 M to ~2 M, which indicintermedi-ates that these states share a common kinetic folding mechanism. This finding supports the conclu-sion that these intermediates are equivalent. Our results in turn suggest that the regions of the protein that resist denaturant perturbations form during the earlier stages of folding, which further supports the structural equivalence of transient and equilibrium intermediates. An additional folding intermediate accumulated within ~140μs of refolding and an unfolding intermediate accumulated in<1 ms of unfolding. Finally, by using quantitative modeling, we showed that a five-state sequential scheme appropriately describes the folding mechanism of horse apomyoglobin.
a11111
OPEN ACCESS
Citation:Mizukami T, Abe Y, Maki K (2015) Evidence for a Shared Mechanism in the Formation of Urea-Induced Kinetic and Equilibrium Intermediates of Horse Apomyoglobin from Ultrarapid Mixing Experiments. PLoS ONE 10(8): e0134238. doi:10.1371/journal.pone.0134238
Editor:Ligia O Martins, Universidade Nova de Lisboa, PORTUGAL
Received:March 31, 2015
Accepted:July 7, 2015
Published:August 5, 2015
Copyright:© 2015 Mizukami et al. This is an open access article distributed under the terms of the
Creative Commons Attribution License, which permits unrestricted use, distribution, and reproduction in any medium, provided the original author and source are credited.
Data Availability Statement:All relevant data are within the paper and its Supporting Information files.
Introduction
Kinetic intermediates are often observed during the folding of proteins with more than ~100 amino acid residues. Early kinetic intermediates are usually characterized as compact, partially folded states containing native-like secondary structures, and may even exhibit specific tertiary interactions for some side-chain pairs. Based on their native-like features, it has been suggested that kinetic intermediates represent productive states playing an important role in guiding
unstructured polypeptide chains to fold into specific native structures [1,2]. A complete
under-standing of protein folding requires detailed characterization of the early folding intermediates, which initially eluded investigation, due to the limited time resolution of conventional kinetic techniques, such as stopped-flow (SF) methods.
Under moderately denaturing conditions, some proteins accumulate equilibrium
intermedi-ates that are structurally and thermodynamically similar to kinetic intermediintermedi-ates [1]. These
equilibrium states have been investigated as potential analogues of short-lived kinetic
interme-diates in order to overcome the difficulty in characterizing the latter in detail [3–11]. This
made it possible to elucidate properties of equilibrium intermediates such as topology (fold)
[12] and structural cooperativity [13,14], which would be difficult to determine by kinetic
experiments alone. However, these properties can be used for describing folding mechanisms only if the equilibrium states are truly equivalent to kinetic intermediates. Even if equilibrium and kinetic intermediates have similar structural properties, which has been shown for several proteins, they generally accumulate under different conditions, and may form by different kinetic mechanisms. Typically, kinetic folding intermediates accumulate transiently under strongly native conditions, whereas non-native equilibrium intermediates tend to be populated under moderately denaturing conditions, including conditions that do not favor folding, such
as high salt concentrations at low pH [1,2]. Therefore, it is crucial to investigate whether the
two types of intermediates share the same kinetic folding mechanism and why intermediates are often structurally similar despite differences in manner and conditions of their accumula-tion. Recent advances in experimental techniques, such as laser-induced temperature jump and continuous-flow (CF) methods, have extended the time resolution of kinetic measurements
into the nanosecond to microsecond range [15–18]. There are, however, only a few studies in
which the equivalence of transient and stable intermediates has been confirmed by directly fol-lowing the kinetics of their formation.
Apomyoglobin (apoMb) is an excellent model protein for investigating these questions because the properties of kinetic and equilibrium intermediates and folding mechanisms have
been studied extensively [19,20]. Myoglobin is a heme protein with 153 amino acid residues
consisting of eight helices (A–H) that adopt a globin fold [21]. Early studies found that the
pro-tein exhibits fully native properties without heme, but is slightly less compact and more
disor-dered than the holo form [22–24]. ApoMb, which lacks a heme group, accumulates
equilibrium unfolding intermediates under various moderately denaturing conditions [25–27],
including acidic conditions in the presence of salt [28,29]. Equilibrium unfolding experiments
on sperm whale apomyoglobin (sw-apoMb) indicated that the pH/urea-induced intermediate
was approximated by a single thermodynamic state [30]. In addition, there was no clear
transi-tion between the salt-induced and pH-induced intermediates for horse skeletal muscle apo-myoglobin (h-apoMb), which suggests that a detectable thermodynamic barrier does not exist
between them [28]. Further structural characterization revealed that the intermediate at pH 4
(hereafter known as "the pH 4 intermediate") is compact with a structural core consisting of a
native-like helical structure in the A-, G-, H-, and part of the B-helix regions [31–34]; however,
under physiological conditions, it forms a compact, native structure similar to that of native
myoglobin, with the F-helix, the N-terminus of the G-helix, and some loops unstructured (Fig
1) [35,36]. In contrast, the acid unfolded state at pH 2.3 was reported to be highly flexible with residual helical structures in the A-, H-, and D- to N-terminus of the E-helix regions in
dynamic equilibrium with the unfolded state [33,37,38], which is consistent with previous
stud-ies of peptide fragments [39–41]. In another study, the addition of 8 M urea to the solution at
pH 2.3 further denatured the protein with virtually no residual structures [42]. The folding
kinetics of sw-apoMb was studied by pulsed hydrogen/deuterium (H/D) exchange experi-ments, and these revealed that helical structure is formed in the A-, G-, H-, and part of the B-helices of the native structure on a millisecond-to-second time scale during the folding reaction
at pH 6.1 [6]. The intermediate ensemble has a hydrophobic core surrounded by native-like
secondary structures with specific interactions between side-chains [43,44]. Further kinetic
studies of folding indicated that sw-apoMb follows a sequential folding pathway [45] and
accu-mulates at least two kinetic intermediates [46,47]. H-apoMb also folds via two kinetic
interme-diates with a compact size and considerable fraction of helical structure on a
submillisecond-to-second time scale [48]. A submillisecond pulsed H/D exchange experiment with sw-apoMb
revealed that a compact intermediate is formed with a helical structure in the A-, G-, and
H-helix regions within 0.4 ms of the refolding [5]. The effects of protonation and temperature on
the denaturation of apoMb and myoglobin were also investigated in previous simulation
stud-ies [49–51]. Although the solution conditions in which the equilibrium intermediate
accumu-lates are far from native conditions, i.e., the conditions where kinetic intermediates transiently accumulate, the equilibrium and kinetic states exhibit similar structural properties (e.g.,
spec-troscopic properties and patterns of amide protection in H/D exchange) [5–7]. If they are
equivalent, the kinetic and equilibrium intermediates should share a common kinetic
Fig 1. Ribbon diagram of horse skeletal muscle myoglobin on a crystallographic structure (PDB: 1AZI).The heme group (light gray) and two tryptophanyl side chains (black) are shown in the ball-and-stick model. The native state of myoglobin contains eight helices (A–H), whereas the native state of h-apoMb
contains seven helices (A–E, G, and H; black and gray). The intermediate of apoMb exhibits a helical
structure in the A-, G-, and H-helix regions (black). The F-helix is shown in light gray. The figure was prepared using PyMol (DeLano Scientific).
mechanism of formation. Although the rate-limiting step of the pH-induced folding reactions of sw-apoMb from kinetic and equilibrium intermediates was found to be similar by
compar-ing their refoldcompar-ing kinetics initiated at pH 2.2, 3.4, and 4.2 [46], conventional kinetic
measure-ments were too slow for a direct comparison of the kinetics of formation of transient and equilibrium intermediates.
Here, we aimed to address these issues by systematically investigating the refolding/unfold-ing kinetics and equilibrium unfoldrefolding/unfold-ing induced by urea in h-apoMb. By usrefolding/unfold-ing fluorescence-detected CF and SF measurements, we directly observed the formation of intermediates as kinetic phases in the refolding and unfolding reactions over a range of urea concentrations, while observing the burst phase intermediates formed within the dead-time of the CF refolding experiment. The results indicated that at least five states, including the native and unfolded states, are associated with the refolding/unfolding reactions of h-apoMb. Using quantitative
modeling, the protein’s folding behavior can be fully described by a five-state sequential
scheme. The results indicated that transient and equilibrium intermediates of h-apoMb are formed by a shared kinetic mechanism (although they accumulate under distinct conditions) and that the transient intermediate is converted into a non-native equilibrium state as urea concentrations increase. This study is complimentary to a recent study on the structure
forma-tion and unfolding of the intermediates of sw-apoMb at pH 4.0 [52].
Materials and Methods
Chemicals
Horse skeletal muscle myoglobin was purchased from Sigma (St. Louis, MO), and a specially prepared reagent grade urea for biochemical use was purchased from Nakalai Tesque Inc. (Kyoto, Japan). All other chemicals were either specially prepared or guaranteed reagent-grade chemicals. An Atago 3T refractometer was used to determine the concentration of urea with a refractive index of 589 nm. H-apoMb was prepared by removing the heme from myoglobin
according to the methods of Teale and Uzawaet al. [48,53]. All appropriate solutions were
fil-tered by using a membrane filter (pore size of 0.20 or 0.45μm) before they were used in the
experiments.
Equilibrium fluorescence and circular dichroism measurements and
fitting
For fluorescence and circular dichroism (CD) measurements, sample solutions were prepared at pH 6.0, 4.0, and 2.0 as follows. An acid-unfolded protein solution (in HCl at pH 2.0) was passed through a Sephadex G-25 column (PD-10; GE Healthcare) equilibrated with 12 mM sodium citrate at pH 6.0. Sample solutions at pH 6.0 and 4.0 containing various concentrations
of urea (0–8.0 M) were prepared by six-fold dilution of the protein stock solution, resulting in a
12 mM sodium citrate buffer containing an appropriate concentration of urea. To prepare the sample solution at pH 2.0, the stock solution (in HCl at pH 2.0) passed through the Sephadex G-25 column was diluted with HCl at pH 2.0. The protein concentration for the fluorescence
and CD measurements was 5μM. Fluorescence emission spectra from 300 nm to 450 nm were
recorded on a Jasco FP-777 spectrofluorometer (Tokyo, Japan) using an excitation wavelength of 295 nm at 8°C using circulating water. Equilibrium CD measurements were performed
using a Jasco J-600S spectropolarimeter (Tokyo, Japan) with a Peltier device at 0–20°C, and the
path length of the sample cuvettes was 1.0 mm. The equilibrium unfolding transition curves
were fitted to a three-state model by non-linear least squares fitting [54–56] via a global fitting
calculated by using the ellipticity values at 222 nm according to Chenet al., Sabelkoet al., and
Dasmeh and Kepp [51,57,58].
Kinetic measurements and fitting
For CF measurements, the refolding reactions were initiated by two-fold dilution of the acid-unfolded protein solution (in HCl at pH 2.0) with 24 mM sodium citrate containing appropri-ate concentrations of urea to give a final pH of 6.0 whereas the unfolding reactions were initi-ated by two-fold dilution of the protein solution (in 12 mM sodium citrate at pH 6.0) with 12 mM sodium citrate (pH 6.0) containing appropriate urea concentrations. The final
condi-tion for CF measurements was 20–40μM h-apoMb/12 mM sodium citrate/0–4.1 M urea at
pH 6.0. For SF measurements, the refolding reactions were initiated by six-fold dilution of the protein solution in HCl at pH 2.0 and in 0.8 M urea/12 mM sodium citrate at pH 6.0 with refolding buffer containing 14.4 mM and 12 mM sodium citrate, respectively, and appropriate concentrations of urea. The unfolding reactions were initiated by six-fold dilution of the pro-tein solution in 12 mM sodium citrate at pH 6.0 with unfolding buffer containing 12 mM sodium citrate and appropriate concentrations of urea at pH 6.0. The final condition for SF
measurements was 5μM h-apoMb/12 mM sodium citrate/0–7.6 M urea at pH 6.0. For
mea-surement of refolding and unfolding, time-dependent fluorescence change was monitored using an optical cutoff filter (50% transmittance at 305 nm) with an excitation wavelength at 295 nm. All kinetic experiments were conducted at 8°C. CF measurement was performed as
previously described by Shastryet al. [59]. SF measurement were carried out on an Applied
Photophysics SX-17 stopped-flow device (Surrey, UK). The dead-times of the CF and SF
devices, which were 102–175μs and 5.3 ms respectively, were calibrated by measuring the
bimolecular quenching ofN-acetyl-L-tryptophanamide fluorescence withN
-bromosuccini-mide [60].
The kinetic traces obtained by CF and SF measurements were fitted using non-linear least squares fitting to the following equation:
FobsðtÞ ¼Feqþ
X
Fie
l
it ð1Þ
whereFobs(t) andFeqare thefluorescence intensities at timetof the reaction and at a time
after the reaction has reached equilibrium, respectively, andFiandλiare the amplitude and
apparent rate constant of thei-th phase (i= 1 and 2 for refolding, andi= 3 and 2 for
unfold-ing). The cumulative amplitudes, which give thefluorescence intensities in the absence of the
preceding phases of refolding and unfolding, are defined asF0R2=Feq+F2andF0R1=Feq+F2
+F1for the refolding initiated at pH 2.0, andF0U2=Feq+F2andF0U1=Feq+F2+F3for the
unfolding (Feqrepresents thefluorescence intensity at equilibrium).
Quantitative modeling of kinetics
Standard numeric methods were applied to solve the system of linear differential equations describing a particular kinetic scheme, with IGOR software used to determine the eigenvalues and eigenvectors of the corresponding rate matrix. The kinetic parameters were manually opti-mized to fit the experimental data. The urea-concentration dependence of the elementary rate
constants was assumed to followEq 2[61]:
lnkij¼lnk
0
ijþ mzij
RT½urea ð2Þ
wherek0ijis the elementary rate constant in the absence of urea, andm
‡
slope.RandTare the gas constant and absolute temperature, respectively. Based on the associ-ated rate matrix, the elementary rate constants and the slopes were explored systematically to model the rate constants and amplitudes obtained from the kinetic measurements and equilib-rium unfolding experiments. Free energy diagrams were calculated from the elementary rate parameters obtained. The free energy of the relevant states and the transition states was
calcu-lated as a function of theα-value as the reaction coordinate at representative urea
concentra-tions. Theα-value was defined by a sum ofm‡ijfrom N to a given state normalized by the sum
of allm‡ij, which is the measure of the change in solvent-accessible surface area relative to N.
The activation energy for crossing the barriers between states was calculated as follows:
DGz
ij¼ RTln
k0
ij A0
mz
ij½urea ð3Þ
where an arbitrary value of 106s-1was used for the pre-exponential factor,A
0. Details of the
quantitative modeling are described inS1 File(Methods inS1 File).
Results
Urea-induced equilibrium unfolding
Fig 2shows the urea-induced equilibrium unfolding of h-apoMb measured by monitoring the
changes in ellipticity at 222 nm (Fig 2A) and the Trp fluorescence emission spectra (300–450
nm) upon excitation at 295 nm (Fig 2B and 2C). The measurements were performed in 12 mM
sodium citrate at pH 6.0 and 8°C. These unfolding transition curves were similar to those
pre-viously reported for sw-apoMb [30,44]. The transition curves monitored by fluorescence at
310–360 nm exhibited two transitions: one at ~1 M urea with an enhancement and the other at
~2 M urea with a decrease. In contrast, those monitored by fluorescence at>370 nm and
ellip-ticity at 222 nm apparently exhibited a single transition at ~1.5 M and ~1 M urea, respectively.
They were fitted by non-linear least squares fitting using a global fitting algorithm [9,55,56] to
an equilibrium three-state model consisting of the native (Neq), equilibrium intermediate
(Meq), and unfolded (Ueq) states as follows:
UeqÐMeqÐNeq Scheme 1
which yielded a set of global parameters (midpoint urea concentrations of Ueq$Meqand
Meq$Neqtransitions,Cm1, andCm2, and the correspondingm-values,m1andm2for each
transition) and local parameters (fluorescence intensities at 300–450 nm and ellipticity at
222 nm for Neq, Meq, and Ueqat 0 M urea, and the slope of the baselines). A linear
approxima-tion of the urea-dependence of the baseline as well as the thermodynamic stability of each
spe-cies was based on the work of Pace and that of Santoro and Bolen [55,56]. The thermodynamic
parameters are listed inTable 1. The fractions of the three species were also calculated as a
function of urea concentration (Fig 2D). At 0 M urea, h-apoMb consisted of a mixture of Neq
(~95%) and Meq(~5%). The fraction of Meqincreased from ~5% at 0 M urea, at the expense of
the fraction of Neq, until it reached a maximum at 1.3 M urea, which was subsequently followed
by a decrease with the increasing fraction of Ueq. We also investigated the stability of h-apoMb
vs. temperature to rule out possible cold denaturation [26] at 8°C, the temperature used in this
study. Fig A inS1 Fileshows that ellipticity at 222 nm decreased with temperature down to
4°C, below which cold denaturation occurs. This confirms that h-apoMb maintained its native structure at pH 6.0 and 8°C in the absence of urea.
The tryptophan fluorescence spectra and ellipticity at 222 nm of Neq, Meq, and Ueqlinearly
File). At 0 M urea, the fluorescence spectrum and the ellipticity at 222 nm resembled those of
Neqderived from the global fitting, which confirms that Neqis the dominant species at 0 M
urea, pH 6.0, and 8°C. The ellipticity value at 222 nm estimated for Neqwould be slightly less
than that at neutral pH because of the local destabilization of the helices [25,62]. The
fluores-cence spectrum and ellipticity at 222 nm of Meqderived from the global fitting were similar to
Fig 2. Urea-induced equilibrium unfolding of h-apoMb in 12 mM sodium citrate at pH 6.0 and 8°C.Unfolding transition curves monitored by (A) ellipticity at 222 nm and (B) the tryptophan fluorescence spectrum (310–440 nm). The solid lines are unfolding transition curves predicted by the global fitting
of a three-state model (Scheme 1) along with the residuals (upper panel). (A) Broken lines are baselines of Neq(blue), Meq(green), and Ueq(red) predicted by the global fitting. (B) Unfolding curves are coded with different colors. (C) A collection of fluorescence spectra of h-apoMb as a function of urea concentration measured at pH 6.0 and 8°C. Black circles represent an unfolding transition curve monitored by the fluorescence emission at 360 nm. The transition curves in (B) were obtained by transposing data in (C). (D) The fractions of each species as a function of the urea concentration obtained by the equilibrium unfolding experiments. The fractional Neq, Meq, and Ueqare shown in blue, green, and red, respectively.
those of the predominant equilibrium intermediate at pH 4 (i.e., the pH 4 intermediate).
Indeed, the helix contents of Meq, calculated using the ellipticity at 222 nm, were only ~5%
lower than those of the pH 4 intermediate (Table A inS1 File). The slight reduction may have
arisen due to the local destabilization of the helices or from the ambiguity in the slope of the
baseline of Meq, which was not well defined because of the apparent single-step transition
curve monitored by ellipticity. In addition, the overall structure of these h-apoMb intermedi-ates was indicated to be similar to that of the pH 4 intermediate of sw-apoMb because 1) helix
contents were similar (~0.4 for sw-apoMb [33]) and 2) amino acid sequences between h- and
sw-apoMbs were highly homologous, albeit with slightly less helix propensity for h-apoMb
(Table B inS1 File). This finding is supported by a previous molecular dynamics simulation
study of the unfolding of sperm whale and horse myoglobin [51], which indicated an overall
structural similarity of the intermediates transiently accumulated in thermal unfolding (although some difference from the apo-proteins was observed in the unfolding of the
D/E-helix regions due to the presence of heme). The fluorescence spectrum and ellipticity of Ueq
were more similar to those at pH 2.0 than to those at ~8 M urea and pH 6.0. Indeed, the helix
contents estimated by the ellipticity values of Ueqwere almost identical to those at pH 2.0 at
222 nm, with only 1% difference observed (Table A inS1 File). They were also consistent with
those of the acid unfolded state of sw-apoMb at pH 2.3 (~0.1 for sw-apoMb [33]). These results
provide further indication that the overall residual structure of Ueqis similar to that of the acid
unfolded state of sw-apoMb. In contrast, almost no residual secondary structure was expected for the unfolded state at ~8 M urea. It should be noted that the differences in fluorescence
intensity and CD properties between Ueqand ~8 M urea were expected from the slope of the
baselines in the unfolding region.
Urea-concentration dependence of the refolding and unfolding kinetics
The refolding and unfolding kinetics of h-apoMb was measured by monitoring fluorescence at various urea concentrations, pH 6.0, and 8°C. The refolding reaction at pH 6.0 was initiated by mixing acid-unfolded protein (pH 2.0) with buffer containing appropriate concentrations of urea, whereas the unfolding reaction at pH 6.0 was initiated by mixing native protein (pH 6.0) with buffer containing appropriate concentrations of urea. CF and SF experiments werecom-bined to cover the time course of folding and unfolding over the time range from ~100μs to
minutes. The dead-times of the CF and SF measurements were 102–175μs (depending on the
in-house constructed mixers used in the CF experiments) and 5.3 ms, respectively.
Table 1. Thermodynamic parameters for urea-induced equilibrium unfolding of hapoMb at pH 6.0 and 8°C.
i states mi(kcal/mol/M) Cmi(M) ΔG0i(kcal/mol)
Equilibriuma 1 NeqMeq 1.7±0.1 1.0±0.1 1.7±0.1
2 MeqUeq 1.4±0.1 1.6±0.1 2.2±0.1
3 NeqUeq 3.0±0.1b 1.3±0.1 3.8±0.1b
Kineticsc 1 N
eqMeq 1.4 0.6 0.9
2 MeqUeq 1.4 1.6 2.2
3 NeqUeq 2.8 1.1 3.1
aThermodynamic parameters obtained by
fitting a collection of the equilibrium unfolding transition curves with a globalfitting algorithm to a three-state model (Scheme 1). Error estimates for equilibrium parameters are based on goodness-of-fit (±one standard deviation).
bΔG0
3andm3were calculated by adding the corresponding thermodynamic parameter for the Neq$Meqand Meq$Ueqtransitions.
cThermodynamic parameters were calculated from the elementary rate constants and kineticm-values (Table C inS1 File) estimated by quantitative modeling. Neqis assumed to consist of N and N', Meqis assumed to be equivalent to M, and Ueqis assumed to consist of I and U.
Representative kinetic traces of the refolding and unfolding reactions are shown inFig 3. For
the refolding reaction, the kinetic traces measured at urea concentrations (1.6 M) were fitted
to a double-exponential function consisting of a faster rising phase and a slower decreasing phase whereas those at higher urea concentrations were fitted to a rising single-exponential
Fig 3. The kinetic traces of refolding and unfolding reactions of h-apoMb.The kinetic traces of (A) refolding and (B) unfolding reactions were measured by CF and SF fluorescence methods at various urea concentrations, pH 6.0, and 8°C. The fluorescence intensity is scaled relative to the fluorescence at pH 2.0. Black and colored lines show the kinetic traces obtained by non-linear least squares fitting and by the kinetic modeling, respectively. Kinetic parameters used to reconstruct kinetic traces are shown in Table C inS1 File (elementary rate constants and kineticm-values) andTable 2(intrinsic fluorescence intensity of each structural species).
function. The transient increase and subsequent decrease in fluorescence observed in refolding experiments at low urea concentrations reflects the rapid accumulation of a kinetic
intermedi-ate (M; see below) followed by conversion into the native stintermedi-ate (0.1–1 s). In contrast, the
increase in fluorescence without the slower decreasing phase observed at higher urea concen-trations indicates that the kinetic intermediate remained populated as an equilibrium
interme-diate, Meq. The observation indicates that the kinetic intermediate was continuously converted
into Meqas the final urea concentration increased, and that both M and Meqwere formed by
the same kinetic mechanism from the preceding state even under considerably different
condi-tions (i.e., M transiently accumulated even in the absence of urea, whereas Meqwas stably
pop-ulated even at urea concentrations higher than 2 M; see below). In addition to the kinetic phase (s) resolved by the fitting, an unresolved change in fluorescence (burst phase) was observed in the CF measurements from 0 M to 3.0 M urea, indicating accumulation of an additional inter-mediate, I, within the 100-μs range (see below). We also measured the refolding kinetics
initi-ated at pH 6.0 and 0.8 M urea, where Meqis a major non-native species (Fig 2D), by mixing the
protein solution with buffer containing appropriate concentrations of urea in the SF device. In
this case, the kinetic trace was fitted to a single-exponential function (0.13–0.53 M urea). This
refolding reaction was dominated by the conversion of Meqto Neq. The kinetic traces of the
unfolding reaction were fitted to a double-exponential function at intermediate urea
concentra-tions (3.0–4.0 M urea) and a single-exponential function at lower and higher concentrations.
The transient enhancement of the fluorescence observed at 3–4 M urea (within 1 ms of
unfold-ing) corresponds to the accumulation of a kinetic unfolding intermediate (N'; see below),
which is subsequently converted into the unfolded state (0.01–0.1 s). The faster phase was not
observed at low urea concentrations because of its small amplitude. It should be noted that urea was limited to ~4 M in the final conditions for CF unfolding measurement because of the solubility of urea and the 1:1 mixing ratio of the CF device.
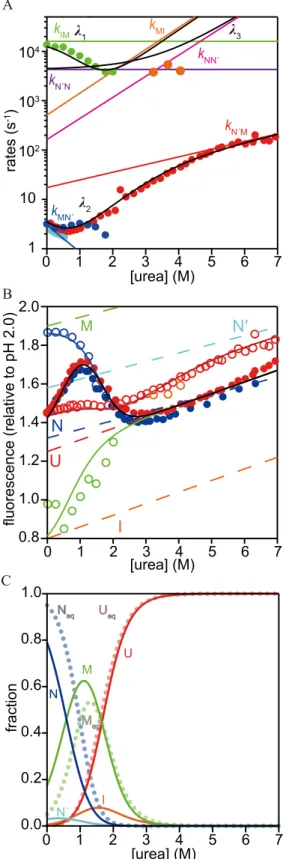
Fig 4Ashows the urea-dependence of the rate constants for folding and unfolding (chevron
plot). For refolding initiated at pH 2.0, the slower decreasing phase (phase 2;λ22–5 s-1)
cor-responds to the rate-limiting step of the overall folding reaction [48,63]. This is consistent with
the finding that the rate constant of the slower unfolding phase coincides withλ2at matching
urea concentrations. The only phase observed in refolding initiated at 0.8 M urea and pH 6.0
(phase 2';λ2'2–5 s-1) also overlaps withλ2under matching conditions (Fig 4A), indicating
that Meqand the kinetic intermediate overcome a common rate-limiting step in the
urea-induced folding process. On the other hand, the faster increasing phase in refolding initiated at
pH 2.0 (phase 1;λ1(0.4–1.2) × 104s-1) corresponds to the formation of a kinetic
intermedi-ate (M). The refolding limb exhibits a slight curvature (rollover) at low urea concentrations (~0.8 M urea), suggesting accumulation of an additional intermediate (I) within the dead-time
of the CF measurements. The faster of the two unfolding phases observed at 3–4 M urea (phase
3;λ34 × 103s-1) is distinct fromλ1, indicating the formation of a kinetic unfolding
interme-diate (N'). The accumulation of N' also accounts for the rollover of the unfolding limb ofλ2at
~3.5 M urea. Transient accumulation of a kinetic unfolding intermediate has previously been
reported during the pH-induced unfolding of sw-apoMb [52,64]. Native-like unfolding
inter-mediates are assumed to account for the rollover of the unfolding limb for some proteins [65–
67]. However, in contrast to N' (and the reported unfolding intermediate of sw-apoMb), these
unfolding intermediates have negligible population during refolding and unfolding because they are always less stable than others under these conditions. The structural and kinetic prop-erties of N' remain to be elucidated.
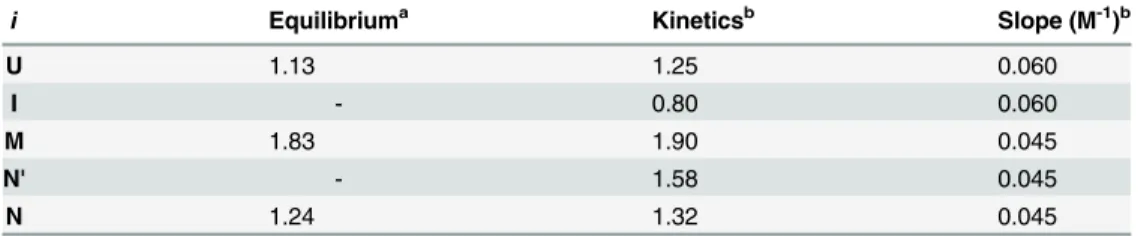
The observed urea-dependent amplitudes of folding and unfolding reactions provide
com-plementary information on refolding/unfolding kinetics (Fig 4B). We considered cumulative
for the analysis of fluorescence intensity [11]. The urea-dependence of the equilibrium values,
Feq, is consistent with the equilibrium unfolding transition curves already described (Fig 2).
The transition curves obtained for the refolding and unfolding kinetics coincide with each other, which confirms the reversibility of the folding reactions. Because phase 2 is
approxi-mately four orders of magnitude slower than phase 1, the urea-dependence ofF0R2
approxi-mates the pre-equilibrium unfolding of M. The urea-dependence ofF0R2andFeqshares the
transition region at ~1.6 M urea, indicating that the stability of M and Meqis similar. TheF0R1
values are the fluorescence intensity extrapolated tot= 0 for CF measurements. The
discrep-ancy betweenF0R1and the fluorescence intensity expected for the unfolded state (U) is
consis-tent with the accumulation of I as the burst phase over a urea concentration range from 0 M to
~3 M. Thus, the urea-dependence ofF0R1approximates the pre-equilibrium unfolding of I.
F0U2apparently exhibits two small but distinct transitions at ~1.6 M and ~4 M urea. The first
transition arises from the unfolding of Meqpopulated at 0 M urea (Fig 2D), whereas the second
transition arises from the pre-equilibrium between the native state (N) and N'.
Quantitative modeling of the refolding/unfolding kinetics
We quantitatively modeled the folding scheme to reproduce the observable rate constants
(λ1,λ2, andλ3) and kinetic amplitudes (F0R1,F0R2,F0U1, andF0U2). As previously reported, the
kinetic behavior of the folding and unfolding reactions of apoMb was consistent with a
sequen-tial mechanism rather than a parallel-pathway mechanism [5,45,47,63]. For example, a folding
scheme with phases 1 and 2 located on the respective parallel pathways would not account for
the enhancement of fluorescence during refolding under strongly native conditions [46]. In
support of the sequential pathway mechanism, previous pulsed H/D exchange and double-jump mixing experiments using sw-apoMb revealed that the native state had not populated
within a few milliseconds of the pH-induced folding reaction (seeDiscussion). Based on the
current results for h-apoMb, at least five states were associated with its folding/unfolding. In addition to N and U, at least one intermediate (I) is responsible for the observed burst phase in
the CF refolding measurements and the rollover ofλ1at ~0.8 M urea, a second intermediate
(M) is responsible for phase 1, and a third intermediate (N') for phase 3 and the curvature of
λ2at ~3.5 M urea (Fig 4). Thus we assumed a sequential five-state (Scheme 2) in the
quantita-tive modeling described below.
UÐ
kIU kUI
IÐ
kMI kIM
MÐ
kN0M kMN0
N0Ð
kNN0
kN0N
N Scheme 2
The elementary rate constants,kij, are defined byEq 2[61]. The elementary rate constants
in the absence of urea,k0ij, and urea-dependence,m‡ij, were manually varied to reproduce the
chevron plot obtained using the rate-matrix approach. The predicted kinetic parameters are modeling (color codes for the elementary rate constants are shown). (B) The cumulative amplitudes obtained in the CF and SF experiments (circles). Open circles:F0R1(green) andF0R2(blue) for refolding, andF0U1 (orange) andF0U2(red) for unfolding. Filled circles:Feqobtained by refolding (blue) and unfolding (red). The solid lines representFeq(black),F0R1(green),F0R2(blue),F0U1(orange), andF0U2(red) reproduced by quantitative modeling. Here, the cumulative amplitudes are defined asF0R2=Feq+F2andF0R1=Feq+F2+ F1for the refolding reaction initiated at pH 2.0, andF0U2=Feq+F2andF0U1=Feq+F2+F3for the unfolding reaction, whereFiis the amplitude of thei-th phase ofEq 1andFeqrepresents the fluorescence intensity at equilibrium. Dashed lines represent the fluorescence intensities of U (red), I (orange), M (green), N' (cyan), and N (blue) predicted by the quantitative modeling. (C) The fractions of each state reproduced by the quantitative modeling. The solid lines represent the reproduced fractions of U (red), I (orange), M (green), N' (cyan) and N (blue), while the dotted lines in pale colors represent the fractional Ueq(red), Meq(green), and Neq(blue) obtained by the equilibrium unfolding experiments.
plotted inFig 4Aand listed in Table C inS1 File. As described above, phase 1 was associated
with the interconversion between U, I, and M. The unfolding limb ofλ1was well approximated
bykMI, whereaskUI,kIU, andkIMwere constrained by the approximate relationshipλ1kUI/
(kUI+kIU) ×kIMfor the curved refolding limb. Only the ratio forkUIandkIUwas uniquely
determined because the interconversion between U and I occurred within the dead-time of the CF measurements and thus, was not directly observed. On the other hand, phases 2 and 3 were
associated with the interconversion between M, N', and N. The urea-dependence ofλ2was well
approximated bykMN'andkN'Munder native conditions (the refolding limb) and strongly
denaturing conditions (the unfolding limb at high urea concentrations), respectively. The
ele-mentary rate constants,kNN'andkN'Nwere determined to reproduce the unfolding limb ofλ2
by the approximate relationshipλ2kNN'/(kNN'+kN'N) ×kN'M. The urea-dependence ofλ3at
3–4 M urea gave further constraint tokNN'. In addition, thefluorescence intensity of each
spe-cies was optimized to reproduce the amplitudes. Thefluorescence intensities of U and N were
determined according to the corresponding baselines obtained experimentally.F0R1was the
fluorescence intensity of the burst phase andF0R2approximated thefluorescence intensity
transiently saturated after phase 1, in which M was most populated during refolding. Thus,
under stabilizing conditions,F0R1andF0R2were used to determine thefluorescence intensity of
I and M, respectively.F0U2was reproduced by adjusting thefluorescence intensity of N'. The
fluorescence intensity of each species is plotted inFig 4Band listed inTable 2.
To test the validity of the model, the obtained kinetic parameters and fluorescence intensi-ties were used to reproduce the kinetic traces of folding and unfolding reactions at
representa-tive urea concentrations (Fig 3). The kinetic traces were in good agreement with those obtained
experimentally. With 1.5 M and 2.0 M urea, small deviations were observed in the submillise-cond range for the kinetic traces of refolding, which could be attributed to the fluctuation in
F0R1values (Fig 4B). Rapid decreases in fluorescence occurring within ~10μs of refolding and
~50μs of unfolding arose from the formation of I and the unfolding of Meqpopulated at 0 M
urea, respectively. Additionally, thermodynamic parameters calculated using kinetic parame-ters were in good agreement with those obtained by the fitting of equilibrium unfolding data (Table 2andFig 4C). Based on the fluorescence properties of each species, and because some
of the species inScheme 2were not resolved in the equilibrium unfolding, we assigned the sum
of U and I to Ueq, the sum of N' and N to Neq, and M to Meq. Taken together, the results of the
quantitative modeling accounted for the refolding/unfolding kinetics and equilibrium
unfold-ing data obtained experimentally. Although the five-state model (Scheme 2) was consistent
with the data obtained by the kinetic and equilibrium experiments, we further tested whether simpler models could account for the data. For this purpose, we explored the kinetic parame-ters and fluorescence intensities of each species to reproduce the folding and unfolding kinetics
Table 2. Fluorescence intensity of each species (relative to that at pH 2.0) at pH 6.0 and 8°C.
i Equilibriuma Kineticsb Slope (M-1)b
U 1.13 1.25 0.060
I - 0.80 0.060
M 1.83 1.90 0.045
N' - 1.58 0.045
N 1.24 1.32 0.045
aValues were obtained by
fitting a collection of the equilibrium unfolding transition curves with a global
fitting algorithm to a three-state model (Scheme 1).
bValues were obtained by modeling the folding/unfolding kinetics of h-apoMb based onScheme 2.
and unfolding equilibrium obtained by the experiments; this was achieved by assuming four-state kinetic schemes lacking one of the intermediates (I, M or N'). The urea-dependence of the rate constants, cumulative amplitudes and population of each species at equilibrium obtained
via the quantitative modeling assuming the four-state models are shown in Fig D inS1 File.
The discrepancy between the results obtained in the experiments and in the quantitative modeling (assuming a four-state model) lends support to the validity of the five-state kinetic
scheme (Scheme 2).
Discussion
Relationship between the kinetic intermediate M and the equilibrium
intermediate M
eqThe relationship between kinetic and equilibrium intermediates has been investigated for sev-eral proteins by comparing the structural and thermodynamic properties of the two types of
states [3–11]. Such comparative studies have been extensively conducted, in most cases to
assess the intermediates of apoMb for pH-induced folding and unfolding. H/D exchange NMR studies on sw-apoMb showed that the equilibrium state(s) populated at pH 4 and a transient kinetic intermediate formed in ~10 ms of refolding at pH 6 exhibited similar patterns of protec-tion, i.e., both intermediates contained native-like secondary structures in the A-, G- H-, and
part of the B-, helices [5–7,29,34]. For h-apoMb, time-resolved CD and small angle X-ray
scat-tering (SAXS) experiments revealed that the helix content (~40% compared with the native
state) and overall molecular size (~30% larger radius of gyration,Rg, than the native state) were
also similar for a kinetic intermediate (I2) and a trichloroacetate stabilized equilibrium
inter-mediate [48]. Additionally, a slow folding phase with similar rate and amplitude was observed
in folding experiments on sw-apoMb starting from either fully unfolded state or the partially folded state at pH 4, indicating that these intermediates were converted into the native state via
a common kinetic mechanism [46]. For urea-induced folding of apoMb, Samatovaet al.
mea-sured urea-dependence of the folding/unfolding of sw-apoMb and the variants using stopped-flow fluorescence under conditions similar to those used in the present study (pH 6.2 and
11°C) [44]. They measured the apparent rate constants of the rate-limiting step of refolding
over a wide range of urea concentrations, which was most likely to correspond toλ2in the
pres-ent study (Fig 4A), and the burst phase of refolding (the fluorescence change that occurred
within the dead time of the stopped-flow apparatus (<<20 ms)). The burst phase in their
study was likely to correspond toF0R2(Fig 4B) in our study. However, the formation of kinetic
intermediates and non-native equilibrium states has not been directly compared under a wide range of conditions from strongly native to denaturing, in part due to the limited time resolu-tion of convenresolu-tional stopped-flow methods.
In this study, we showed that the same set of kinetic barriers were encountered in the
forma-tion of the kinetic intermediate (M) and the corresponding equilibrium state (Meq) for
urea-induced folding and unfolding. In particular, we showed, using CF and SF methods (Fig 4),
that M shifts from a transient intermediate to a well populated equilibrium state as the urea concentration is increased. In the refolding reaction, M transiently accumulated during refold-ing at pH 6.0 and 0 M urea, and formation of M was continuously observed in the refoldrefold-ing up
to 2.2 M urea as long as the fast phaseλ1had measurable amplitude. In contrast, the formation
of N was observed only at<~1.6 M urea due to the low stability of N (the free energy difference
between N and M is ~1.0 kcal/mol at pH 6.0 and 0 M urea; seeTable 1). It follows that M
pre-dominantly accumulates as an equilibrium intermediate between 0.7 and 2.0 M urea, a urea concentration range in which N is no longer populated predominantly at equilibrium. More
kMI, and N', which is readily converted into N, was preferentially formed over M becausekMN'
is larger than the apparent unfolding rate constant (λ2kNN'/(kNN'+kN'N) ×kN'M); this leads
to the conversion of U to N with transient accumulation of M as a kinetic intermediate. In
con-trast, at 0.7–2 M urea, M was preferentially formed not only over N' becauseλ2was larger than
kMN'but also over I becausekIM>>kMI; thus, M is stably populated as an equilibrium state,
which is equivalent to Meq. Therefore, M and Meqare formed by overcoming the same set of
kinetic barriers, consistent with a single molecular species. Furthermore, the stability of N rela-tive to M determines whether M transiently accumulates during refolding under strongly native conditions (~0 M urea) or is populated at equilibrium under moderately denaturing
conditions (0.7–2.0 M urea). Moreover, the matching urea dependence ofλ2andλ2' indicates
that M and Meqis converted into N via the same kinetics process, as previously reported for
the pH-induced folding of sw-apoMb [46]. Quantitative modeling also revealed that M and
Meqhad similar thermodynamic stabilities and fluorescence intensities (Fig 3A, Tables1and
2). This is supported by the shared transition region ofF0R2andFeqat ~1.6 M urea because the
urea dependence ofF0R2represented the pre-equilibrium unfolding of M. The energetics of the
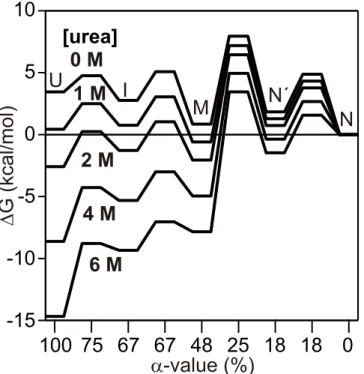
(un)folding reaction are schematically illustrated by a free energy diagram as a function ofα
-value, a measure of the change in solvent-accessible surface area occurring during folding.Fig
5shows that M is one of the most stable species at 1–2 M urea, which leads to the accumulation
of M as an equilibrium intermediate. This implies that regions that are more robust to pertur-bation by urea form at an earlier stage of folding, which further supports the validity of the use of equilibrium intermediates as counterparts for kinetic intermediates. It should be noted that formation of the overall native-like structure (i.e., folding of the C-, D-, E- and part of the B-helix regions that are less stable than the A-, G-, and H-B-helix regions) would occur during the
M!N conversion (phase 2) considering the similarity in the rate-limiting step of folding
between h-apoMb and sw-apoMb.
Fig 5. A free energy diagram of h-apoMb at pH 6.0 and 8°C as a function ofα-value (i.e., the change in the solvent accessible surface area relative to N).
Burst phase intermediate, I
A kinetic intermediate, I, accumulates during folding within the dead-time of CF
measure-ments, as indicated by the rollover inλ1and the missing amplitude in refolding experiments at
low urea concentrations. Quantitative modeling showed that the I state has lower fluorescence
than U (0.80 vs. 1.25) and anα-value closer to that of M than U (Fig 5). These results suggest
the overall structure of I is already rather compact, consistent with the observation that a
con-siderable decrease inRg(~6 Å) occurs within ~300μs of refolding [48].
Our results are also supported by a recent study on the folding of the apo-form of the
heme-binding domain of flavohemoglobin (apoHmpH) fromEscherichia coli, a protein with a globin
fold structurally analogous to h-apoMb [68]. ApoHmpH, which has a single-Trp at position
120 in the H-helix, forms a kinetic intermediate during folding on the 10-μs time scale. Because the fluorescence spectrum of the intermediate is blue-shifted compared to that of the unfolded state, the observed fluorescence quenching is attributed to the establishment of specific short-range intramolecular interactions with quenching residues located in the core region around the Trp residue. This quenched and blue-shifted fluorescence of apoHmpH I-state is consistent with the reduced fluorescence intensity of I observed in our study. Although they are located in different helices, the Trp residues of both proteins are involved in the core region consisting of A-, G-, and H-helices. Thus, the change in Trp fluorescence that occurs during early folding is likely to represent similar structural events for both proteins. In addition, infrared (IR) spec-troscopy and UV resonance Raman (UVRR) scattering studies on h-apoMb indicate that both solvated and buried helices are present, but the side-chains of Trp residues are partially
sol-vent-shielded over a time scale of 100μs [63,69]. Thus, both of these globins rapidly form an
intermediate with a quenched and blue-shifted fluorescence spectrum consistent with a col-lapsed state with a partially formed A-, (B-), G-, and H-helix core.
Folding mechanism of h-apoMb
We showed that a sequential five-state mechanism (Scheme 2) quantitatively accounts for the
three observable kinetic phases along with the burst phase in refolding (Figs3and4).
Multi-phasic folding/unfolding kinetics is, however, also observed for a parallel-pathway folding mechanism, as mentioned above. Here, we discuss the folding mechanism that appropriately represents the folding of h-apoMb. Previous pulsed H/D experiments combined with mass
spectrometry on sw-apoMb folding [45,70] showed that the pH-induced kinetic folding
inter-mediate had already accumulated within 6 ms of initiating folding without detectable amounts of the native state, whereas the native state appeared only after 100 ms of folding at the expense of the intermediate state. This indicates that the folding of sw-apoMb is consistent with a sequential rather than a parallel-pathway mechanism. The sequential mechanism is also sup-ported as a folding mechanism for h-apoMb as indicated by the results of previous
continuous-flow CD and SAXS experiments [48]. In these studies, two kinetic phases with time constants
of 5 and 49 ms were detected along with a burst phase (dead-time of 280μs) during
pH-induced refolding from pH 2.2 to pH 6.0. The observation thatRgremained constant (23.7 Å)
from 300μs to ~10 ms suggested that h-apoMb folds to the native state via a sequential
nism with accumulation of two folding intermediates; in contrast, a parallel-pathway
mecha-nism would predict a considerable reduction ofRgover this time range, since both pathways
lead to the compact native state. The observed stepwise increase inα-helical content and
reduc-tion inRgin each kinetic phase further support sequential accumulation of two folding
inter-mediates. In addition, a previous ultra-fast H/D exchange experiment on sw-apoMb [5]
revealed that the amide protons in the A-, G-, and H-helix regions of the native structure were
in the B-, C-, and E-helix around 6 ms. Taken together, the folding of h-apoMb is most likely represented by a sequential rather than a parallel-pathway mechanism, assuming that the fold-ing mechanisms are conserved between sw-apoMb and h-apoMb.
A stepwise change in structure was also observed in previous molecular dynamics
simula-tions [49–51]. Unfolding simulations induced by protonation of ionizable groups, which
corre-sponds to acid unfolding, indicated that sw-apoMb unfolds via partially unfolded structures similar to the pH 4 intermediate, i.e., before it reaches a fully unfolded state, A-, G-, H- and part of B-helices form a compact core with helix contents consistent with those obtained in an
experimental study [33]. Thermal unfolding simulations of myoglobins, including sperm
whale and horse myoglobins, also demonstrated transient formation of partially unfolded structures with a few helix regions partially formed during thermal unfolding at 500 K (although helix regions relevant to heme binding unfolded more slowly than the apo-proteins due to the presence of heme). In these simulation studies, partially unfolded structures were observed, which suggests that this protein folds via a sequential mechanism.
InScheme 2, the three intermediates were assumed as on-pathway states, i.e., they were pro-ductive intermediates. Here, we also consider the possibility that an intermediate is a dead-end product under the assumption of a five-state sequential scheme. In this case, the intermediate is not productive and should be at least partially unfolded to reach the native state. We there-fore ask whether I or M could be an off-pathway intermediate as follows:
IðMÞ ÐUÐMðIÞ ÐN0 ÐN Scheme 3
The kinetic behavior predicted byScheme 3is essentially indistinguishable from that of
Scheme 2. This is because pre-equilibrium among U, I, and M is established very rapidly (within ~ms), whereas the conversion to N' becomes significant where the time scale is 100-ms
to seconds. The difference between these schemes could be kinetically distinguished if the U$
I interconversion was not only experimentally observed but also strongly coupled with the I$
M interconversion, as previously reported for the folding of immunity protein 7 [71]. However,
theα-values of I and M are expected to be ~50% according to the above schemes, which
indi-cates that I/M should be globally unfolded before the conversion into N within the submillise-cond range. This is unlikely when considering that the native-like substructure is already
formed on the 400-μs time scale of refolding of the homologous sw-apoMb [5]. Thus, we
pro-pose thatScheme 2represents the folding of h-apoMb but acknowledge that further
improve-ments in time resolution will likely provide additional insight into the folding of this protein. We observed the formation of a single folding intermediate (M) in the submillisecond-to-millisecond range during refolding. In contrast, some previous kinetic studies of both h-apoMb and sw-apoMb reported two folding intermediates that resulted in sequential four-state kinetic
schemes [46,48]. According to previous CD, SAXS, and IR absorption-detected CF
experi-ments on h-apoMb [48,63], the two intermediates exhibited similar secondary structure and
overall size. Additionally, the intermediates of sw-apoMb (Ia/Ib) also had similar fluorescence intensities, although UVRR-detected CF measurements of h-apoMb suggested differences in
the local environment of the two Trp side-chains [69]. Thus, even if the kinetic intermediate
ensemble (M) observed for h-apoMb in this study consisted of multiple forms (such as Ia and Ib), their fluorescence intensities might be similar in the case of h-apoMb, which would make it difficult to resolve them via the Trp fluorescence measurements employed here. Another pos-sibility is that I and M corresponded to Ia and Ib, respectively. As already discussed, it is likely that M involves Ib because the folding from these intermediates is the rate-limiting step and
the rate constants (λ22 s-1at 0 M urea, pH 6.0, and 8°C) are comparable to those obtained in
26°C) given the differences in sequence and temperature. However, the rate constant of the
conversion from I to M (λ1104s-1at 0 M urea, pH 6.0, and 8°C) was two-to-three orders of
magnitude larger than the rate constants of the conversion between Ia and Ib (~ 50 s-1for
sw-apoMb at pH 6.0 and 5°C; ~200 s-1for h-apoMb at pH 6.0 and 26°C). This difference is too
large to confidently assign phase 1 to the conversion from Ia to Ib. The I$M interconversion
is more likely to correspond to conversion of the burst phase intermediate to a folding interme-diate observed in previous studies of pH-induced folding of h-apoMb using IR absorption- and
UVRR-detected CF [63,69]. In fact, the burst phase intermediates and I were formed within a
similar time range (<100–200μs), and the folding intermediate formed was indicated to
corre-spond to Ia when observed by IR. However, their rate constants were 2.5−3×10³s-1at 20–25°C,
which are much slower than those obtained in this study considering the temperature used
here (8°C). Nevertheless, the I$M interconversion is more likely to correspond to the kinetics
detected in the submillisecond time range by the IR and UVRR measurements than the Ia$
Ib interconversion, although detailed investigation is needed to understand the early folding events of apoMb.
This study is complementary to a recent study on the folding/unfolding kinetics of the
inter-mediates of sw-apoMb at pH 4, since the pH 4 intermediate is analogous to Meq, based on its
spectroscopic properties (Tables A and B, and Fig B inS1 File) [52]. Two intermediates were
observed in urea-induced folding/unfolding reactions at pH 4.2, including one that
accumu-lates with a time constant of ~30μs during refolding at low urea concentrations, and a second
one formed within ~200μs of unfolding at high urea concentrations. Assuming that the pH 4
intermediate of sw-apoMb corresponds to the Meqof this study, the counterpart of the burst
phase intermediate, I, would be the sw-apoMb refolding intermediate. Indeed, even at pH 4.2 the sw-apoMb refolding intermediate accumulated in the 100-μs range (comparable to the dead-time of the CF device used in this study), which would be observed as the burst phase intermediate during refolding under native conditions at pH 6.0. On the other hand, there is a distinct difference in the fluorescence properties between these two intermediates. The I state of h-apoMb is less fluorescent than U, whereas the sw-apoMb folding intermediate exhibits a higher fluorescence intensity compared to U. Nevertheless, because fluorescence properties often reflect the local as well as global environment around Trp residues, the sw-apoMb refold-ing intermediate is still likely to correspond to I based on the similarity in their kinetic behav-ior. In addition, it should be noted that preliminary CF unfolding measurements initiated at 0.8 M urea and pH 6.0, where M is populated, detected changes in fluorescence within the
dead-time of the device, and that unfolding was much faster than the reverse I!M conversion
(~104s-1). The non-two-state behavior implies transient accumulation of an unfolding
inter-mediate, which is consistent with the observation of the unfolding intermediate of sw-apoMb, although further investigation is required.
In summary, we systematically investigated the urea-dependence of the refolding/unfolding kinetics and unfolding equilibrium of h-apoMb, and found that five species (U, I, M, N', and N) are associated with the refolding/unfolding reactions. We quantitatively modeled the data using a five-state sequential kinetic model. The formation of M is observed over a wider range
of urea concentrations (0–2.2 M) than the formation of N (0–1.6 M). Based on the differences
between the urea-dependent stability of M and N, we determined that M and Meqare formed
by overcoming a shared kinetic barrier in the folding reaction and that the stability of N relative
to M determines whether M transiently accumulates during folding or is populated as Meq. An
additional intermediate, I, accumulated within the dead-time of refolding, and the native-like
Supporting Information
S1 File. Supporting information related to“Evidence for a Shared Mechanism in the
For-mation of Urea-Induced Kinetic and Equilibrium Intermediates of Horse Apomyoglobin from Ultrarapid Mixing Experiments.”S1 File contains the following sections. Methods: description of the methods used for detailed analysis of the quantitative modeling; Table A:
helix contents of Neq, Meq, and Ueqestimated by ellipticity at 222 nm and of a crystal structure;
Table B: differences in the primary structures and helix propensity values between h-apoMb and sw-apoMb; Table C: kinetic parameters estimated by monitoring the refolding and
unfold-ing kinetics of h-apoMb based onScheme 2at pH 6.0 and 8°C; Fig A: temperature dependence
of the ellipticity at 222 nm in 12 mM sodium citrate at pH 6.0; Fig B: far-UV CD and fluores-cence spectra of h-apoMb in 12 mM sodium citrate at 8°C under various conditions; Fig C: time-dependent changes in fluorescence during the folding of h-apoMb at pH 6.0 and 0.8 M urea compared with those initiated at pH 2.0; Fig D: urea-dependence of the rate constants and the cumulative amplitudes of refolding and unfolding, and population of each species of h-apoMb calculated by the quantitative modeling assuming four-state schemes.
(PDF)
Acknowledgments
We thank Dr. Heinrich Roder for stimulating discussions and critical comments. We are grate-ful to Drs. Satoshi Takahashi, Takanori Uzawa, Ming Xu, and Tomoki P. Terada for helpgrate-ful discussions. We thank the Center for Gene Research, Nagoya University for performing the CD measurements, and the Technical Center of Nagoya University for constructing the contin-uous-flow mixers.
Author Contributions
Conceived and designed the experiments: KM TM. Performed the experiments: TM YA. Ana-lyzed the data: TM YA KM. Wrote the paper: TM YA KM.
References
1. Arai M, Kuwajima K (2000) Role of the molten globule state in protein folding. Adv Protein Chem 53: 209–282. PMID:10751946
2. Ptitsyn OB (1995) Molten globule and protein folding. Adv Protein Chem 47: 83–229. PMID:8561052 3. Kuwajima K, Hiraoka Y, Ikeguchi M, Sugai S (1985) Comparison of the transient folding intermediates
in lysozyme andα-lactalbumin. Biochemistry 24: 874–881. PMID:3994996
4. Ikeguchi M, Kuwajima K, Mitani M, Sugai S (1986) Evidence for identity between the equilibrium unfold-ing intermediate and a transient foldunfold-ing intermediate: A comparative study of the foldunfold-ing reactions ofα -lactalbumin and lysozyme. Biochemistry 25: 6965–6972. PMID:3801404
5. Uzawa T, Nishimura C, Akiyama S, Ishimori K, Takahashi S, Dyson HJ, et al. (2008) Hierarchical fold-ing mechanism of apomyoglobin revealed by ultra-fast H/D exchange coupled with 2D NMR. Proc Natl Acad Sci U S A 105: 13859–13864. doi:10.1073/pnas.0804033105PMID:18779573
6. Jennings PA, Wright PE (1993) Formation of a molten globule intermediate early in the kinetic folding pathway of apomyoglobin. Science 262: 892–895. PMID:8235610
7. Hughson FM, Wright PE, Baldwin RL (1990) Structural characterization of a partly folded apomyoglobin intermediate. Science 249: 1544–1548. PMID:2218495
8. Raschke TM, Marqusee S (1997) The kinetic folding intermediate of ribonuclease H resembles the acid molten globule and partially unfolded molecules detected under native conditions. Nat Struct Biol 4: 298–304. PMID:9095198
10. Roder H, Elöve GA, Englander SW (1988) Structural characterization of folding intermediates in cyto-chrome c by H-exchange labelling and proton NMR. Nature 335: 700–704. PMID:2845279
11. Arai M, Kuwajima K (1996) Rapid formation of a molten globule intermediate in refolding ofα-lactalbumin. Fold & Des 1: 275–287.
12. Wu LC, Peng Z-y, Kim PS (1995) Bipartite structure of theα-lactalbumin molten globule. Nat Struct Biol 2: 281–286. PMID:7796264
13. Schulman BA, Kim PS (1996) Proline scanning mutagenesis of a molten globule reveals non-cooperative formation of a protein's overall topology. Nat Struct Biol 3: 1–6.
14. Luo Y, Kay MS, Baldwin RL (1997) Cooperativity of folding of the apomyoglobin pH 4 intermediate stud-ied by glycine and proline mutations. Nat Struct Biol 4: 925–930. PMID:9360609
15. Shastry MCR, Roder H (1998) Evidence for barrier-limited protein folding kinetics on the microsecond time scale. Nat Struct Biol 5: 385–392. PMID:9587001
16. Huang CY, Klemke JW, Getahun Z, DeGrado WF, Gai F (2001) Temperature-dependent helix-coil tran-sition of an alanine based peptide. J Am Chem Soc 123: 9235–9238. PMID:11562202
17. Roder H, Maki K, Cheng H (2006) Early events in protein folding explored by rapid mixing methods. Chem Rev 106: 1836–1861. PMID:16683757
18. Matsumoto S, Yane A, Nakashima S, Hashida M, Fujita M, Goto Y, et al. (2007) A rapid flow mixer with 11-μs mixing time microfabricated by a pulsed-laser ablation technique: observation of a barrier-limited collapse in cytochromecfolding. J Am Chem Soc 129: 3840–3841. PMID:17375918
19. Wright PE, Baldwin RL (2000) Case study 1: the foldign process of apomyoglobin. in Mechanisms of Protein Folding (Pain R H, ed): pp. 309–329, Oxford University Press, Oxford.
20. Jamin M (2005) The folding process of apomyoglobin. Protein Pept Lett 12: 229–234. PMID:15777270 21. Kendrew JC, Dickerson RE, Strandberg BE, Hart RG, Davies DR, Phillips DC, et al. (1960) Structure of
myoglobin: A three-dimensional Fourier synthesis at 2Å. resolution. Nature 185: 422–427. PMID:
18990802
22. Breslow E (1962) Role of the heme in the titration of sperm whale myoglobin. J Biol Chem 237: 3308–3311.
23. Harrison SC, Blout ER (1965) Reversible Conformational Changes of Myoglobin and Apomyoglobin. J Biol Chem 240: 299–303. PMID:14253427
24. Crumpton MJ, Polson A (1965) A Comparison of the Conformation of Sperm Whale Metmyoglobin with That of Apomyoglobin. J Mol Biol 11: 722–729. PMID:14338782
25. Balestrieri C, Colonna G, Giovane A, Irace G, Servillo L (1976) Equilibrium evidence of non-single step transition during guanidine unfolding of apomyoglobins. FEBS Lett 66: 60–64. PMID:1278441 26. Griko YV, Privalov PL, Venyaminov SY, Kutyshenko VP (1988) Thermodynamic study of the
apomyo-globin structure. J Mol Biol 202: 127–138. PMID:3172208
27. Kataoka M, Nishii I, Fujisawa T, Ueki T, Tokunaga F, Goto Y (1995) Structural characterization of the molten globule and native states of apomyoglobin by solution X-ray scattering. J Mol Biol 249: 215–228.
PMID:7776373
28. Goto Y, Fink AL (1990) Phase diagram for acidic conformational states of apomyoglobin. J Mol Biol 214: 803–805. PMID:2388268
29. Loh SN, Kay MS, Baldwin RL (1995) Structure and stability of a second molten globule intermediate in the apomyoglobin folding pathway. Proc Natl Acad Sci U S A 92: 5446–5450. PMID:7777528 30. Barrick D, Baldwin RL (1993) Three-state analysis of sperm whale apomyoglobin folding. Biochemistry
32: 3790–3796. PMID:8466917
31. Hughson FM, Wright PE, Baldwin RL (1990) Structural characterization of a partly folded apomyoglobin intermediate. Science 249: 1544–1548. PMID:2218495
32. Eliezer D, Jennings PA, Wright PE, Doniach S, Hodgson KO, Tsuruta H (1995) The radius of gyration of an apomyoglobin folding intermediate. Science 270: 487–488. PMID:7570004
33. Eliezer D, Yao J, Dyson HJ, Wright PE (1998) Structural and dynamic characterization of partially folded states of apomyoglobin and implications for protein folding. Nat Struct Biol 5: 148–155. PMID:
9461081
34. Eliezer D, Chung J, Dyson HJ, Wright PE (2000) Native and non-native secondary structure and dynamics in the pH 4 intermediate of apomyoglobin. Biochemistry 39: 2894–2901. PMID:10715109 35. Cocco MJ, Lecompte JT (1994) The native state of apomyoglobin described by NMR spectroscopy:
inter-actions with the paramagnetic probe HyTEMPO and the fluorescent dye ANS. Protein Sci 3: 267–281.
36. Eliezer D, Wright PE (1996) Is apomyoglobin a molten globule? Structural characterization by NMR. J Mol Biol 263: 531–538. PMID:8918936
37. Yao J, Chung J, Eliezer D, Wright PE, Dyson HJ (2001) NMR structural and dynamic characterization of the acid-unfolded state of apomyoglobin provides insights into the early events in protein folding. Bio-chemistry 40: 3561–3571. PMID:11297422
38. Lietzow MA, Jamin M, Dyson HJ, Wright PE (2002) Mapping long-range contacts in a highly unfolded protein. J Mol Biol 322: 655–662. PMID:12270702
39. Waltho JP, Feher VA, Merutka G, Dyson HJ, Wright PE (1993) Peptide models of protein folding initia-tion sites. 1. Secondary structure formainitia-tion by peptides corresponding to the G- and H-helices of myo-globin. Biochemistry 32: 6337–6347. PMID:8518279
40. Shin HC, Merutka G, Waltho JP, Wright PE, Dyson HJ (1993) Peptide models of protein folding initiation sites. 2. The G-H turn region of myoglobin acts as a helix stop signal. Biochemistry 32: 6348–6355.
PMID:8518280
41. Shin HC, Merutka G, Waltho JP, Tennant LL, Dyson HJ, Wright PE (1993) Peptide models of protein folding initiation sites. 3. The G-H helical hairpin of myoglobin. Biochemistry 32: 6356–6364. PMID:
8518281
42. Schwarzinger S, Wright PE, Dyson HJ (2002) Molecular hinges in protein folding: the urea-denatured state of apomyoglobin. Biochemistry 41: 12681–12686. PMID:12379110
43. Ha JH, Loh SN (1998) Changes in side chain packing during apomyoglobin folding characterized by pulsed thiol-disulfide exchange. Nat Struct Biol 5: 730–737. PMID:9699638
44. Samatova EN, Melnik BS, Balobanov VA, Katina NS, Dolgikh DA, Semisotnov GV, et al. (2010) Folding intermediate and folding nucleus for I—>N and U—>I—>N transitions in apomyoglobin: contributions
by conserved and nonconserved residues. Biophys J 98: 1694–1702. doi:10.1016/j.bpj.2009.12.4326
PMID:20409491
45. Tsui V, Garcia C, Cavagnero S, Siuzdak G, Dyson HJ, Wright PE (1999) Quench-flow experiments combined with mass spectrometry show apomyoglobin folds through and obligatory intermediate. Pro-tein Sci 8: 45–49. PMID:10210182
46. Jamin M, Baldwin RL (1998) Two forms of the pH 4 folding intermediate of apomyoglobin. J Mol Biol 276: 491–504. PMID:9512718
47. Jamin M, Yeh SR, Rousseau DL, Baldwin RL (1999) Submillisecond unfolding kinetics of apomyoglo-bin and its pH 4 intermediate. J Mol Biol 292: 731–740. PMID:10497035
48. Uzawa T, Akiyama S, Kimura T, Takahashi S, Ishimori K, Morishima I, et al. (2004) Collapse and search dynamics of apomyoglobin folding revealed by submillisecond observations ofα-helical content and compactness. Proc Natl Acad Sci U S A 101: 1171–1176. PMID:14711991
49. Tirado-Rives J, Jorgensen WL (1993) Molecular dynamics simulations of the unfolding of apomyoglo-bin in water. Biochemistry 32: 4175–4184. PMID:8476847
50. Onufriev A, Case DA, Bashford D (2003) Structural details, pathways, and energetics of unfolding apo-myoglobin. J Mol Biol 325: 555–567. PMID:12498802
51. Dasmeh P, Kepp KP (2013) Unfolding simulations of holomyoglobin from four mammals: identification of intermediates and beta-sheet formation from partially unfolded states. PLoS One 8: e80308. doi:10. 1371/journal.pone.0080308PMID:24386077
52. Xu M, Beresneva O, Rosario R, Roder H (2012) Microsecond folding dynamics of apomyoglobin at acidic pH. J Phys Chem B 116: 7014–7025. doi:10.1021/jp3012365PMID:22475221
53. Teale FW (1959) Cleavage of the haem-protein link by acid methylethylketone. Biochim Biophys Acta 35: 543. PMID:13837237
54. Tanford C (1970) Protein denaturation. Part C. Theoretical models for the mechanism of denaturation. Adv Protein Chem 24: 1–95. PMID:4912353
55. Pace CN (1986) Determination and analysis of urea and guanidine hydrochloride denaturation curves. Methods Enzymol 131: 266–280. PMID:3773761
56. Santoro MM, Bolen DW (1988) Unfolding free energy changes determined by the linear extrapolation method. 1. Unfolding of phenylmethanesulfonyl alpha-chymotrypsin using different denaturants. Bio-chemistry 27: 8063–8068. PMID:3233195
57. Chen YH, Yang JT, Chau KH (1974) Determination of the helix and beta form of proteins in aqueous solution by circular dichroism. Biochemistry 13: 3350–3359. PMID:4366945
58. Sabelko J, Ervin J, Gruebele M (1998) Cold-denatured ensemble of apomyoglobin: Implications for the early steps of folding. J Phy Chem B 102: 1806–1819.