www.atmos-chem-phys.net/9/207/2009/
© Author(s) 2009. This work is distributed under the Creative Commons Attribution 3.0 License.
Chemistry
and Physics
In situ measurements of speciated atmospheric mercury and the
identification of source regions in the Mexico City Metropolitan
Area
A. P. Rutter1, D. C. Snyder1, E. A. Stone1, J. J. Schauer1,2, R. Gonzalez-Abraham3, L. T. Molina3,4, C. M´arquez5, B. C´ardenas5, and B. de Foy3,6
1Environmental Chemistry and Technology Program, Univ. of Wisconsin, 660 N. Park Street, Madison, WI 53706, USA 2Wisconsin State Laboratory of Hygiene, Univ. of Wisconsin, 2601 Agriculture Drive, Madison, WI 53718, USA 3Molina Center for Energy and the Environment 2, 3262 Holiday Ct. Suite 201, La Jolla, CA 92037, USA 4Massachusetts Institute of Technology, Cambridge, MA 02319, USA
5Centro Nacional de Investigaci´on y Capacitaci´on Ambiental CENICA, Instituto Nacional de Ecolog´ıa-SEMARNAT.,
Perif´erico 5000, Mexico City, 04530, Mexico
6Department of Earth and Atmospheric Sciences, Saint Louis University, 3642 Lindell Blvd., St. Louis, MO 63108, USA
Received: 16 May 2008 – Published in Atmos. Chem. Phys. Discuss.: 10 July 2008 Revised: 2 October 2008 – Accepted: 29 October 2008 – Published: 13 January 2009
Abstract. In order to expand the currently limited
under-standing of atmospheric mercury source-receptor relation-ships in the Mexico City Metropolitan Area, real time mea-surements of atmospheric mercury were made at a downtown urban site, and a rural site on the outskirts of Mexico City, during March 2006.
Numerous short-lived increases in particulate mercury (PHg) and reactive gaseous mercury (RGM) concentrations were observed at the urban site during the 17 day study, and less frequent increases in gaseous elemental mercury (GEM) concentrations were measured at both the urban and rural sites. The episodic increases observed were at-tributed to plume impacts from industrial point source emis-sions in and around Mexico City. Average concentra-tions and standard deviaconcentra-tions measured during the study were as follows: i) urban site; PHg=187±300 pg m−3,
RGM=62±64 pg m−3, GEM=7.2
±4.8 ng m−3, and; ii) rural
site; GEM=5.0±2.8 ng m−3.
Several source regions of atmospheric mercury to the ur-ban and rural sites were determined using Concentration Field Analysis, in which atmospheric mercury measure-ments were combined with back trajectory data to determine
Correspondence to:J. J. Schauer
(jjschauer@wisc.edu)
source regions. Only some source regions correlated to mer-cury emission sources listed in the Federal Pollutant Re-lease and Transfer Register, leaving the rest unaccounted for. Contributions of anthropogenic mercury point sources in and around Mexico City to concentration averages mea-sured at the urban site during the study were estimated to be: 93±3% of reactive mercury (PHg and RGM), and; 81±0.4% of GEM. Point source contributions to GEM measured at the rural site were 72±1%. GEM and reactive mercury (PHg+RGM) were not found to correlate with biomass burn-ing at either of the measurement sites.
1 Introduction
mercury levels than less urbanized regions due to high den-sities of energy production, industrial activities, and refuse incineration (Gabriel et al., 2005; Lynam and Keeler, 2005). The Mexico City Metropolitan Area (MCMA) is the sec-ond largest urban center in the world, has a high concen-tration of heavy industry, and is located in a basin at high altitude surrounded by mountains on three sides, which in-clude a volcano, a likely emission source of natural mercury (Bagnato et al., 2007). Weak synoptic forcing leads to weak winds and poor mixing at night that result in poor air quality (Chow et al., 2002; Molina and Molina, 2002). Given the poor air quality, concentration of industry, and the presence of a volcano in the basin, Mexico City atmospheric mercury concentrations are likely to be substantially increased over rural background concentrations. In addition, biomass burn-ing around the MCMA is common durburn-ing the dry months of January through June and several fires and hotspots were ac-tive during the MILAGRO (Megacities Initiaac-tive: Local and Global Research Observations) sampling campaign (Yokel-son et al., 2007), contributing substantially to the organic portion of atmospheric particles (Moffet et al., 2007; Stone et al., 2007). Previous publications have shown that wild-fires can re-emit previously deposited atmospheric mercury (Biswas et al., 2007; Cinnirella and Pirrone, 2006; Ebinghaus et al., 2007; Friedli et al., 2003; Friedli et al., 2004; Hall et al., 2006; Obrist et al., 2008; Weiss-Penzias et al., 2007), however it is not known how much biomass burning around the MCMA affects atmospheric mercury concentrations.
At the time of writing, valuable but limited speciated mea-surements of atmospheric mercury in the MCMA had been published (de la Rosa et al., 2004; Querol et al., 2008), leav-ing incomplete the understandleav-ing of atmospheric mercury source-receptor relationships. The speciation of atmospheric mercury emissions greatly affects the distance over which a point source can impact a receptor, and therefore is cen-tral to transport and fate of atmospheric mercury. Reactive mercury (RM; defined operationally as the sum of PHg and RGM) is typically considered to be predominantly oxidized mercury compounds which are semi-volatile and water solu-ble (Lin and Pehkonen, 1999; Schroeder and Munthe, 1998) meaning that source emissions will impact local ecosystems through wet and dry deposition (Lin and Pehkonen, 1999; Schroeder and Munthe, 1998; Seigneur et al., 2003) Previ-ous atmospheric modeling work has assumed that gasePrevi-ous elemental mercury (GEM) partitioned to elemental carbon (EC) in urban atmospheric aerosol, thereby contributing to PHg. To our knowledge the adsorption of GEM to atmo-spheric EC has not been demonstrated as a significant source of PHg. Likewise, several previous publications have pro-vided several examples where large episodic GEM increases in industrial exhaust plumes were not corroborated with con-comitant increases in PHg, indicating that GEM partitioning to atmospheric aerosol is unlikely to be an important process (Gabriel et al., 2005; Hall et al., 2006; Manolopoulos et al., 2007; Manolopoulos, 2006; Rutter et al., 2008; Yatavelli et
al., 2006). Once in anoxic aquatic environments it can be converted to the neurotoxin methylmercury and bioaccumu-late in the food chain (Clarkson, 1993; Jensen and Jernelov, 1969; Kainz et al., 2006; Schroeder and Munthe, 1998; Wiener et al., 2006; Wood, 1968). GEM on the other hand is volatile and oxidizes slowly allowing it to become a hemi-spherically well dispersed precursor for reactive mercury for-mation (Lin and Pehkonen, 1999; Schroeder and Munthe, 1998; Seigneur et al., 2004).
The aim of this study was to gain an initial understand-ing of the source-receptor relationships of atmospheric mer-cury in the MCMA to inform air quality management strate-gies, and the development of future emissions regulations. Measurements of RGM, PHg and GEM were made over 17 days using a real time ambient mercury analyzer located at a measurement site in the center of Mexico City (urban site). Real time measurements of GEM were made with a sepa-rate instrument at a site on the outskirts of the MCMA (rural site). Time series data, pollution roses, Concentration Field Analysis, and colocated measurements of the biomass burn-ing marker levoglucosan (Fraser and Lakshmanan, 2000; Si-moneit et al., 1999; SiSi-moneit and Elias, 2001), were used to determine the characteristics and locations of RGM, PHg and GEM emission sources that impacted the urban site and the rural site.
2 Experimental methods
2.1 Measurement site descriptions
The measurements presented in this study were performed during the Megacities Initiative: Local and Global Research Observations (MILAGRO) field study between the dates of 9–25 March 2006. The sample collection and analysis equip-ment was located at an urban site in Mexico City center at the Instituto Mexicano de Petr´oleo, (designated “T0”; Lat. 19◦29′21.4′′N, Lon. −99◦08′51.8′′W), and a rural site on the outskirts of the Mexico City at the Tec´amac Technologi-cal University (designated “T1”; Lat. 19.70◦, Lon.−98.98◦) 35 km from the urban site. At the urban site the equipment was placed on top of a two-storey building (#20) in the center of the premises. At the rural site filter samplers were located on an area of open ground on the northwest side of the uni-versity campus, 50 m away from the nearest structure. The real time mercury monitor was located inside of a semi-rigid tractor trailer, and sampled ambient air through a Teflon inlet tube suspended above the trailer roof.
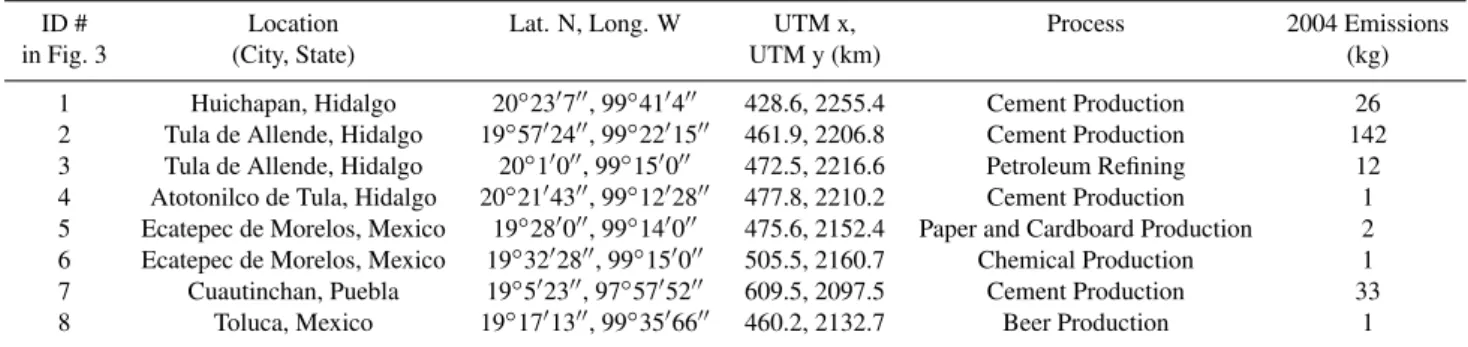
Table 1.Mercury point source locations, industrial process at the facility under Federal jurisdiction leading to the emissions, and kilograms of total mercury (i.e. GEM and/or RM) emitted during 2004. Facility and emission data were collected from the Pollutant Release and Transfer Register (SEMARNAT, 2006).
ID # Location Lat. N, Long. W UTM x, Process 2004 Emissions
in Fig. 3 (City, State) UTM y (km) (kg)
1 Huichapan, Hidalgo 20◦23′7′′, 99◦41′4′′ 428.6, 2255.4 Cement Production 26
2 Tula de Allende, Hidalgo 19◦57′24′′, 99◦22′15′′ 461.9, 2206.8 Cement Production 142
3 Tula de Allende, Hidalgo 20◦1′0′′, 99◦15′0′′ 472.5, 2216.6 Petroleum Refining 12
4 Atotonilco de Tula, Hidalgo 20◦21′43′′, 99◦12′28′′ 477.8, 2210.2 Cement Production 1
5 Ecatepec de Morelos, Mexico 19◦28′0′′, 99◦14′0′′ 475.6, 2152.4 Paper and Cardboard Production 2
6 Ecatepec de Morelos, Mexico 19◦32′28′′, 99◦15′0′′ 505.5, 2160.7 Chemical Production 1
7 Cuautinchan, Puebla 19◦5′23′′, 97◦57′52′′ 609.5, 2097.5 Cement Production 33
8 Toluca, Mexico 19◦17′13′′, 99◦35′66′′ 460.2, 2132.7 Beer Production 1
Emissions Inventory for the MCMA (CAM, 2006) revealed that industrial facilities were located throughout the MCMA, and that particularly dense clusters of facilities were located close to the urban site: 1) over a 10 km2area to the west; 2) 10 km to the east, and; 3) 15 km to the south. The rural site was located in an agricultural region, where there was much less heavy industry than surrounded the urban site. To the south of the campus there were residential areas with associ-ated vehicle traffic, and uncontrolled refuse incineration. 2.2 Real time ambient mercury measurements
Real time semi-continuous measurements of GEM, PHg, and RGM were made using the Tekran Ambient Mercury An-alyzer at the urban site “T0”. The Tekran AMA consisted of a potassium chloride (KCl) coated denuder (Tekran 1130) to collect RGM (Landis et al., 2002a), and a particle filter (Tekran 1135) directly after to collect PHg (Lu et al., 1998; Lynam and Keeler, 2002), followed by a cold vapor atomic fluorescence spectrometer (CVAFS; Tekran 2537A) to mea-sure GEM, which used gold amalgamation to preconcentrate the sample (Fitzgerald and Gill, 1979). The RGM and PHg modules were heated to 50◦C and mounted on a mast that el-evated the inlet of the Tekran 1.5 m above the nearest surface. The aerosol was drawn into the Tekran AMA at 10 liters per minute through an elutriator containing an inertial impactor that removed particles larger than 2.5µm in diameter. Col-lection of RGM and PHg was conducted for one hour, during which time measurements of GEM were made every 5 min. At the end of the sample collection period the RGM was re-covered from the KCl denuder by heating to 500◦C thereby thermally reducing the RGM to GEM. Downstream of the denuder a quartz chip pyrolyzer was heated to 900◦C to en-sure the complete conversion of any unreduced RGM com-pounds that were evolved during the heating of the denuder. The GEM evolved from the denuder was then purified us-ing soda lime and quantified usus-ing the CVAFS. The particu-late mercury was recovered from the particle filter by heating
it to 850◦C. The gaseous products released during the ther-mal desorption were pyrolyzed at 850◦C, and the evolved GEM was quantified. Previous studies have indicated that a negative artifact in PHg measurements may have occurred in measurement studies at ambient temperatures below 30◦C (Rutter et al., 2007; Rutter and Schauer, 2007a). The root cause of the artifact was not determined by these studies, and it is still unknown whether this phenomenon is applicable to all sampling locations, or just a select few. Furthermore, insufficient supporting data were available at the urban site to permit an accurate correction should the artifact have oc-curred during this study. Therefore, no attempts to adjust the PHg measurements collected during this study were made, although the reader should be aware that the PHg concen-trations reported here could be systematically low, especially during the cooler nighttime hours.
The real time GEM measurements were made at the rural site “T1” with a Tekran 2537A without either of the specia-tion modules attached to the inlet. Instead aerosol was passed through a particle filter and a soda lime trap. The inlet to the instrument was suspended above the roof of the semi trailer. 2.3 Concentration field analysis
collection period. The Concentration Field Analysis (CFA) was obtained by performing the following steps: i) the Resi-dence Time grids scaled by concentration were summed over the sample collection period; and, ii) normalized for pre-ferred wind transport directions by dividing by the sum of the Residence Time grids that had not been scaled by con-centration. In this way, source regions associated with high concentrations of PHg, RGM and GEM were indicated with high CFA values, whereas flow regions associated with clean air were indicated with low CFA values.
2.4 Levoglucosan collection and analyses
The contribution of biomass burning to atmospheric particles was measured by analyzing collected particles for levoglu-cosan (1,6-anhydro-β-D-glucopyranose), a specific marker for biomass burning (Schauer and Cass, 2000; Simoneit et al., 1999; Stone et al., 2008). The particulate matter was col-lected every day and night at the urban and rural sites on pre-cleaned quartz fiber filters in a Teflon coated medium vol-ume sampler (URG-3000-B, URG Corp., Chapel Hill, NC) in two 12-h segments: 06:00–18:00; and 18:00–06:00. The quartz fiber filters were pre-cleaned by baking at 550◦C for 15 h, and stored in foil lined Petri dishes sealed with Teflon tape. Substrates were stored at−20◦C after collection, and shipped from Mexico City to UW-Madison at 0◦C. Segments of the filters were cut out for use in the solvent extractions, and in most extractions segments of the 12-h substrates were combined to give 24-h composited samples. The only excep-tion was the 19 March 2006 sample collected at the urban site, for which only the 06:00 to 18:00 sample was avail-able. The samples were analyzed for levoglucosan using the method described in previous publications (Nolte et al., 2002; Sheesley et al., 2004; Stone et al., 2008) and so will be only briefly discussed here. The filters were spiked with an internal standard of isotopically labeled levoglucosan−13C6
(Cambridge Isotope Laboratories, Andover, MA). The lev-oglucosan was extracted from the filters using a soxhlet extraction with dimethyl chloride (CH2Cl2) and methanol
(CH3OH) solvents (Sheesley et al., 2004). The extracts
were concentrated by rotary evaporation and by passing ni-trogen over the top of the extract. The aliquots were deriva-tized with N,O-bistrimethylsilyl)trifluoro-acetamide with 1% trimethylchlorosilane (Fluka, Buchs, Switzerland) to con-vert all of the hydroxyl functional groups into trimethylsilyl ethers, thereby greatly increasing the volatility of the lev-oglucosan. The aliquots were sealed and heated to 70◦C for 3 h to complete the derivatization, after which the sam-ples were immediately analyzed. The components of each extract were separated using a 6890N Network Gas Chro-matograph (GC) system and analyzed using a 5973 Mass Selective Detector (Agilent Technologies, Santa Clara, CA) (Nolte et al., 2002). The GC column was a model HP-5MS (30 mm×0.25 mm×0.25µm; Hewlett Packard, Palo Alto, CA). The oven temperature profile started with a 10 min
hold at 65◦C, after which the temperature was increased at 10◦C/min for 26.50 min until it reached 300◦C. The temper-ature was then held at 300◦C for the next 23.50 min. The limit of detection was defined as 3 times the standard devia-tion of the average of the blanks, which was 25 ng m−3. All of the samples were well above the detection limit. Uncer-tainties in the levoglucosan concentrations were represented by the quadrative sum of 3 times the standard deviation of the analytical blank averages, and the dominant measure-ment uncertainty, which was the±20% QAQC constraint for the recovery of internal standards added to the sample before extraction and derivatization. All of the samples were well above the detection limit which was quantified as twice the standard deviation of the analytical blanks.
2.5 Meteorological data
Wind direction and temperature measurements were made at the urban site and the rural site using Model WXT510 Vaisala Weather Transmitters (Woburn, MA). Data was collected at 1 Hz and reported as 2 min averages.
3 Results and discussion
3.1 Characterization of plume impacts at the urban and ru-ral sites
Reactive mercury (RM; sum of PHg and RGM) and gaseous elemental mercury (GEM) were measured semi-continuously between 9 March 2006, 00:00 (Central Stan-dard Time) and 25 March 2006, 12:00 at the urban site. GEM was measured at the rural site between 9 March 2006, 00:00 and 25 March 2006, 23:59. Time series plots of these mea-surements are presented in Fig. 1a, b, and c. The RM con-centrations (a) were measured as hourly averages every other hour. The GEM concentrations at the urban site (b) were measured as 5 min averages during the hours when RM sam-ples were being collected. GEM concentrations at the rural site (c) were measured as 5 minute averages throughout the sample collection period.
Con
centrati
o
n (p
g m
-3)
0 500 1000 1500 2000 2500
Reactive Mercury (Urban)
C
o
n
centration
(n
g m
-3)
0 20 40 60 80 100 120
Gaseous Elemental Mercury (Urban)
1
2 3 4
5 6
78 9
10 11
12
13 14
15 16 17 18a
19
5
9 12
14a 20
3/8/2006 3/9/2006 3/10/2006 3/11/2006 3/12/2006 3/13/2006 3/14/2006 3/15/2006 3/16/2006 3/17/2006 3/18/2006 3/19/2006 3/20/2006 3/21/2006 3/22/2006 3/23/2006 3/24/2006 3/25/2006 3/26/2006
Concent
rat
ion (ng m
-3)
0 10 20 30 40
Gaseous Elemental Mercury (Rural)
A B
E C
D
G
F J
L
K HI 14b
18b
a
b
c
Fig. 1. Time series plots of reactive mercury at the urban site(a), gaseous elemental mercury at the urban site(b), and gaseous el-emental mercury at the rural site(c). Reactive mercury measure-ments were one hour averages made every other hour. Gaseous elemental mercury measurements at the urban site were 5 min av-erages made during the hour periods when reactive mercury was measured. Gaseous elemental mercury measurements at the rural site were 5 min averages made throughout the sample collection pe-riod. Plumes are annotated with identification numbers (the urban site) and letters (the rural site).
only four of the 19 RM plume events correlated with substan-tial GEM plume events, indicating that most of the plumes came from sources that emitted enough RM to produce large impacts on atmospheric concentrations, but that did not emit enough GEM to change concentrations significantly above the urban background. It is also possible that the speciation of emissions from some facilities may have changed with time.
It is pertinent at this point to understand how the diurnal meteorological patterns within the MCMA worked in con-cert with emission sources to influence the mercury concen-trations measured at the urban and rural sites. A thorough review of the meteorology during the MILAGRO campaign was presented by (de Foy et al., 2008; Fast et al., 2007) who revealed that air flow to the urban and rural sites on most days could be generally divided into three periods: 1) flow from the north and west between midnight and 07:00; 2) flow
Plume Identifier
1 2 3 4 5 6 7 8 9 10 11 12 13 14 15 16 17 18 19
Conce
n
tration (pg m
-3)
0 200 400 600 800 1000 1200 1400 1600 1800
Particulate mercury (Urban) Reactive gaseous mercury (Urban)
Fig. 2.Absolute concentrations of particulate mercury and reactive gaseous mercury measured at the maximum of each plume event observed at the urban site.
predominantly from the east with some air masses approach-ing from the north, north east, and southeast between 07:00 and early afternoon; and 3) flow from the southeast, south or north throughout the afternoon until midnight. Most of the plume incursions seen at the urban site occurred at night, consistent with transport of emissions from the industrial sources to the north and west. Exceptions to this were plumes 15 and 16 (Fig. 1) which were associated with transport from the south and southeast. The majority of plume incursions at the rural site occurred during the mid to late morning which were normally associated with changing wind patterns and were either due to transport from the industrial sources to the north or from the sources inside or to the south and south east of the MCMA.
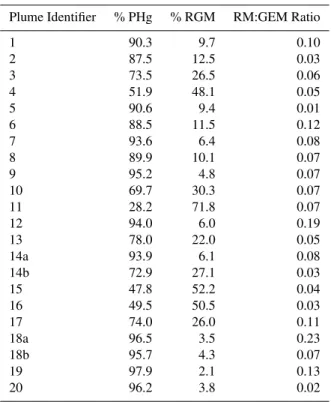
Table 2. The percentages of particulate mercury and reactive gaseous mercury at plume event maxima.
Plume Identifier % PHg % RGM RM:GEM Ratio
1 90.3 9.7 0.10
2 87.5 12.5 0.03
3 73.5 26.5 0.06
4 51.9 48.1 0.05
5 90.6 9.4 0.01
6 88.5 11.5 0.12
7 93.6 6.4 0.08
8 89.9 10.1 0.07
9 95.2 4.8 0.07
10 69.7 30.3 0.07
11 28.2 71.8 0.07
12 94.0 6.0 0.19
13 78.0 22.0 0.05
14a 93.9 6.1 0.08
14b 72.9 27.1 0.03
15 47.8 52.2 0.04
16 49.5 50.5 0.03
17 74.0 26.0 0.11
18a 96.5 3.5 0.23
18b 95.7 4.3 0.07
19 97.9 2.1 0.13
20 96.2 3.8 0.02
temperature (Rutter and Schauer, 2007a) and plume tem-perature, and the kinetics of reactive mercury repartitioning upon thermal equilibration with the atmosphere; ii) the RM compound and particle composition (Rutter and Schauer, 2007b); iii) operational conditions of the generating process, i.e. combustion conditions and fuel composition (Pavlish et al., 2003); and, iv) the possibility that different source pro-cesses might generate similar PHg/RGM speciation ratios. As mentioned above reactive mercury is semi-volatile (Lan-dis et al., 2002a; Lin and Pehkonen, 1999; Lynam and Keeler, 2005; Schroeder and Munthe, 1998) and ambient tempera-ture affects the distribution of reactive mercury between the gas and particle phases (Rutter and Schauer, 2007a). There-fore, care should be exercised in comparing the distributions of PHg and RGM between plumes. Events 11, 15 and 16 were measured in the middle of the temperature range ob-served during the field study (9–29◦C) and so the predomi-nance of RGM over PHg could either be due to the plume not yet having reached thermal equilibrium, or the other factors mentioned in ii)–iv).
3.2 Identification of mercury source regions
Figure 1 revealed that the urban site and the rural site were impacted by plumes from point sources in and around the Mexico City Metropolitan Area (MCMA). The objectives of this study were to identify source regions of atmospheric
mercury to the urban and rural sampling sites, and to pro-vide quantitative estimates of how atmospheric concentra-tions were affected by anthropogenic emission sources lo-cated in these regions. The latter objective will be pursued in the next section. The MCMA Emissions Inventory (CAM, 2006) revealed that industrial facilities were located through-out the city and surrounding region, as presented above in the site description section. The 2004 Federal Pollutant Re-lease and Transfer Register (PRTR; SEMARNAT, 2006) re-ported total mercury emissions from known point sources in the MCMA, giving no speciation information (Table 1).
UTM (km) 2100 2120 2140 2160 2180 2200 2220 2240 2080 2060 2260 UTM (km)
420440460480500520540560580600 1.0 0.0 0.2 0.4 0.6 0.8 Reactive Mercury at T0 (Urban)
UTM (km) 2100 2120 2140 2160 2180 2200 2220 2240 2080 2060 2260 UTM (km)
420 440460480500520540560580600 1.0 0.0 0.2 0.4 0.6 0.8 Particulate Mercury at T0 (Urban)
UTM (km) 2100 2120 2140 2160 2180 2200 2220 2240 2080 2060 2260 UTM (km)
420440460480500520540560580600 1.0 0.0 0.2 0.4 0.6 0.8 Reactive Gaseous Mercury at T0 (Urban)
UTM (km) 2100 2120 2140 2160 2180 2200 2220 2240 2080 2060 2260 UTM (km)
420 440460480500520540560580 600 1.0 0.0 0.2 0.4 0.6 0.8 Gaseous Elemental Mercury at T0 (Urban)
UTM (km) 2100 2120 2140 2160 2180 2200 2220 2240 2080 2060 2260 UTM (km) UTM (km)
420440460480500520540560580600 1.0 0.0 0.2 0.4 0.6 0.8 Gaseous Elemental Mercury at T1 (Rural)
b
a
c
e
d
Relative contribution of source region to average concentrations measured
during study Relative contribution of source region to average concentrations measured
during study
Measurement Sites
T0 = Urban Site
T1 = Rural Site on
Outskirts of Mexico City
T2 = Rural Site Downwind
of Mexico City
Sources (see Tab. 2) 1, 2, 4, & 7 = Cement Works
3 = Petroleum Refinery 5 = Paper and Cardboard
Factory 6 = Chemical Factory
8 = Brewery
1 2 4 6 7 7 8 8 3 5 1 2 4 6 7 8 3 5 1 2 4 6 7 8 3 5 1 2 4 6 7 8 3 5 1 2 4 6 7 8 3 5 Toluca Pachuca Puebla Tula de Allende Atotonilco de Tula Toluca Pachuca Puebla Tula de Allende Atotonilco de Tula Toluca Pachuca Puebla Tula de Allende Atotonilco de Tula Toluca Pachuca Puebla Tula de Allende Atotonilco de Tula Toluca Pachuca Puebla Tula de Allende Atotonilco de Tula
Fig. 3.Concentration Field Analysis for reactive mercury(a), particulate mercury(b), reactive gaseous mercury(c), and gaseous elemental mercury at the urban site(d), along with gaseous elemental mercury at the rural site(e). Each figure is annotated with point source locations from the 2004 Pollutant Release and Transfer Register (Table 2).
Figure 3a presents the CFA results for RM which were broken down into the PHg and RGM components in Fig. 3b and c, respectively. Collectively these figures revealed source regions in the following areas: (N) to the north and north-west located very close to the cities of Tula de Allende, and Atotonilco de Tula, and another area to the north east close to Pachuca, and the measurement site T2 (outside of the MCMA); (E) to the east of the urban site; (SE) at vari-ous distances to the south east of the urban site; (SW) to the southwest of the urban site, and; (W) to the west (both inside and outside of the Federal District).
The signatures from Region N were characteristic of longer range transport from well defined sources and were likely due mostly to the cement works at Tula de Allende, Atotonilco de Tula, and Huichapan in Hidalgo State. The area to the northeast appears to also host a point source of RM in a location that was consistent with the city of Pachuca, but no such source was listed in the PRTR for this area, or for Veracruz-Llave, the next state to the northeast.
Source Region E contained source regions close to the ur-ban site which could have been due to the chemical man-ufacturing at Ecatepec de Morelos, Mexico State, but were difficult to distinguish above the strong source signatures from source region N. There appeared to be an additional source region located in the valley to the east of the Federal District which was not listed in the PRTR, but was consistent with the locations of several small towns.
Popocatepetl to the urban site. The industrial pocket 10– 15 km south east of the urban site reported in the MCMA Emissions Inventory (CAM, 2006) correlated with PHg and RGM source signatures in Fig. 3b and c. However, this area was located underneath the trajectory of the Puebla/Volcano plume, making if difficult to assess the origin of these signa-tures.
Source Region SW to the southwest of the urban site was thought to be due to unregistered mercury sources in the Vallejo industrial area, and the southern region of the MCMA.
Source Region W was composed of a large area to the west of the urban site which encompassed the Vallejo industrial district, Toluca, the Toluca Industrial Park, and several small cities west of 450 km UTM and north of 2160 km UTM. A registered paper and cardboard manufacturing business cor-responded well with source signatures immediately west of the urban site, and a brewery, situated in the Toluca Indus-trial Park correlated reasonably well with a source located at UTM coordinates 470 km, 2130 km. However, many other source signatures detected in Region W were not registered in the PRTR, and appeared to be located predominantly in the Vallejo industrial district, and the previously mentioned cities to the west and northwest of the MCMA.
Figure 3d shows potential source regions identified by CFA for GEM plume impacts at the urban site. The Source Regions N, E, SW, and W reported for RM, PHg and RGM in Fig. 3a–c were also observed for GEM in Fig. 3d. GEM plume impacts at the urban site were dominated by emissions transported from the sources in Regions N and W. Trans-port of GEM from Region SE was suggested, but was not as strong as indicated by Fig. 3a–c. The source regions indi-cated for GEM and RM by the CFAs agreed well with each other, implying that the majority of GEM and RM source emissions occurred in the same areas, even if they did not always originate from the same facilities.
Figure 3e shows the CFA results for GEM measurements made at the rural site (T1). Source Region W was combined with Source Region SW because no distinction between the two regions could be made from the rural site. The data pre-sented corroborated Source Regions N, SE, S, and W. How-ever the source signatures to the near west and in Regions SE and SW were much stronger and more extensive, than in Fig. 3d, whilst Source Region (E) looked more widespread. Furthermore, the exact locations of the emission sources in Region N differed slightly between the urban and rural GEM analyses. All of the differences were probably due to two factors: i) the GEM data set at the urban site only contained measurements during every other hour, whereas at the ru-ral site GEM measurements were made continuously; and, ii) the air masses arriving at the rural site may have been influenced by the different areas of the MCMA than those arriving at the urban site, providing a different perspective of GEM emission sources throughout the basin. Overall the GEM CFA analyses between the urban site and the rural site
both qualitatively identified the same source regions of GEM throughout the MCMA, providing confidence in the analyti-cal method.
3.3 Directional source apportionment of mercury emis-sions to average concentrations
A starting point of an air quality management strategy for mercury is to determine which sources are contributing the most to observed mercury concentrations and concentrate mitigation efforts on those first. This study builds on the basis provided by the PRTR for such a strategy by present-ing a source apportionment of speciated mercury concentra-tion measurements made at the urban and rural sites. The source apportionment calculations were performed using the method described in (Rutter et al., 2008) and will only be mentioned briefly here. Plume impingements from point sources were identified as increases in atmospheric concen-trations above a threshold value determined to be indicative of the regional background. A review of GEM monitoring data collected throughout the western northern hemisphere (Rural values in Table 3); (Ebinghaus et al., 2002; Kim et al., 2005; Slemr et al., 2003; Swartzendruber et al., 2006; Weiss-Penzias et al., 2006) revealed that GEM concentra-tions averaged at about 1.5±0.2 ng m-3 (1SD) when no lo-cal anthropogenic or natural sources (point or area) were in-fluencing the air mass. This concentration therefore repre-sents the western northern hemispheric background. When minimum hourly concentration averages measured during this study (urban GEM=2.0 ng m−3; rural GEM=1.8 ng m−3)
were compared to the western northern hemisphere back-ground, it was decided that the rural and urban sites were too frequently influenced by mercury emissions from indus-try or re-emitted mercury from environmental surfaces to extract reliable threshold concentrations from the data sets. Re-emitted mercury was thought to be predominantly re-cently deposited mercury, and therefore primarily anthro-pogenic in origin, rather than a historic legacy of deposi-tion from Popocatepetl Volcano which would have been pro-gressively buried in soil columns with the passing of time. To obtain a GEM threshold concentration that represented the regional background in Mexico, published measurements made outside of Mexico City at a rural location and pa-cific coastal location were used (de la Rosa et al., 2004). The GEM threshold concentration was determined to be 1.4±0.1 ng m−3, which was not statistically different than
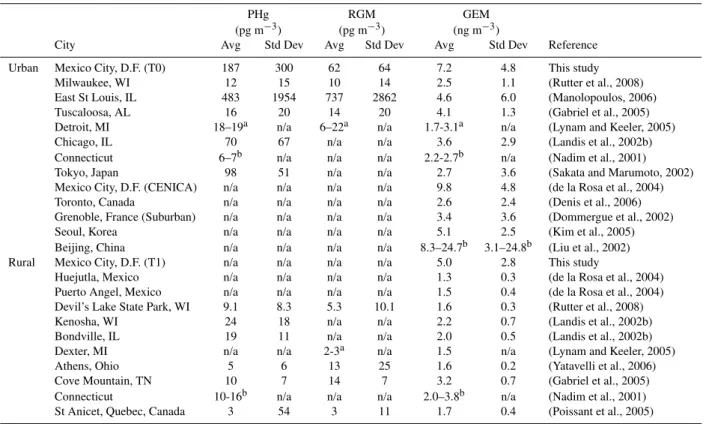
Table 3. Average particulate mercury (PHg) and reactive gaseous mercury (RGM) concentrations (including plume impacts) in rural and urban locations. Uncertainties are represented with 1 standard deviation.
PHg RGM GEM
(pg m−3) (pg m−3) (ng m−3)
City Avg Std Dev Avg Std Dev Avg Std Dev Reference
Urban Mexico City, D.F. (T0) 187 300 62 64 7.2 4.8 This study
Milwaukee, WI 12 15 10 14 2.5 1.1 (Rutter et al., 2008)
East St Louis, IL 483 1954 737 2862 4.6 6.0 (Manolopoulos, 2006)
Tuscaloosa, AL 16 20 14 20 4.1 1.3 (Gabriel et al., 2005)
Detroit, MI 18–19a n/a 6–22a n/a 1.7-3.1a n/a (Lynam and Keeler, 2005)
Chicago, IL 70 67 n/a n/a 3.6 2.9 (Landis et al., 2002b)
Connecticut 6–7b n/a n/a n/a 2.2-2.7b n/a (Nadim et al., 2001)
Tokyo, Japan 98 51 n/a n/a 2.7 3.6 (Sakata and Marumoto, 2002)
Mexico City, D.F. (CENICA) n/a n/a n/a n/a 9.8 4.8 (de la Rosa et al., 2004)
Toronto, Canada n/a n/a n/a n/a 2.6 2.4 (Denis et al., 2006)
Grenoble, France (Suburban) n/a n/a n/a n/a 3.4 3.6 (Dommergue et al., 2002)
Seoul, Korea n/a n/a n/a n/a 5.1 2.5 (Kim et al., 2005)
Beijing, China n/a n/a n/a n/a 8.3–24.7b 3.1–24.8b (Liu et al., 2002)
Rural Mexico City, D.F. (T1) n/a n/a n/a n/a 5.0 2.8 This study
Huejutla, Mexico n/a n/a n/a n/a 1.3 0.3 (de la Rosa et al., 2004)
Puerto Angel, Mexico n/a n/a n/a n/a 1.5 0.4 (de la Rosa et al., 2004)
Devil’s Lake State Park, WI 9.1 8.3 5.3 10.1 1.6 0.3 (Rutter et al., 2008)
Kenosha, WI 24 18 n/a n/a 2.2 0.7 (Landis et al., 2002b)
Bondville, IL 19 11 n/a n/a 2.0 0.5 (Landis et al., 2002b)
Dexter, MI n/a n/a 2-3a n/a 1.5 n/a (Lynam and Keeler, 2005)
Athens, Ohio 5 6 13 25 1.6 0.2 (Yatavelli et al., 2006)
Cove Mountain, TN 10 7 14 7 3.2 0.7 (Gabriel et al., 2005)
Connecticut 10-16b n/a n/a n/a 2.0–3.8b n/a (Nadim et al., 2001)
St Anicet, Quebec, Canada 3 54 3 11 1.7 0.4 (Poissant et al., 2005)
arange of medians reported
brange of averages and standard deviations reported across multiple sites
and RGM=14 pg m−3) from publications listed in Table 3
(Gabriel et al., 2005; Poissant et al., 2005). Averages were calculated from these minimum and maximum values which were used in a sensitivity test on the calculation to estimate uncertainties.
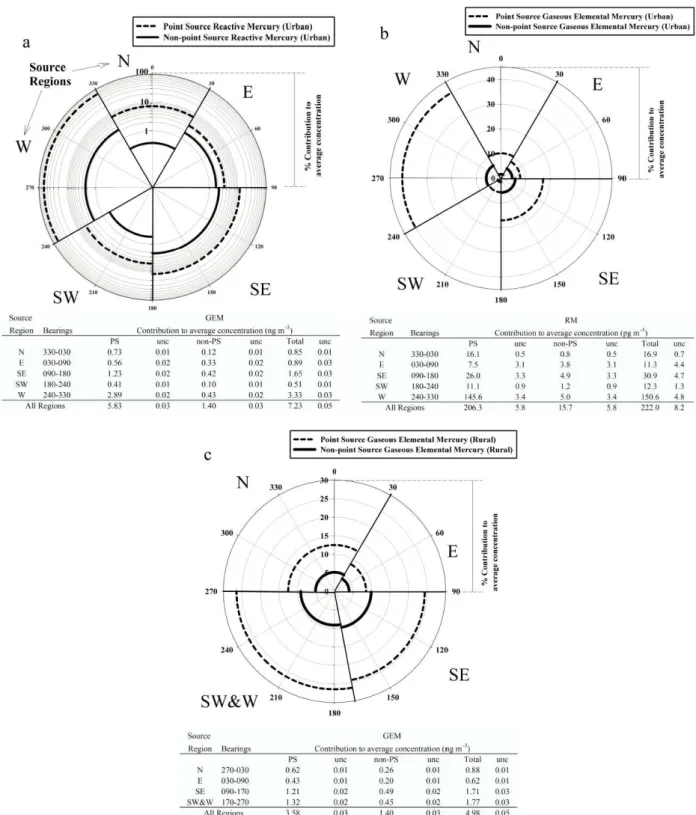
Pollution roses presented in Fig. 4a, b, and c, illustrate the percentage of mercury species that arrived at the measument sites from wind directions consistent with the source re-gions and ingress trajectories identified by the Concentration Field Analysis (Fig. 3a–e). Tables accompany the pollution roses to convey the source region impacts broken down as point source and non-point source contributions to the aver-age concentrations measured during the 17-day study period. The uncertainties presented in each table under columns la-beled “unc” are the results of the previously described sensi-tivity analyses. The calculations revealed that the largest in-fluxes of RM and GEM to the urban site (Fig. 4a and b) origi-nated from Source Regions SE and W. Emissions from these regions contributed to 82±2% of the average RM concen-tration, and 63±1% of the average GEM measured concen-tration at the urban site. A comparison between the source apportionment of mercury impacts by source region and the 2004 PRTR mercury emission rates by facility indicates that
0 100 200 300 400 500 600 React ive Mer cu ry Co ncentra tion ( p g m -3) 0 200 400 600 800 1000
Reactive mercury (Urban)
0 100 200 300 400 500 600
G a seous Elem en tal Me rc ury C o n ce n tr at ion ( n g m -3) 0 2 4 6 8 10 12 14 16
Gaseous Elemental Mercury (Urban) slope = -0.4±0.3 intercept = 320±67 r2 = 0.07
slope = -0.01±0.005 intercept = 9±1 r2 = 0.15
Levoglucosan Concentration (ng m-3)
0 50 100 150 200 250 300 350
G a seous Elem en tal Me rc ury C o n ce n tr at ion ( n g m -3) 0 2 4 6 8
Gaseous Elemental Mercury (Rural) slope = 0.003±0.004
intercept = 5.3±0.6 r2 = 0.07
a
b
c
95% Confidence Limits
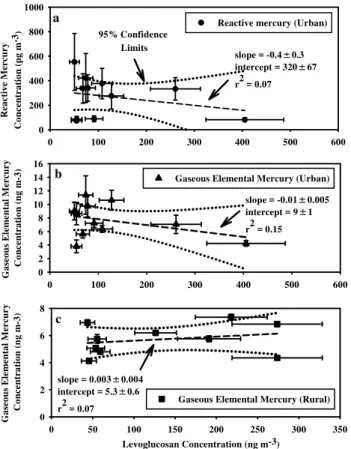
Fig. 5.Levoglucosan plotted with reactive mercury(a)and gaseous elemental mercury(b)at the urban site, and gaseous elemental mer-cury at the rural site(c). The uncertainties in levoglucosan represent the instrument precision. The uncertainties in reactive mercury and elemental mercury are standard errors.
3.4 Biomass burning as a source of atmospheric mercury in the MCMA
Previous published studies performed outside Mexico demonstrated biomass burning to be sources of GEM and PHg (Ebinghaus et al., 2007; Friedli et al., 2003, 2004; Hall et al., 2006). During the MILAGRO measurement campaign there were numerous wildfires burning around the MCMA (Yokelson et al., 2007), and two publications showed that biomass burning contributed substantially to the organic por-tion of aerosol particles (Moffet et al., 2007; Stone et al., 2007). Furthermore, cottage industries such as adobe tile and brick manufacture could constitute unregistered urban point sources of RM and GEM, due to potentially significant mercury contents of biomass fuels (Friedli et al., 2007; Raga et al., 2001). Figure 5a, b and c, investigated whether the elevated concentrations of RM and GEM at the urban site and the rural site were related to wildfires or biofuels use by examining correlations with levoglucosan
(1,6-anhydro-β-D-glucopyranose), a marker compound for biomass burn-ing (Schauer and Cass, 2000; Simoneit et al., 1999; Stone et al., 2007). Neither RM nor GEM showed correlations
with levoglucosan that were statistically different than 0 at the 95% confidence limit at the urban or rural sites. In ad-dition, Yokelson et al. (2007) published times during which biomass burning plumes were sampled at the urban site, none of which corresponded to significant episodic increases in GEM or RM species at the urban site. Therefore, the major-ity of RM and GEM concentrations detected at the urban site were due to sources other than biomass burning. PHg and GEM concentrations associated with biomass fires reported in published studies were typically between 10–80 pg m−3 and less than 0.6 ng m−3, respectively at distances greater than 3 km from the fires (Friedli et al., 2003; Hall et al., 2006). Plumes containing PHg and GEM concentrations of these magnitudes could easily have been obscured by the background concentrations observed in the MCMA (Fig. 1).
4 Conclusions
Industrial point sources of atmospheric mercury in and around the MCMA were observed to substantially affect at-mospheric mercury concentrations on a daily basis during the measurement study. Point sources included in the 2004 Federal Pollutant Release and Transfer Register (PRTR) cor-related well with source regions determined using Concen-tration Field Analysis, illustrating the impact of facilities in and around Mexico City on atmospheric mercury measure-ments at the urban and rural sites. Extensive source re-gions were also identified (primarily to the west of the ur-ban site) that did not correlate to entries in the PRTR and which contributed substantially to average reactive mercury and gaseous elemental mercury concentrations at the urban site. This issue will need to be investigated, and the mercury emission inventory appropriately revised to include sources under Federal, State, and Municipal jurisdiction, so that suc-cessful air quality management strategies for atmospheric mercury can be formulated and implemented in Mexico City. Measurements indicated that mercury was predominantly speciated in the reactive form in most plumes impacting the urban site, although plume impacts of GEM were also ob-served at both measurement sites. Given the big difference in deposition characteristics of RM and GEM it would be prudent for future iterations of the PRTR to speciate point source emissions of atmospheric mercury.
Finally, the Popocatepetl volcano may have augmented at-mospheric mercury concentrations in air masses impinging upon the urban and rural sites from the southeast. A more specialized study would need to be done to quantify the im-pact of Popocatepetl in relation to anthropogenic emissions upwind of the volcano in relation to upwind anthropogenic emissions near Puebla.
Acknowledgements. This study was primarily funded by the National Science Foundation (grant 0514280; PI-Schauer), and US Environmental Protection Agency Science to Achieve Results
the CENICA teams would like to acknowledge support from the National Science Foundation (grant 0511803), the Mexico Metropolitan Environmental Commission and the National In-stitute of Ecology. We thank Jeffery Gaffney and Nancy Marley for providing meteorological data. Mike Caseley (Seajet Express Inc.) and Rafael Ramos (Ministerio del Medio Ambiente, Mexico) provided invaluable assistance with shipment logistics.
Edited by: J. Gaffney
References
Bagnato, E., Aiuppa, A., Parello, F., Calabrese, S., D’Alessandro, W., Mather, T. A., McGonigle, A. J. S., Pyle, D. M., and Wang-berg, I.: Degassing of gaseous (elemental and reactive) and par-ticulate mercury from Mount Etna volcano (Southern Italy), At-mos. Environ., 41, 7377–7388, 2007.
Biswas, A., Blum, J. D., Klaue, B., and Keeler, G. J.: Release of mercury from Rocky Mountain forest fires, Global Biogeochem. Cy., 21, GB1002, doi:10.1029/2006GB002696, 2007.
Chow, J. C., Watson, J. G., Edgerton, S. A., and Vega, E.: Chemical composition of PM2.5 and PM10 in Mexico City during winter 1997, Sci. Total Environ., 287, 177–201, 2002.
Cinnirella, S. and Pirrone, N.: Spatial and temporal distributions of mercury emissions from forest fires in Mediterranean region and Russian federation, Atmos. Environ., 40, 7346–7361, 2006. Clarkson, T. W.: Mercury – Major Issues in Environmental-Health,
Environ. Health Persp., 100, 31–38, 1993.
de Foy, B., Lei, W., Zavala, M., Volkamer, R., Samuelsson, J., Mel-lqvist, J., Galle, B., Mart´ınez, A.-P., Grutter, M., Retama, A., and Molina, L. T.: Modelling constraints on the emission inventory
and on vertical dispersion for CO and SO2in the Mexico City
Metropolitan Area using Solar FTIR and zenith sky UV spec-troscopy, Atmos. Chem. Phys., 7, 781–801, 2007,
http://www.atmos-chem-phys.net/7/781/2007/.
de Foy, B., Fast, J. D., Paech, S. J., Phillips, D., Walters, J. T., Coulter, R. L., Martin, T. J., Pekour, M. S., Shaw, W. J., Kasten-deuch, P. P., Marley, N. A., Retama, A., and Molina, L. T.: Basin-scale wind transport during the MILAGRO field campaign and comparison to climatology using cluster analysis, Atmos. Chem. Phys., 8, 1209–1224, 2008,
http://www.atmos-chem-phys.net/8/1209/2008/.
de la Rosa, D. A., Volke-Sepulveda, T., Solorzano, G., Green, C., Tordon, R., and Beauchamp, S.: Survey of atmospheric total gaseous mercury in Mexico, Atmos. Environ., 38, 4839–4846, 2004.
Denis, M. S., Song, X. J., Lu, J. Y., and Feng, X. B.: Atmospheric gaseous elemental mercury in downtown Toronto, Atmos. Envi-ron., 40, 4016–4024, 2006.
Dommergue, A., Ferrari, C. P., Planchon, F. A. M., and Boutron, C. F.: Influence of anthropogenic sources on total gaseous mercury variability in grenoble suburban air (France), Sci. Total Environ., 297, 203–213, 2002.
Ebinghaus, R., Kock, H. H., Coggins, A. M., Spain, T. G., Jennings, S. G., and Temme, C.: Long-term measurements of atmospheric mercury at Mace Head, Irish west coast, between 1995 and 2001, Atmos. Environ., 36, 5267–5276, 2002.
Ebinghaus, R., Slemr, F., Brenninkmeijer, C. A. M., van Velthoven, P., Zahn, A., Hermann, M., O’Sullivan, D. A., and Oram, D. E.:
Emissions of gaseous mercury from biomass burning in South America in 2005 observed during CARIBIC flights, Geophys. Res. Lett., 34, L08813, doi:10.1029/2006GL028866, 2007. Fast, J. D., de Foy, B., Acevedo Rosas, F., Caetano, E., Carmichael,
G., Emmons, L., McKenna, D., Mena, M., Skamarock, W., Tie, X., Coulter, R. L., Barnard, J. C., Wiedinmyer, C., and Madronich, S.: A meteorological overview of the MILAGRO field campaigns, Atmos. Chem. Phys., 7, 2233–2257, 2007, http://www.atmos-chem-phys.net/7/2233/2007/.
Fitzgerald, W. F. and Gill, G. A.: Sub-Nanogram Determination of Mercury by 2-Stage Gold Amalgamation and Gas-Phase Detec-tion Applied to Atmospheric Analysis, Anal. Chem., 51, 1714– 1720, 1979.
Fraser, M. P. and Lakshmanan, K.: Using levoglucosan as a molec-ular marker for the long-range transport of biomass combustion aerosols, Environ. Sci. Technol., 34, 4560–4564, 2000.
Friedli, H. R., Radke, L. F., Lu, J. Y., Banic, C. M., Leaitch, W. R., and MacPherson, J. I.: Mercury emissions from burning of biomass from temperate North American forests: laboratory and airborne measurements, Atmos. Environ., 37, 253–267, 2003. Friedli, H. R., Radke, L. F., Prescott, R., Li, P., Woo, J. H.,
and Carmichael, G. R.: Mercury in the atmosphere around Japan, Korea, and China as observed during the 2001
ACE-Asia field campaign: Measurements, distributions, sources,
and implications, J. Geophys. Res.-Atmos., 109, D19S25, doi:10.1029/2003JD004244, 2004.
Friedli, H. R., Radke, L. F., Payne, N. J., McRae, D. J., Lynham, T. J., and Blake, T. W.: Mercury in vegetation and organic soil at an upland boreal forest site in Prince Albert National Park, Saskatchewan, Canada, J. Geophys. Res.-Biogeosciences, 112, G01004, doi:10.1029/2005JG000061, 2007.
Gabriel, M. C., Williamson, D. G., Brooks, S., and Lindberg, S.: At-mospheric speciation of Southeastern mercury in two contrasting US airsheds, Atmos. Environ., 39, 4947–4958, 2005.
Hall, B. D., Olson, M. L., Rutter, A. P., Frontiera, R. R., Krabben-hoft, D. P., Gross, D. S., Yuen, M., Rudolph, T. M., and Schauer, J. J.: Atmospheric mercury speciation in Yellowstone National Park, Sci. Total Environ., 367, 354–366, 2006.
Jensen, S. and Jernelov, A.: Biological Methylation of Mercury in Aquatic Organisms, Nature, 223, 753–754, 1969.
Kainz, M., Telmer, K., and Mazumder, A.: Bioaccumulation pat-terns of methyl mercury and essential fatty acids in lacustrine planktonic food webs and fish, Sci. Total Environ., 368, 271– 282, 2006.
Kim, K. H., Ebinghaus, R., Schroeder, W. H., Blanchard, P., Kock, H. H., Steffen, A., Froude, F. A., Kim, M. Y., Hong, S. M., and Kim, J. H.: Atmospheric mercury concentrations from several observatory sites in the northern hemisphere, J. Atmos. Chem., 50, 1–24, 2005.
Landis, M. S., Stevens, R. K., Schaedlich, F., and Prestbo, E. M.: Development and characterization of an annular denuder methodology for the measurement of divalent inorganic reac-tive gaseous mercury in ambient air, Environ. Sci. Technol., 36, 3000–3009, 2002a.
Landis, M. S., Vette, A. F., and Keeler, G. J.: Atmospheric mercury in the Lake Michigan basin: Influence of the Chicago/Gary urban area, Environ. Sci. Technol., 36, 4508–4517, 2002b.
Liu, S. L., Nadim, F., Perkins, C., Carley, R. J., Hoag, G. E., Lin, Y. H., and Chen, L. T.: Atmospheric mercury monitoring survey in Beijing, China, Chemosphere, 48, 97–107, 2002.
Lu, J. Y., Schroeder, W. H., Berg, T., Munthe, J., Schneeberger, D., and Schaedlich, F.: A device for sampling and determination of total particulate mercury in ambient air, Anal. Chem., 70, 2403– 2408, 1998.
Lynam, M. M. and Keeler, G. J.: Comparison of methods for par-ticulate phase mercury analysis: sampling and analysis, Anal. Bioanal. Chem., 374, 1009–1014, 2002.
Lynam, M. M. and Keeler, G. J.: Automated speciated mercury measurements in Michigan, Environ. Sci. Technol., 39, 9253– 9262, 2005.
Lynam, M. M. and Keeler, G. J.: Source-receptor relationships for atmospheric mercury in urban Detroit, Michigan, Atmos. Envi-ron., 40, 3144–3155, 2006.
Manolopoulos, H., Schauer, J. J., Purcell, M. D., Rudolph, T. M., Olson, M. L., Rodger, B., and Krabbenhoft, D. P.: Lo-cal and regional factors affecting atmospheric mercury speci-ation at a remote locspeci-ation, J. Environ. Eng. Sci., 6, 491–501, doi:10.1139/s07-005, 2007.
Manolopoulos, H., Snyder, D. C., Schauer, J. J., Turner, J. R., Ol-son, M. L., and Krabbenhoft, D. P.: Sources of Speciated Atmo-spheric Mercury at a Residential Neighbourhood Impacted by Industrial Sources, Environ. Sci. Technol., 40, 5626–5633, 2006. Michalakes, J., Dudhia, J., Gill, D., Klemp, J., and Skamarock, W.: Design of a next-generation regional weather research and forecast model: Towards Teracomputing, World Scientific, River Edge, New Jersey, 117–124, 1998.
Moffet, R. C., de Foy, B., Molina, L. T., Molina, M. J., and Prather, K. A.: Measurement of ambient aerosols in northern Mexico City by single particle mass spectrometry, Atmos. Chem. Phys., 8, 4499–4516, 2008,
http://www.atmos-chem-phys.net/8/4499/2008/.
Molina, L. T. and Molina, M. J. E.: Air Quality in the Mexico Megacity: An Integrated Assessment, Kluwer Academic Pub-lishers, Boston, MA, USA, 2002.
Nadim, F., Perkins, C., Liu, S. L., Carley, R. J., and Hoag, G. E.: Long-term investigation of atmospheric mercury contamination in Connecticut, Chemosphere, 45, 1033–1043, 2001.
The Weather Research and Forecasting Model: http://wrf-model. org/index.php, last access: 4 March 2008.
Nolte, C. G., Schauer, J. J., Cass, G. R., and Simoneit, B. R. T.: Trimethylsilyl derivatives of organic compounds in source sam-ples and in atmospheric fine particulate matter, Environ. Sci. Technol., 36, 4273–4281, doi:10.1021/es020518y, 2002. Obrist, D., Moosmuller, H., Schurmann, R., Chen, L. W. A., and
Kreidenweis, S. M.: Particulate-phase and gaseous elemental mercury emissions during biomass combustion: Controlling fac-tors and correlation with particulate matter emissions, Environ. Sci. Technol., 42, 721–727, 2008.
Pavlish, J. H., Sondreal, E. A., Mann, M. D., Olson, E. S., Gal-breath, K. C., Laudal, D. L., and Benson, S. A.: State review of mercury control options for coal-fired power plants, Fuel Pro-cess. Technol., 82, 89–165, 2003.
Poissant, L., Pilote, M., Beauvais, C., Constant, P., and Zhang, H. H.: A year of continuous measurements of three atmospheric mercury species (GEM, RGM and Hg-p) in southern Quebec, Canada, Atmos. Environ., 39, 1275–1287, 2005.
Querol, X., Pey, J., Minguillon, M. C., Perez, N., Alastuey, A., Viana, M., Moreno, T., Bernabe, R. M., Blanco, S., Cardenas, B., Vega, E., Sosa, G., Escalona, S., Ruiz, H., and Artinano, B.: PM speciation and sources in Mexico during the MILAGRO-2006 Campaign, Atmos. Chem. Phys., 8, 111–128, 2008,
http://www.atmos-chem-phys.net/8/111/2008/.
Raga, G. B., Baumgardner, D., Castro, T., Martinez-Arroyo, A., and Navarro-Gonzalez, R.: Mexico City air quality: a qualitative review of gas and aerosol measurements (1960–2000), Atmos. Environ., 35, 4041–4058, 2001.
Rutter, A. P., Hanford, K. L., Zwers, J. T., Perillo-Nicholas, A. L., Schauer, J. J., Worley, C. A., Olson, M. L., and DeWild, J. F.: Evaluation of an Off-line Method for the Analysis OF At-mospheric Reactive Gaseous Mercury and Particulate Mercury, Journal of Air and Waste Management Association, 58(3), 377– 383, doi:10.3155/1047-3289.58.3.377, 2008.
Rutter, A. P. and Schauer, J. J.: The Effect of Temperature on the Gas-Particle Partitioning of Reactive Mercury in Atmospheric Aerosol, Atmos. Environ., 41, 8647–8657, 2007a.
Rutter, A. P. and Schauer, J. J.: The Impact of Aerosol Composition on the Particle to Gas Partitioning of Reactive Mercury, Environ. Sci. Technol., 41(11), 3934–3939, 2007b.
Rutter, A. P., Schauer, J. J., Lough, G. C., Snyder, D. C., Kolb, C. J., Von Klooster, S., Rudolf, T., Manolopoulos, H., and Olson, M. L.: A comparison of speciated atmospheric mercury at an urban center and an upwind rural location, J. Environ. Monitor., 10, 102–108, 2008.
Sakata, M. and Marumoto, K.: Formation of atmospheric particu-late mercury in the Tokyo metropolitan area, Atmos. Environ., 36, 239–246, 2002.
Schauer, J. J. and Cass, G. R.: Source apportionment of wintertime gas-phase and particle-phase air pollutants using organic com-pounds as tracers, Environ. Sci. Technol., 34, 1821–1832, 2000. Schroeder, W. H. and Munthe, J.: Atmospheric mercury – An
overview, Atmos. Environ., 32, 809–822, 1998.
Seigneur, C., Lohman, K., Vijayaraghavan, K., and Shia, R. L.: Contributions of global and regional sources to mercury depo-sition in New York State, Environ. Pollut., 123, 365–373, 2003. Seigneur, C., Vijayaraghavan, K., Lohman, K., Karamchandani, P.,
and Scott, C.: Global source attribution for mercury deposition in the United States, Environ. Sci. Technol., 38, 555–569, 2004. Pollutant Release and Transfer Register (Registro de Emisiones y
Transferencia de Contaminantes): http://app1.semarnat.gob.mx/ retc/index.php, last access: 8 January 2008, 2006.
Sheesley, R. J., Schauer, J. J., Bean, E., and Kenski, D.: Trends in secondary organic aerosol at a remote site in Michigan’s upper peninsula, Environ. Sci. Technol., 38, 6491–6500, 2004. Simoneit, B. R. T., Schauer, J. J., Nolte, C. G., Oros, D. R., Elias, V.
O., Fraser, M. P., Rogge, W. F., and Cass, G. R.: Levoglucosan, a tracer for cellulose in biomass burning and atmospheric particles, Atmos. Environ., 33, 173–182, 1999.
Simoneit, B. R. T. and Elias, V. O.: Detecting organic tracers from biomass burning in the atmosphere, Mar. Pollut. Bull., 42, 805– 810, 2001.
Slemr, F., Brunke, E. G., Ebinghaus, R., Temme, C., Munthe, J., Wangberg, I., Schroeder, W., Steffen, A., and Berg, T.: World-wide trend of atmospheric mercury since 1977, Geophys. Res. Lett., 30(4), 1516, doi:10.1029/2003gl016954, 2003.
Tech-nical note: The Lagrangian particle dispersion model FLEX-PART version 6.2, Atmos. Chem. Phys., 5, 2461–2474, 2005, http://www.atmos-chem-phys.net/5/2461/2005/.
Stone, E. A., Snyder, D. C., Sheesley, R. J., Sullivan, A. P., Weber, R. J., and Schauer, J. J.: Source apportionment of fine organic aerosol in Mexico City during the MILAGRO experiment 2006, Atmos. Chem. Phys., 8, 1249–1259, 2008,
http://www.atmos-chem-phys.net/8/1249/2008/.
Stone, E. A., Snyder, D. C., Sheesley, R. J., Sullivan, A. P., Weber, R. J., and Schauer, J. J.: Source apportionment of fine organic aerosol in Mexico City during the MILAGRO experiment 2006, Atmos. Chem. Phys., 8, 1249–1259, 2008,
http://www.atmos-chem-phys.net/8/1249/2008/.
Swartzendruber, P. C., Jaffe, D. A., Prestbo, E. M., Weiss-Penzias, P., Selin, N. E., Park, R., Jacob, D. J., Strode, S., and Jaegle, L.: Observations of reactive gaseous mercury in the free troposphere at the Mount Bachelor Observatory, J. Geophys. Res.-Atmos., 111, D24301, doi:10.1029/2006JD007415, 2006.
Weiss-Penzias, P., Jaffe, D. A., Swartzendruber, P., Dennison, J. B., Chand, D., Hafner, W., and Prestbo, E.: Observations of Asian air pollution in the free troposphere at Mount Bachelor Obser-vatory during the spring of 2004, J. Geophys. Res.-Atmos., 111, D10304, doi:10.1029/2005JD006522, 2006.
Weiss-Penzias, P., Jaffe, D., Swartzendruber, P., Hafner, W., Chand, D., and Prestbo, E.: Quantifying Asian and biomass burning sources of mercury using the Hg/CO ratio in pollution plumes observed at the Mount Bachelor Observatory, Atmos. Environ., 41, 4366–4379, 2007.
Wiener, J. G., Knights, B. C., Sandheinrich, M. B., Jeremiason, J. D., Brigham, M. E., Engstrom, D. R., Woodruff, L. G., Can-non, W. F., and Balogh, S. J.: Mercury in soils, lakes, and fish in Voyageurs National Park (Minnesota): Importance of atmo-spheric deposition and ecosystem factors, Environ. Sci. Technol., 40, 6261–6268, 2006.
Wood, J.: Synthesis of Methyl-mercury Compounds by Extracts of a Methanogenic Bacterium, Nature, 220, 173–174, 1968. Yatavelli, R. L. N., Fahrni, J. K., Kim, M., Crist, K. C., Vickers,
C. D., Winter, S. E., and Connell, D. P.: Mercury, PM2.5 and gaseous co-pollutants in the Ohio River Valley region: Prelim-inary results from the Athens supersite, Atmos. Environ., 40, 6650–6665, 2006.
Yokelson, R. J., Urbanski, S. P., Atlas, E. L., Toohey, D. W., Al-varado, E. C., Crounse, J. D., Wennberg, P. O., Fisher, M. E., Wold, C. E., Campos, T. L., Adachi, K., Buseck, P. R., and Hao, W. M.: Emissions from forest fires near Mexico City, Atmos. Chem. Phys., 7, 5569–5584, 2007,