Population Genetic Structure, Abundance,
and Health Status of Two Dominant Benthic
Species in the Saba Bank National Park,
Caribbean Netherlands:
Montastraea
cavernosa
and
Xestospongia muta
Didier M. de Bakker1,2*, Erik H. W. G. Meesters1, Judith D. L. van Bleijswijk2, Pieternella C. Luttikhuizen2, Hans J. A. J. Breeuwer3, Leontine E. Becking1,4,5*
1Institute for Marine Resources and Ecosystem Studies (IMARES), Wageningen UR, P.O. Box 57, 1780 AB, Den Helder, The Netherlands,2Royal Netherlands Institute for Sea Research, P.O. Box 59, 1790 AB, Den Burg, Texel, the Netherlands, and Utrecht University, Utrecht, The Netherlands,3Institute for
Biodiversity and Ecosystem Dynamics, University of Amsterdam, PO Box 94248, 1090 GE, Amsterdam, The Netherlands,4Marine Animal Ecology, Wageningen UR, PO Box 338, 6700 AH, Wageningen, The Netherlands,5Naturalis Biodiversity Center, Darwinweg 2, 2300 RA, Leiden, The Netherlands
*didier.debakker@wur.nl(DdB);lisa.becking@wur.nl(LEB)
Abstract
Saba Bank, a submerged atoll in the Caribbean Sea with an area of 2,200 km2, has attained international conservation status due to the rich diversity of species that reside on the bank. In order to assess the role of Saba Bank as a potential reservoir of diversity for the surround-ing reefs, we examined the population genetic structure, abundance and health status of two prominent benthic species, the coralMontastraea cavernosaand the sponge Xestos-pongia muta. Sequence data were collected from 34 colonies ofM.cavernosa(nDNA ITS1-5.8S-ITS2; 892 bp) and 68X.mutasponges (mtDNA I3-M11 partition of COI; 544 bp) on Saba Bank and around Saba Island, and compared with published data across the wider Caribbean. Our data indicate that there is genetic connectivity between populations on Saba Bank and the nearby Saba Island as well as multiple locations in the wider Caribbean, ranging in distance from 100s–1000s km. The genetic diversity of Saba Bank populations ofM.cavernosa(π= 0.055) andX.muta(π= 0.0010) was comparable to those in other
regions in the western Atlantic. Densities and health status were determined along 11 tran-sects of 50 m2along the south-eastern rim of Saba Bank. The densities ofM.cavernosa
(0.27 ind. m-2, 95% CI: 0.12
–0.52) were average, while the densities ofX.muta(0.09 ind. m-2, 95% CI: 0.02
–0.32) were generally higher with respect to other Caribbean locations. No disease or bleaching was present in any of the specimens of the coralM.cavernosa, however, we did observe partial tissue loss (77.9% of samples) as well as overgrowth (48.1%), predominantly by cyanobacteria. In contrast, the majority of observedX.muta (83.5%) showed signs of presumed bleaching. The combined results of apparent gene flow among populations on Saba Bank and surrounding reefs, the high abundance and unique genetic diversity, indicate that Saba Bank could function as an important buffer for the a11111
OPEN ACCESS
Citation:de Bakker DM, Meesters EHWG, van Bleijswijk JDL, Luttikhuizen PC, Breeuwer HJAJ, Becking LE (2016) Population Genetic Structure, Abundance, and Health Status of Two Dominant Benthic Species in the Saba Bank National Park, Caribbean Netherlands:Montastraea cavernosaand
Xestospongia muta. PLoS ONE 11(5): e0155969. doi:10.1371/journal.pone.0155969
Editor:Chaolun Allen Chen, Biodiversity Research Center, Academia Sinica, TAIWAN
Received:September 9, 2015
Accepted:May 7, 2016
Published:May 25, 2016
Copyright:© 2016 de Bakker et al. This is an open access article distributed under the terms of the Creative Commons Attribution License, which permits unrestricted use, distribution, and reproduction in any medium, provided the original author and source are credited.
Data Availability Statement:Sequences are available on Genbankhttp://www.ncbi.nlm.nih.gov/ genbank/under Accession Numbers KT254598-KT254638 and KT271771-KT271838. All relevant data on densities or counts are within the paper and its Supporting Information files.
region. Either as a natural source of larvae to replenish genetic diversity or as a storehouse of diversity that can be utilized if needed for restoration practices.
Introduction
The Saba Bank, Caribbean Netherlands, is a large (2,200 km2, along the 100 m isobath) sub-merged carbonate platform [1,2] and harbors a rich diversity of marine species [3–6]. In 2010, the Dutch Government declared the Bank a Protected Area and it has been registered as such in the Specially Protected Areas and Wildlife (SPAW) protocol of the Cartagena Convention for the Protection and Development of the Marine Environment of the Wider Caribbean (http://www.spaw-palisting.org/area_public/show/id/10). Saba Bank received the designation of a Particular Sensitive Sea Area (PSSA) at the International Maritime Organization (IMO) in 2012 and was acknowledged as an Ecological or Biological Significant Area (EBSA) at the Con-vention on Biological Diversity (CBD). The bank also received special attention within the management plan of the Caribbean Netherlands to ensure the protection of its unique biodi-versity [7–9]. In addition, the Dutch Ministry of Economic Affairs, Agriculture and Innovation has instigated“The Saba Bank Research Program 2011–2016”in order to determine the health status of Saba Bank, to, among other objectives, gain insight in key ecological processes.
Due to its offshore position—5 km from Saba Island—and upper-mesophotic reef system (20–50 m deep), Saba Bank coral reefs appear to have suffered relatively little anthropogenic disturbance compared to the fringing reefs of the surrounding islands. This is reflected, for instance, by the relative absence of diseases [4,5,9], as well as the presence of large predators (e.g. sharks, groupers and snappers) [8,10], suggesting Saba Bank could fulfill an essential role in the resilience of nearby reefs as a source of larvae and genetic diversity. Coral reef organisms are strongly dependent on recruitment from surrounding reefs after local disturbances (e.g. hurricanes) [11]. Understanding patterns of connectivity is therefore essential to implement effective reef conservation strategies [12]. If Saba Bank is to serve as a reservoir of diversity for the surrounding reefs, it is important to understand how populations on the bank are posi-tioned in the genetic structure of the wider Caribbean populations and how stress and diseases are currently affecting the populations. The aim of the current study was to examine the genetic connectivity, density, and health status (i.e. presence of diseases or traces of recent bleaching) of populations of two prominent benthic reef species on Saba Bank; the star coral,Montastraea cavernosa(Linnaeus 1767), and the giant barrel sponge,Xestospongia muta(Schmidt 1870). Both species have been recorded on Saba Bank in surveys since the 1970s [3,5,9].
M.cavernosais a common reef-building scleractinian coral in the tropical and sub-tropical Atlantic [13] and can account for up to 95% of the total coral cover in some regions (e.g. eastern Brazil) [14]. In the Florida Keys and the Cayman Islands benthic surveys indicated colony den-sities between 0.14–6.32 m-2[15–17].M.cavernosais a broadcast spawner, releasing sperm and eggs into the water column where fertilization and development take place [18]. Planktonic planulae of broadcast spawning corals can survive up to 100 days before final settlement, allow-ing for potential dispersal over considerably large distances (>600 km) [19]. AlthoughM.
cavernosais ubiquitous throughout the Atlantic and a clear genetic structure exists between the Caribbean, Brazilian and eastern Atlantic regions—separated by 4 000–10 000 km—indicating that gene flow is restricted at the larger scale [20]. On a lower scale, however, high levels of genetic connectivity have been found amongst the majority of populations within the
www.dcnanature.org/resources/research-monitoring/ bo-projects/;https://www.rijksoverheid.nl/ministeries/ ministerie-van-economische-zaken); WWF Netherlands to EHWGM (http://www.wnf.nl/nl/wat_ wnf_doet/projecten/details/?project=44); De Nederlandse Organisatie voor Wetenschappelijk Onderzoek (NWO) Rubicon; #825.12.007 to LEB (http://www.nwo.nl/onderzoek-en-resultaten/ programmas/rubicon); De Nederlandse Organisatie voor Wetenschappelijk Onderzoek (NWO) VENI#863.14.020 to LEB (http://www.nwo.nl/en/ funding/our-funding-instruments/nwo/innovational-research-incentives-scheme/veni/index.html). The funders had no role in study design, data collection and analysis, decision to publish, or preparation of the manuscript.
Caribbean [21,22], with the exception of some locations (e.g. Barbados or the Little Cayman Islands) which appear to rely more on self-recruitment [21,23].
M.cavernosais vulnerable to Black Band Disease and White Plague Disease throughout the Cairbbean, affecting up to 2.9% and 1.8% of the colonies respectively on reefs of Jamaica [24,
25]. Ferreira and colleagues [26] also describe the presence of a Dark Spot and Yellow Band Disease affecting several colonies in the Brazilian Fernando de Noronha archipelago. Addition-ally,M.cavernosacolonies are susceptible to bleaching [27–29], although these seem to have a higher tolerance to increased temperatures compared to other corals (e.g.Orbicella annularis orAgaricia spp.) [30]. There might be some degree of overestimation in previous surveys, as natural whitish coloration might have been wrongly ascribed to bleaching [31].
In addition to corals, sponges play a crucial role in coral reef ecosystems [32–37].X.mutais one of the largest and most common members on Caribbean reefs and is often referred to as the‘redwood of the reef’due to its long lifespan [38–40]. It contributes significantly to the habi-tat complexity and can overturn substantial volumes of reef water (up to 0.078 L s−1L−1sponge
tissue) [41,42], hence playing a crucial role in the reef system.X.mutahas been recorded to reach densities as high as 0.28 ind. m-2[43]. Although there is little data on the larval survival ofX.muta, the larval dispersal is expected to be limited, similar to the congenerXestospongia testudinaria[44,45]. To date, Lopez-Legentil. (2009) [46] published the only study on genetic connectivity ofX.mutapopulations in the western Atlantic. They report strong genetic struc-ture among the majority of the sampled populations, using the I3-M11 partition of COI.
The peripheral tissue ofX.mutaharbors cyanobacteria of the genusSynechococcusthat gives these barrel sponges the characteristic reddish brown coloration [47]. Similar to corals, X.mutais known to expel part of its symbiont community during region wide bleaching events [48–51]. Within the Caribbean a number of massive bleaching events have already been reported, as reviewed by Angermeieret al. (2011) [52]. Cowartet al. (2006) [49] described two types of bleaching in barrel sponges on Conch Reef, Florida Keys: cyclic bleaching, which seems to be temporary (affecting ± 25% of the population) and fatal bleaching (affecting<1% of the population), which is synonymous with Sponge Orange Band Disease (SOB) and usually results in sponge mortality [49,50,53].
In the present study, we aimed to assess the role of Saba Bank in recruitment of two com-mon benthic species (M.cavernosaandX.muta). With the aid of molecular techniques and photographed transects, we quantified 1) the level of genetic diversity within the populations on Saba Bank; 2) the degree of genetic connectivity between populations on Saba Bank and sur-rounding reefs, based on novel sequences and published sequences of populations across the wider Caribbean; 3) the current density and health status of the populations ofM.cavernosa andX.mutaon Saba Bank.
Materials and Methods
Ethics statement
Sample collection and handling
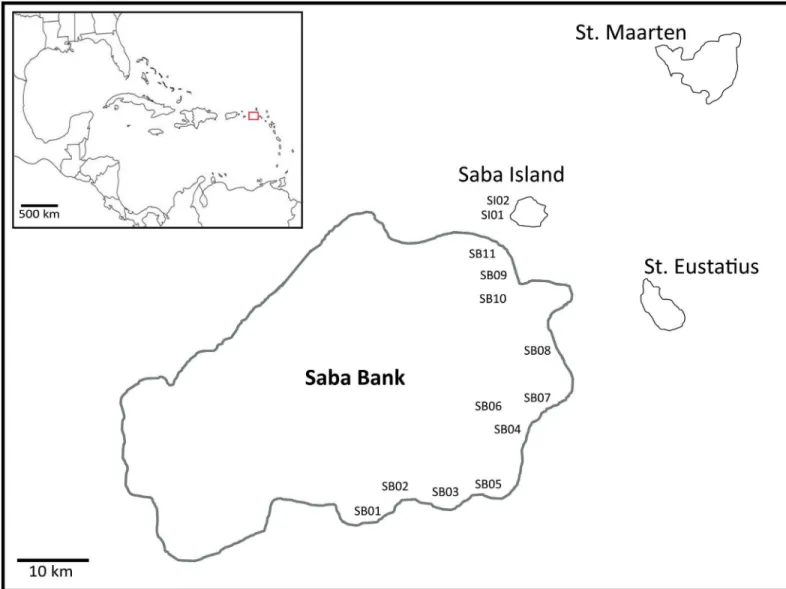
From 19–27 October 2013, IMARES (Wageningen UR), organized a research expedition to the Saba Bank (17° 25’N, 63° 30’W) to investigate the ecological functioning of the Bank, on board of the“Caribbean Explorer II”. The expedition is a follow-up of a survey of the Bank in 2011 and is part of“The Saba Bank Research Program 2011–2016”initiated by the Dutch Min-istry of Economic Affairs (EZ). Saba Bank is located approximately 5 km south-west of Saba Island (Fig 1). It is the largest submerged carbonate platform in the Atlantic Ocean [2,7]. The majority of the bank is occupied by algal fields and sand dominated patches, except for the 55 km long coral ridge on the eastern and southern edge [1,8]. We conducted surveys at 11 sites (SB01–SB11) on Saba Bank (Fig 1) of which the location was determined during the previous expedition,‘Saba Bank I expedition’in October 2011, based on depth (15–30 m) and benthic cover of corals, sponges and macro algae. These sites are considered to properly represent the habitat variation found on Saba Bank reef crest. At each site, allX.mutaandM.cavernosa colo-nies within a 50 m belt transect were photographed to obtain local densities and quantify disease or bleaching incidences. Tissue of corals (M.cavernosa)and sponges (X.muta)for molecular analysis was collected haphazardly at each site, but within the vicinity of the belt transect. In addition, molecular samples were collected at two sites near Saba Island. On the Saba Island sites no transects were laid out and data on densities or disease is absent. To mini-mize the chance of sampling clones, a minimum distance of 10 m was kept between colonies. All collected samples were id-labelled (including location, depth and coloration) and source colonies were extensively photographed–in situand after collection—to allow for comprehen-sive identification and disease recognition. Several polyps of the coral colonies’edge were col-lected using a hammer and chisel. Sponge tissue was obtained using an apple corer in order to get symbiont-rich surface as well as internal tissue [54]. To minimize the chance of sampling clones, minimum distance between colonies was kept at 10 m. For DNA analysis, a 0.5 cm3 piece of each sample was preserved in 2 mL reaction tubes with RNAlatertm(QIAGEN). The remaining tissue was kept on 96% ethanol for morphological identification. All samples were kept at 4°C directly after collection and during transport, subsequently they were stored at -20°C.
DNA extractions and PCR amplification
Total DNA was extracted using the GenElute Mammalian Genomic DNA Miniprep kit (Sigma) following the manufacturer’s protocol, with an additional step of grinding the tissue gently with a sterile plastic pestle to improve homogenization after the addition of Lysis‘T’
solution. The solution was incubated for approximately 4 hours at 55°C, or until complete cell lysis. All laboratory work was performed at theRoyal Netherlands Institute for Sea Research (NIOZ) Texel, the Netherlands.
The 892 bp (base pairs) long internal transcribed spacer 1–5.8S ribosomal RNA—internal transcribed spacer 2 (ITS hereafter) was amplified forM.cavernosausing the primersITSant1S (5’-GGT ACC CTT TGT ACA CAC CGA CCG TCG CT-3’) andITSant2S(5’-GCT TTG GGC GGC AGT CCC AAG CAA CCC GAC TC-3’) [21,55]. The 50μL PCR reaction volume
con-tained 5.0μL 10x buffer, 5μL dNTP (2.5 mM), 0.25μL (50μM) of each Primer, 0.25μL Biotherm+ Taq, 1.0μL BSA and 2μL of DNA template (undiluted). The PCR profile had an initial denaturation step of 3 min. at 94°C, followed by 36 cycles of 94°C (30s), 50°C (30s) and 72°C (45s) and a final extension of 5 min. at 72°C. The 544 bp long I3-M11 partition of the mitochondrial cytochrome oxidase I (COI) gene ofX.mutawas amplified using the universal metazoan primerC1-J2165(5’-GAA GTT TAT ATT TTA ATT TTA CCD GG-3’) [56] and the
reaction volume contained 5.0μL 10x PCR buffer, 5.0μL dNTP (2.5 mM), 0.5μL (50μM) of each Primer, 0.25μL BiothermPlus Taq, 2.0μL of DNA template. The thermal cycler profile consisted of an initial denaturation step of 3 min at 95°C followed by 35 cycles of 95°C (30s), 42°C (30s) and 68°C (90s) and a final extension at 72°C (10 min). All PCR reactions were car-ried out in T-Gradient Thermo-block (Biometra) or Doppio Fuse 8.0A thermal cyclers. PCR products were sequenced forward and reverse by BaseClear B.V. Leiden, The Netherlands.
Sequence preparation
Consensus sequences were constructed from the forward and reverse sequences, using the soft-ware programsAuto-assembler DNA Sequence Assemblerver. 2.1 (Applied Bio-systems, Per-kin-Elmer) andChromas Prover. 1.7.5 (Technelysium Pty. Ltd, Tewantin, Queensland, Australia). Final consensus sequences were aligned (93% similarity 5.0/-9.026186) in Gen-eious1
ver. 7.0.6 (Biomatters) with homologous sequences obtained from GenBank1
(http:// www.ncbi.nlm.nih.gov/genbank/). In order to recover all previously published sequences of
Fig 1. Sample locations on Saba Bank (SB01-SB11) and around Saba Island (SI01 and SI02).Included is a scheme of Saba Bank’s position with respect to nearby islands and in the wider Caribbean region (indicated by red square in overview).
ITS and COI ofM.cavernosaandX.muta, respectively, a search was conducted with the spe-cific genetic marker and species as search terms in GenBank. Ambiguities in consensus sequences were, where possible, visually resolved using the original chromatogram files. When the lower peak was over 80% in height of the higher peak at an ambiguous site, and no more than a single ambiguous site was found in that particular sequence the alleles were separated. If multiple nucleotide ambiguities in one sequence could not be resolved or no consensus could be built, these sequences were excluded from subsequent analyses (one I3-M11 sequence and five ITS sequences). The low number of ambiguities found in the ITS data is in correspondence with the observations of Goodbody-Gringley and colleagues (2012) [21] who found, forM. cavernosa, a maximum of one ambiguous peak within any individual ITS sequence. Novel sequences are available in GenBank under Accession Numbers KT254598-KT254638 and KT271771-KT271838 (S1 Table).
Genetic variation and population structure
Genetic diversity on Saba Bank and populations in the wider Caribbean region was determined based on estimates of haplotype diversity (h) [58] and nucleotide diversity (π) [58] using the software Arlequin ver. 3.5.1.2 [59]. Analysis of molecular variance (AMOVA) [60] was con-ducted among all 11 Saba Bank sample sites to determine presence of genetic population struc-ture among the sample sites. Comparisons among all sampled locations were tested based on pairwiseFSTstatistics (10 000 bootstrap permutations). All AMOVA, exact andFSTstatistics tests were also conducted in Arlequin. Maximum likelihood trees were constructed in MEGA ver. 6.06 [61] and subsequently used to construct haplotype networks in HaplotypeViewer [62]. The most suitable model (JC+G for ITS and K2+G+I for I3-M11) was selected in jMo-delTest ver. 2.1.2 [63], based on the Akaike Information Criterion (AIC).
Migration analyses
In order to examine the possibility of asymmetrical migration, we carried out an isolation-with-migration analyses with the model IMa2 [64]. Doing so also allowed us to obtain rough estimates of the time scale of colonization of the study area as well as effective population sizes (Ne). To convert model parameters into demographic units, an inheritance scalar of 0.5 for mitochondrial DNA in hermaphroditic species (i.e.,θ= 2Neμ)) and a generation time of 1 year were assumed. Substitution rate for COI inX.mutawas estimated at 0.0194% per million years (MY), based on a maximum interspecific pairwise distance of 21% in the Porifera [65] and the oldest sponge fossil dating to 540 million years ago (MYA) [66]; for IMa2, that translates to a per-locus mutation rate of 0.1110−6per year per 544 bp. ForM.cavernosa, the results of the
migration analysis were highly inconsistent and therefore, the applied methods and results for ITS will not be discussed here.
Population density and health status
At each Saba Bank station one transect line of 50 m was placed on the reef surface in order to determine the densities ofM.cavernosacolonies andX.muta. Every meter a high resolution photograph was taken (S1 Fig) from which densities were extracted visually. Only sponges and corals present in a 1 m2section in the center of each image were counted. Every square was aligned with each meter of transect to prevent repeated counting.M.cavernosacolonies smaller than 4 cm were considered juvenile [67]. No transects were recorded on Saba Island, hence, data on densities around Saba Island is absent.
All sampled colonies ofM.cavernosaand individuals ofX.mutaas well as those on the tran-sect pictures (covering 50 m2per site) were analyzed for signs of disease or bleaching. Previous mortality was identified by the loss of tissue where polyps were still recognizable. Partial over-growth of the tissue by other benthic components (e.g. algae or cyanobacteria) was also recorded. IndividualX.mutawere examined for both types of assumed bleaching as described by Cowartet al. (2006) [49] and McMurrayet al. (2011) [51]. Cyclic bleaching can be recog-nized by the circle shaped spots with loss of the typical brownish-red coloration in parts of the sponge tissue and Sponge Orange Band Disease by a clear orange band separating completely bleached (dead) from still untouched sponge tissue.
Results
Genetic diversity
ForM.cavernosa34 sequences of 832 bp fragment length (ITS), representing 13 haplotypes, were obtained from Saba Bank and Saba island (Table 1,Fig 2A). The combined data set, including previously published sequences from the wider Caribbean [20,21], yielded a total of 46 haplotypes (Fig 2A) with 26 polymorphic sites. Haplotypes H01-H03 (GenBank access#: HM447268, HM447255 and HM447299) were dominant on Saba Bank and throughout the western Atlantic (Fig 2A). Two unique haplotypes were present on Saba Bank (KT254613, KT254632) and one on Saba Island (KT254636).
ForX.mutaa total of 68 (Saba Bank and Saba Island) sequences of 544 bp (COI) were obtained, representing 3 haplotypes from Saba Bank and Saba Island (Table 1,Fig 2B). No unique haplotypes were discovered. The combined data set including previously published sequences from the wider Caribbean [44,46] yielded a total of 4 haplotypes (Fig 2B) with 5 polymorphic sites. Three haplotypes (H01, H02; GenBank access#: EU716652, EU716653) were dominant on Saba Bank and also in the wider western Atlantic (Fig 2B).
Population structure
indicative for presence of genetic structure between locations (for an overview of AMOVA results seeS4 Table). There was, however, no significant difference among the populations of Saba Bank and the neighboring Saba Island, neither forM.cavernosanorX.muta(Tables2
and3). ForM.cavernosasignificant albeit lowFSTvalues were obtained when comparing the population of Saba Bank to the populations in Barbados, Flower Gardens Bank (Gulf of Mexico), and stronger differentiation between Saba Bank and Panama (Table 2). The popula-tion ofX.mutaon Saba Bank showed no significant differentiation from Florida, yet it did show strong and significant differentiation with Belize and Bahamas (Table 3).
Patterns of migration
The pairwise comparison betweenX.mutafrom Saba Bank and Stirrup Cay (Bahamas) gave results that were highly reproducible between runs. The coalescent model results suggest that the two populations presently inhabiting Saba Bank and Stirrup Cay were established 1.7–2.0 MYA, but that since this time they continue to be connected through low levels of gene flow. The present-day population size (Ne) is estimated to be 0.74 to 0.77 million for Stirrup Cay and 1.5 to 1.6 million for Saba Bank (S5 Table). The simulations suggest that gene flow from Stirrup Cay to Saba Bank is virtually non-existent, while gene flow in the opposite direction does occur, but in low numbers. Simulations for the pairwise comparison betweenX.mutafrom Saba Bank and SSPC (San Salvador and Plana Cay samples from the Bahamas combined) gave
Table 1. Number of obtained sequences, number of haplotypes and genetic diversity indices for Mon-tastraea cavernosa(ITS) andXestospongia muta(I3-M11).
Location N n h π
M.cavernosa
Saba Bank1 30 12(2) 0.8828 0.0055
Saba Island1 4 4(1) 1.0000 0.0069
Barbados2 14 9(3) 0.9011 0.0051
Bermuda2 30 15(9) 0.9287 0.0062
Flower Garden Banks2 18 13(7) 0.9608 0.0059
Jamaica2 18 13(4) 0.9542 0.0055
Panama2 21 15(8) 0.9667 0.0056
X.muta
Saba Bank1 53 3 0.4579 0.0010
Saba Island1 15 3 0.3619 0.0010
Key largo3 21 3 0.6667 0.0021
Belize3 16 3 0.5750 0.0033
Sweetings cay3 19 3 0.6959 0.0036
Plana cay3 15 2 0.1333 0.0005
San Salvador3 12 2 0.3030 0.0011
Little San salvador3 14 2 0.4396 0.0032
Stirrup cay3 22 3 0.4805 0.0036
N, number of obtained sequences;n, number of haplotypes (private haplotypes given in parentheses);h, haplotype diversity,π: nucleotide diversity;
1This study;
2Goodbody-Gringleyet al. (2012); 3
Lopez-Legentil and Pawlik (2009); 4Montalvo and Hill (2011).
For accession numbers seeS1 Table.
inconsistent results and broad posterior probability intervals (S2 FigandS5 Table). The results suggest gene flow from SSPC into Saba Bank, while the simulation results are inconclusive about gene flow in the opposite direction.
Population density and disease on Saba Bank
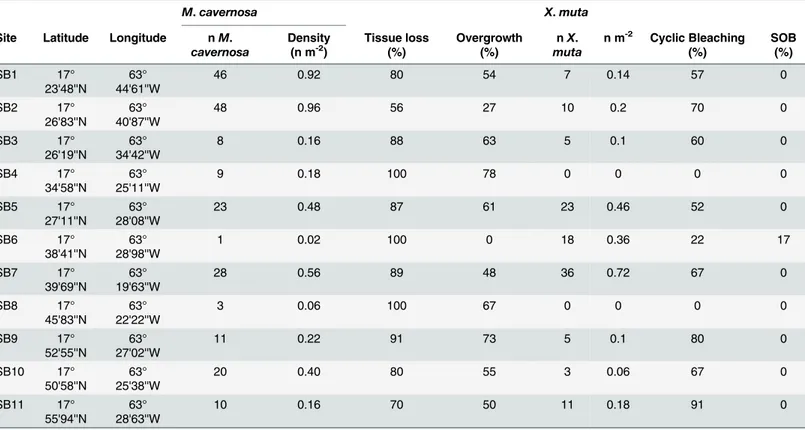
Based on our survey of 11 sites, of 50 m2transects at each site (total area surveyed 550 m2), the mean density on Saba Bank reef crest ofM.cavernosawas 0.27 [95% CI: 0.12–0.52] ind. m-2 and ofX.muta0.09 [95% CI: 0.02–0.32] ind. m-2(Table 4). A total number of 261M.cavernosa and 186X.mutawere photographed and assessed for bleaching, disease, and overgrowth. JuvenileM.cavernosa(<4 cm) accounted for 4.5% of all analyzed colonies. No disease was observed in any of theM.cavernosacolonies. Previous tissue loss (78% of colonies) and current
Fig 2. Frequency and distribution of haplotypes in populations ofMontastraea cavernosa(A) andXestospongia muta(B) in the wider Caribbean region.Haplotype frequencies provided as pie-chart per location, number of samples in brackets. Haplotype network of ITS (A) and I3-M11 (B), baes on all sequences collected throughout the wider Caribbean region. Size of circle reflects the number of individuals with a specific haplotype. Each line represents the genetic distance between haplotypes. Specific haplotype colors match those presented in the pie-charts. White circles (ITS) are haplotypes private to a certain location.
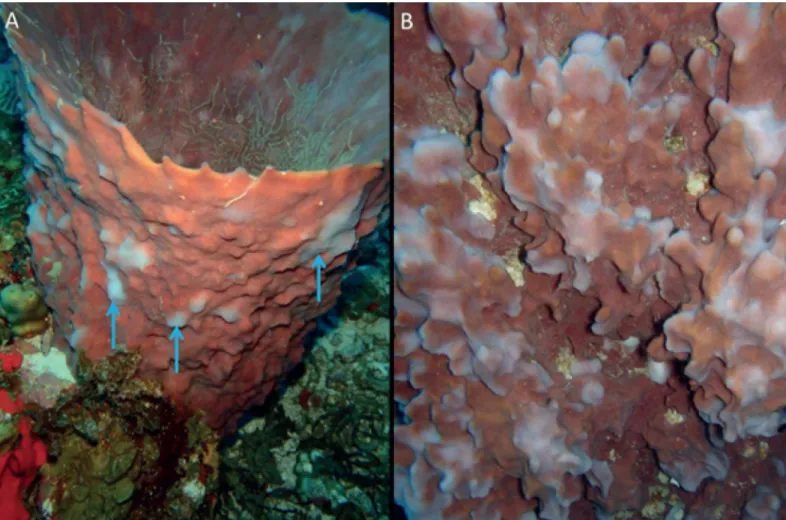
overgrowth of a part of the colony (48.1% of colonies) was frequently observed inM.cavernosa. Cyanobacteria accounted for the vast majority of overgrowth (56.7%) followed by fleshy macro algae or turf algae (23.6%), sponges (15.8%), gorgonians (2.4%) and crustose coralline algae (1.6%).X.mutashowed extensive presence of presumably cyclic bleaching [49], which fit the description of‘spottily bleached’defined by McMurrayet al. [51] as‘numerous localized patches or spots of white tissue’. Approximately all of the sampled sponges (92%) and the majority of sponges visible on the transect pictures (75%), showed‘spottily bleached’tissue (Table 4,Fig 3). Orange band Disease was encountered on three sponges, all at Saba Bank site SB06, of which two had suffered complete mortality. Many smaller (<10 cm)X.muta(>20% on the transect pictures) showed partial tissue loss associated with overgrowth by algae or other sponges.
Discussion
Genetic diversity and connectivity
This is the first study to address the population genetic structure among populations of Saba Bank and the surrounding region. We examined the role of Saba Bank as a buffer for diversity
Table 2. Matrix of pairwise population differentiation values (Φst) between populations ofMontastraea cavernosaat Saba Bank and in the wider Caribbean and Gulf of Mexico.Significant values (p<0.05) are provided in bold.
Saba Bank Saba Island Barbados Bermuda Gulf of Mexico Jamaica Panama
ITS
Saba Bank
-Saba Island 0.0032
-Barbados 0.0570 -0.0644
-Bermuda 0.0238 -0.0602 0.0103
-FGB 0.0544 -0.0672 0.0226 0.0099
-Jamaica 0.0340 -0.0644 -0.0072 -0.0170 0.0137
-Panama 0.0973 -0.0742 -0.0115 0.0066 0.0105 0.0156
-doi:10.1371/journal.pone.0155969.t002
Table 3. Matrix of pairwise population differentiation values (Φst) between populations ofXestospongia mutaat Saba Bank and in the wider Carib-bean and Gulf of Mexico. Significant values (p<0.05) are provided in bold.
Saba Bank
Saba Island
Florida Belize Bahamas (Sweetings Cay)
Bahamas (Plana Cay)
Bahamas(San Salvador)
Bahamas (L. San Salvador)
Bahamas (Stirrup Cay)
I3-M11
Saba B.
-Saba I. -0.0212
-Florida 0.0557 0.0693
-Belize 0.1981 0.1835 0.0204
-Bahamas SC
0.5031 0.3893 0.3321 0.2818
-Bahamas PC
0.0673 -0.0216 0.1756 0.2847 0.4065
-Bahamas SS
0.0828 -0.0069 0.1120 0.2210 0.2946 -0.0277
-Bahamas LSS
0.6975 0.6179 0.5445 0.4369 0.0677 0.6452 0.5535
-Bahamas STC
0.6387 0.5450 0.4906 0.3942 0.0532 0.5638 0.4836 -0.0583
in the Caribbean, via population genetic analyses, migration analyses and surveys on abun-dance and health of two prominent benthic species. The populations of both the coral Montas-traea cavernosaand the spongeXestospongia mutaappear to be connected along the whole eastern and southern rim of the Saba Bank, as well as among the populations on Saba Bank and the nearby island of Saba. Our results suggest that Saba Bank harbors viable populations that could function as a source of diversity, as the genetic diversity of the populations ofM. cavernosa(π= 0.055,h= 0.883) andX.muta(π= 0.001,h= 0.362–0.458) on Saba Bank are comparable to the ranges of diversity found for these species in other Caribbean locations (M. cavernosa:π= 0.005–0.006,h= 0.901–0.967 [21];X.muta:π= 0.0005–0.004,h= 0.133–0.696 [46]). Furthermore, migration analyses ofX.mutasuggested gene flow to occur from Saba Bank to the Bahamas.
ForM.cavernosathere appears to be unrestricted gene flow among the locations of Saba and the majority of the studied locations in the wider Caribbean. The putatively high level of genetic exchange within the studied region—despite geographical separation of over 2000 km
—could be the result of specific life history traits in combination with ocean currents. Being a broadcasting species [18], the larvae ofM.cavernosahave the ability to drift with currents over distances of several hundreds of kilometers [13,20]. Hydrological features, such as direction of major currents (SE-NW in the Caribbean region [68]) can, however, cause limitations to dis-persal and thus form barriers to gene flow. Cowenet al. (2006) [69] suggest recruitment limita-tions due to the partial hydrological isolation of the Leeward Islands—including Saba Bank—
from the wider Caribbean which could result in considerable levels of self-recruitment. Such
Table 4. Main characteristics ofMontastraea cavernosaandXestospongia mutapopulation at the 11 Saba Bank sites.All values for densities and signs of stress are based on image analysis of 50 m2transect surveys at each site and do not correspond to the samples collected for genetic analyses. (n) number ofM.cavernosaandX.muta; densities per square meter; percentage ofM.cavernosacolonies with tissue loss and overgrowth; and percentage ofX.
mutawith cyclic bleaching or Sponge Orange Band Disease (SOB [49]). No disease was detected in any of the recordedM.cavernosacolonies.
M.cavernosa X.muta
Site Latitude Longitude nM. cavernosa
Density (n m-2)
Tissue loss (%)
Overgrowth (%)
nX. muta
n m-2 Cyclic Bleaching
(%) SOB (%) SB1 17° 23'48''N 63° 44'61''W
46 0.92 80 54 7 0.14 57 0
SB2 17°
26'83''N
63° 40'87''W
48 0.96 56 27 10 0.2 70 0
SB3 17°
26'19''N
63° 34'42''W
8 0.16 88 63 5 0.1 60 0
SB4 17°
34'58''N
63° 25'11''W
9 0.18 100 78 0 0 0 0
SB5 17°
27'11''N
63° 28'08''W
23 0.48 87 61 23 0.46 52 0
SB6 17°
38'41''N
63° 28'98''W
1 0.02 100 0 18 0.36 22 17
SB7 17°
39'69''N
63° 19'63''W
28 0.56 89 48 36 0.72 67 0
SB8 17°
45'83''N
63° 22'22''W
3 0.06 100 67 0 0 0 0
SB9 17°
52'55''N
63° 27'02''W
11 0.22 91 73 5 0.1 80 0
SB10 17°
50'58''N
63° 25'38''W
20 0.40 80 55 3 0.06 67 0
SB11 17°
55'94''N
63° 28'63''W
10 0.16 70 50 11 0.18 91 0
restrictions might explain the significant, albeit weak, differentiation we found among Saba Bank populations and the populations from Barbados, the Gulf of Mexico (Flower Gardens Bank) and, slightly stronger, Panama. Different degrees of genetic isolation ofM.cavernosa populations within the Caribbean region have also been recorded by Goodbody-Gringleyet al. (2011) [21], Brazeauet al. (2014) [23] and Serranoet al. (2014) [22] probably due to local hydrology, limiting larval dispersal away and, at certain locations, stronger reliance on self-recruitment as well [21,69].
ForX.muta, connectivity seems to be limited between the populations on Saba Bank and Belize, as well as most of the locations in the Bahamas. The migration analyses suggest that col-onization of the Saba Bank was not recent, with population subdivision time forX.mutafrom Saba Bank versus Stirrup Cay estimated at 1.7–2.0 million years ago. Note that the absolute numbers inferred in the present study depend heavily on the assumption that the generation time is one year. Unfortunately, not much is known about generation time of sponges in natu-ral habitats. Additionally, the inferences rely on a single locus only and may thus depend on specifics of that locus. Studying additional loci would greatly improve these analyses. The pat-tern of population genetic structure inX.mutaappears to be most strongly related to hydrolog-ical patterns [69] and specific life history traits. Restricted larval dispersal is a common feature in sponges (reviewed by Maldonado, 2006) [70] and might explain the observed limited recruitment ofX.mutaover large distances [44,45]. Lopez-Legentil and Pawlik (2009) [46]
Fig 3. Bleaching in Xestospongia muta.(A) Cyclic bleaching (blue arrows). (B) Close up of cyclic bleaching close up.
also found significant differentiation between most distant populations ofX.mutathat they studied in Florida, Bahama’s and Belize, ranging in distance from 100–1000 km. Yet, the authors did not see evidence of isolation-by-distance, potentially indicating thatX.mutalarvae do have the ability to disperse over larger distances. However, due to the low number of I3-M11 haplotypes (n = 4) found inX.muta, the presence or absence of one specific haplotype can have a large impact on theFst values. Using the same genetic marker in a congener,X. tes-tudinaria, genetic divergence over small spatial scales of 2–100 km has been detected in Indo-nesia [54,71].X.testudinariahas short dispersal distances and seems to rely largely (up to 80%) on self-recruitment [72]. It has, furthermore, been proposed thatX.testudinariais a spe-cies complex with each COI haplotype possibly representing a distinct spespe-cies [54,71]. It is unclear, but possible, that this is also the case in the CaribbeanX.muta.
Population density
M.cavernosacolony densities on Saba Bank were found to be highly variable between sites (range 0.02–0.96 colonies m-2), but fit largely within the range of densities described by Porter et al. (1987) [16] for southern Florida at a depth range of 10–40 m (0.14–1.09 colonies m-2). However, much higher densities (up to 6.32 colonies m-2) have also been found throughout in the Caribbean region [15,17]. The rather atypical flat reef character of Saba Bank, caused by continuous hydrologic and wind (including hurricanes) stress, compared to the more common massive reef structures on leeward fringing reefs around nearby islands might explain the lower densities at several sites. Also, at some sites the dominant benthic cover was sand, which likely restricted coral recruitment (e.g. SB06 with densities of 0.02 colonies m-2). The density of X.mutaon most Saba Bank sites was comparable to previous recordings in Florida where mean densities between 0.186–0.277 m-2were found at depths ranging between 15–30 m [43,
51], but data on sponge densities in the Caribbean region is scarce. There were three locations with remarkably high densities (SB05-SB07) which were characterized by substantial total sponge cover (9–13.7%) and either high algal (50%) or high sand-rubble (45%) cover [9]. The densities are similar toX.testudinariain Indonesia. In East Kalimantan the densities ranged between 0–0.1333 in/m2at depths between 5-10m [73]. In Sulawesi the densities were lower with 0.002–0.038 ind. m-2, yetX.testudinariawas most abundant at heavily disturbed reefs [71].
Health status
knowledge, however, there are no reports of substantial bleaching having occurred in the Carib-bean region in 2013.
In contrast, the vast majority ofX.muta(>80%) on Saba Bank showed signs of bleaching in the form of circular shaped white spots. In fact, all observed larger individuals (diameter>50 cm) had these bleached spots (Fig 3). In addition, Sponge Orange Band Disease was found in three individuals. In comparison, the proportion of spotted bleaching inX.mutawas much lower in Florida with 16–21% at 15–30 m [51]. Our observations are also considerably higher than reports byCowart et al. (2006) [49] in the Florida Keys, who found cyclic bleaching in approximately 25% of the sponge population in surveys since 1997. The high proportion of bleached sponges is disconcerting given the fact that no bleached sponges were recorded on Saba Bank in 2006, during a study specifically aimed to document bleaching and disease inX. mutaon the bank [5]. As bleaching inX.mutais known to be seasonal with a peak during the fall [51], the observed discrepancy might be the result of a difference in survey timing. Thacker and colleagues [5] conducted their work in January, when water temperature is generally lower compared to October (our study).
At present, the densities and genetic diversity ofX.mutaon Saba Bank indicate a healthy population, yet a significant portion of the sponges is affected by partial bleaching and although long term effects of this phenomenon are unknown, there is a risk of a reduction in population size.X.mutaplays a crucial role in the coral reef ecosystem providing habitat complexity [77,
78] and biotope for symbionts from microbes [53,79,80] to invertebrates (e.g. crustaceans and brittle stars) [32,81,82]. Furthermore, populations of this sponge species can filter a substan-tial amount of water [41,42], therewith playing an import role in nutrient fluxes and removal of particulate and dissolved organic mattere.g. [37,83–87]. A reduction inX.mutapopulations would likely cause a significant change in ecosystem functioning.
Conclusions
This is the first study to examine the potential of Saba Bank as a buffer in the region, either as a natural source of larvae to replenish genetic diversity in the region or as a storehouse of diver-sity that can be utilized if needed for restoration practices. Although our results are not conclu-sive on the direction of gene flow, they do underline the potential of Saba Bank to serve an essential ecological role within the region. There are no large land masses nearby and conse-quently the reefs have suffered less from pollution, coastal development and run-off. Saba Bank reefs, however, are not immune to global environmental threats such as the rise in sea surface temperature or acidification, and are subjected to local threats including fishing of nat-ural herbivores (fish, lobsters) and explorations for natnat-ural resources as well [8]. Due to its high species and unique genetic diversity, the upstream position with respect to the wider west-ern Atlantic, its large area of deeper reef, and relatively limited anthropogenic disturbance, Saba Bank requires further conservation efforts to serve as a potential source population to the wider Caribbean.
Supporting Information
S1 Fig. Example of Transect picture from Saba Bank site 5 (SB5).Red square (1 m2) overlaps with 1 m of the transect line (length between the two black dots. OnlyM.cavernosa(blue arrow) andX.muta(green arrow) within the red square were counted.
(EPS)
(San Salvador and Plana Cay, Bahamas, samples combined), and Saba Bank versus Stirrup Cay (Bahamas). Migration rates are given here forward in time.; line colors represent four indepen-dent simulation runs; A = simulated ancestral population.
(EPS)
S1 Table. Overview of all accession numbers used in this study.including novel sequences and those obtained from GenBank.
(DOCX)
S2 Table. Analysis of molecular variance (AMOVA) for both ITS (Montastraea cavernosa) and I3-M11 (Xestospongia muta) on all 11 Saba Bank sites on the south-eastern Saba Bank. (DOCX)
S3 Table.FSTvalues between Saba Bank sample sites for both [A]Montastraea cavernosa and [B]Xestospongia muta.Significant values (p<0.05) provided in bold. At site SB06 noM.
cavernosawere sampled. (DOCX)
S4 Table. Analysis of molecular variance (AMOVA) for both ITS (Montastraea cavernosa) and I3-M11 (Xestospongia muta) within the wider Caribbean and Gulf of Mexico.
(DOCX)
S5 Table. Migration analysis indices.Maximum posterior probability estimates in demo-graphic units for four isolation-with-migration simulation runs. For details of simulations see text. Nx= millions of individuals in population x; A = simulated ancestral population, T = population subdivision time (millions of years ago), 2Nm1,2= number of migrants popula-tion 1 (Saba Bank) receives from populapopula-tion 2 (SSPC or Stirrup Cay) per year. SSPC refers to data of the pooled Bahamas sites: Stirrup Cay and Plana Cay.
(DOCX)
Acknowledgments
We are grateful to Anneke Bol-den Heijer and Harry Witte for their assistance with the molec-ular analyses at NIOZ. We also would like to thank all the members of the 2013 Saba Bank Expedition II, specifically Benjamin Mueller for his assistance in the field and Franck Mazeas and Jean-Philippe Maréchal for transect pictures. Furthermore we thank the captain and crew of the Caribbean Explore II for taking care of our safety and wellbeing on board and during the dives. Special thanks to Hayo Haanstra, Astrid Hilgers, Paul Hoetjes, who are policy advisors of the department of Nature and Biodiversity for the Dutch Ministry of Economic Affairs (EZ) and Mariska Bottema, Marine Advisor at World Wildlife Fund (WNF-NL). Finally, we would like to thank the editor and two anonymous reviewers for their constructive comments.
Author Contributions
Conceived and designed the experiments: LEB DdB JDLvB. Performed the experiments: LEB DdB. Analyzed the data: DdB LEB JDLvB PCL HJAJB EHWGM. Contributed reagents/materi-als/analysis tools: JDLvB EHWGM HJAJB. Wrote the paper: DbD LEB JDLvB PCL EHWGM HJAJB. Provided expertise on population genetics: HJAJB.
References
2. Van der Land J. The Saba Bank, a large atoll in the northeastern Caribbean. FAO Fisheries Report. 1977; 200:469–81.
3. Etnoyer PJ, Wirshing HH, Sanchez JA. Rapid Assessment of Octocoral Diversity and Habitat on Saba Bank, Netherlands Antilles. Plos One. 2010; 5(5). doi:10.1371/journal.pone.0010668
WOS:000278017400006.
4. McKenna SA, Etnoyer P. Rapid Assessment of Stony Coral Richness and Condition on Saba Bank, Netherlands Antilles. Plos One. 2010; 5(5). doi:10.1371/journal.pone.0010749
WOS:000278017400010.
5. Thacker RW, Cristina Diaz M, de Voogd NJ, van Soest RWM, Freeman CJ, Mobley AS, et al. Prelimi-nary Assessment of Sponge Biodiversity on Saba Bank, Netherlands Antilles. Plos One. 2010; 5(5). doi:10.1371/journal.pone.0009622WOS:000278017400002.
6. Williams JT, Carpenter KE, Van Tassell JL, Hoetjes P, Toller W, Etnoyer P, et al. Biodiversity Assess-ment of the Fishes of Saba Bank Atoll, Netherlands Antilles. Plos One. 2010; 5(5). doi:10.1371/journal. pone.0010676WOS:000278017400007.
7. Hoetjes PC, Carpenter KE. Saving Saba Bank: Policy Implications of Biodiversity Studies. Plos One. 2010; 5(5). doi:10.1371/journal.pone.0010769WOS:000278017400021.
8. Meesters HWG. Biodiversity of the Saba Bank supports status of Particularly Sensitive Sea Area (PSSA): IMARES Wageningen UR; 2010.
9. van Beek IJ, Meesters HWG. Saba Bank Research Expedition 2011-Progress Report: IMARES Wageningen UR; 2013.
10. Toller W, Debrot AO, Vermeij MJA, Hoetjes PC. Reef Fishes of Saba Bank, Netherlands Antilles: Assemblage Structure across a Gradient of Habitat Types. Plos One. 2010; 5(5). doi:10.1371/journal. pone.0009207WOS:000278017400001.
11. Mumby PJ, Hastings A. The impact of ecosystem connectivity on coral reef resilience. Journal of Applied Ecology. 2008; 45(3):854–62. doi:10.1111/j.1365-2664.2008.01459.x
WOS:000255464600013.
12. Connell JH, Hughes TP, Wallace CC. A 30-year study of coral abundance, recruitment, and distur-bance at several scales in space and time. Ecological Monographs. 1997; 67(4):461–88. WOS: A1997YC93000003.
13. Szmant AM. Reproductive ecology of Caribbean reef corals. Coral reefs. 1986; 5(1):43–53.
14. Dutra LXC, Kikuchi RKP, Leao ZMAN. Effects of sediment accumulation on reef corals from Abrolhos, Bahia, Brazil. Journal of Coastal Research. 2006:633–8. WOS:000202961400003.
15. Rose CS, Risk MJ. INCREASE IN CLIONA-DELITRIX INFESTATION OF MONTASTREA-CAVER-NOSA HEADS ON AN ORGANICALLY POLLUTED PORTION OF THE GRAND CAYMAN FRING-ING-REEF. Marine Ecology-Pubblicazioni Della Stazione Zoologica Di Napoli I. 1985; 6(4):345–63. doi:10.1111/j.1439-0485.1985.tb00142.xWOS:A1985AXF7900005.
16. Porter JW. Species profiles: Life histories and environmental requirements of coastal fishes and inver-tebrates (south Florida): Reef-building corals.[Acropora cervicornis; Acropora palmata; Montastraea annularis; Montastraea cavernosa]. Georgia Univ., Athens (USA). Dept. of Zoology, 1987.
17. Chiappone M, Sullivan KM. Distribution, abundance and species composition of juvenile scleractinian corals in the Florida Reef Tract. Bulletin of Marine Science. 1996; 58(2):555–69. WOS:
A1996TZ92600014.
18. Szmant AM. SEXUAL REPRODUCTION BY THE CARIBBEAN REEF CORALS MONTASTREA-ANNULARIS AND M-CAVERNOSA. Marine Ecology Progress Series. 1991; 74(1):13–25. doi:10. 3354/meps074013WOS:A1991FY63900002.
19. Wilson JR, Harrison PL. Settlement-competency periods of larvae of three species of scleractinian cor-als. Marine Biology. 1998; 131(2):339–45. doi:10.1007/s002270050327WOS:000074174600016. 20. Nunes F, Norris RD, Knowlton N. Implications of isolation and low genetic diversity in peripheral
popula-tions of an amphi-Atlantic coral. Molecular Ecology. 2009; 18(20):4283–97. doi:10.1111/j.1365-294X. 2009.04347.xWOS:000270665900014. PMID:19765228
21. Goodbody-Gringley G, Woollacott RM, Giribet G. Population structure and connectivity in the Atlantic scleractinian coral Montastraea cavernosa (Linnaeus, 1767). Marine Ecology-an Evolutionary Perspec-tive. 2012; 33(1):32–48. doi:10.1111/j.1439-0485.2011.00452.xWOS:000302950800003.
23. Brazeau DA, Lesser MP, Slattery M. Genetic Structure in the Coral, Montastraea cavernosa: Assessing Genetic Differentiation among and within Mesophotic Reefs. Plos One. 2013; 8(5). doi:10.1371/ journal.pone.0065845WOS:000319725500003.
24. Bruckner AW, Bruckner RJ, Williams EH. Spread of a black-band disease epizootic through the coral reef system in St Ann's Bay, Jamaica. Bulletin of Marine Science. 1997; 61(3):919–28.
WOS:000073797400024.
25. Rutzler K, Santavy DL, Antonius A. The Black Band Disease of Atlantic Reef Corals. Marine Ecology. 1983; 4(4):329–58.
26. Ferreira BP, Costa MBSF, Coxey MS, Gaspar ALB, Veleda D, Araujo M. The effects of sea surface temperature anomalies on oceanic coral reef systems in the southwestern tropical Atlantic. Coral Reefs. 2013; 32(2):441–54. doi:10.1007/s00338-012-0992-yWOS:000318567900014.
27. Miranda RJ, Cruz ICS, Leao ZMAN. Coral bleaching in the Caramuanas reef (Todos os Santos Bay, Brazil) during the 2010 El Nino event. Latin American Journal of Aquatic Research. 2013; 41(2):351– 60. doi:10.3856/vol41-issue2-fulltext-14WOS:000322261700014.
28. Leãoa ZM, Kikuchi RK, Testa V. Corals and coral reefs of Brazil. 2003.
29. Lasker HR, Peters EC, Coffroth MA. Bleaching of reef coelenterates in the San Blas Islands, Panama. Coral Reefs. 1984; 3(4):183–90.
30. Fitt WK, Warner ME. Bleaching patterns of four species of Caribbean reef corals. Biological Bulletin. 1995; 189(3):298–307. doi:10.2307/1542147WOS:A1995TL76800005.
31. Cruz ICS, Leal MC, Mendes CR, Kikuchi RKP, Rosa R, Soares AMVM, et al. White but not bleached: photophysiological evidence from white Montastraea cavernosa reveals potential overestimation of coral bleaching. Marine Biology. 2015; 162(4):889–99. doi:10.1007/s00227-015-2633-9
WOS:000351227900014.
32. Wilkinson CR. NET PRIMARY PRODUCTIVITY IN CORAL-REEF SPONGES. Science. 1983; 219 (4583):410–2. doi:10.1126/science.219.4583.410WOS:A1983PY51600030. PMID:17815320 33. Wilkinson CC, Cheshire AA. Comparisons of sponge populations across the Barrier Reefs of Australia
and Belize: evidence for higher productivity in the Caribbean. Marine Ecology Progress Series-pages: 67: 285–294. 1990.
34. Diaz MC, Rutzler K. Sponges: An essential component of Caribbean coral reefs. Bulletin of Marine Sci-ence. 2001; 69(2):535–46. WOS:000172609000025.
35. Bell JJ. Sponges as agents of biological disturbance. Marine Ecology Progress Series. 2008; 368:127– 35. doi:10.3354/meps07637WOS:000260511800011.
36. Wulff J. ECOLOGICAL INTERACTIONS AND THE DISTRIBUTION, ABUNDANCE, AND DIVERSITY OF SPONGES. In: Becerro MA, Uriz MJ, Maldonado M, Turon X, editors. Advances in Sponge Sci-ence: Phylogeny, Systematics, Ecology. Advances in Marine Biology. 612012. p. 273–344.
37. de Goeij JM, van Oevelen D, Vermeij MJA, Osinga R, Middelburg JJ, de Goeij AFPM, et al. Surviving in a Marine Desert: The Sponge Loop Retains Resources Within Coral Reefs. Science. 2013; 342 (6154):108–10. doi:10.1126/science.1241981WOS:000325126100056. PMID:24092742
38. Armstrong RA, Singh H, Torres J, Nemeth RS, Can A, Roman C, et al. Characterizing the deep insular shelf coral reef habitat of the Hind Bank marine conservation district (US Virgin Islands) using the Sea-bed autonomous underwater vehicle. Continental Shelf Research. 2006; 26(2):194–205. doi:10.1016/ j.csr.2005.10.004WOS:000235251400004.
39. McMurray SE, Blum JE, Pawlik JR. Redwood of the reef: growth and age of the giant barrel sponge Xestospongia muta in the Florida Keys. Marine Biology. 2008; 155(2):159–71. doi: 10.1007/s00227-008-1014-zWOS:000258160000004.
40. Loh T-L, Pawlik JR. Chemical defenses and resource trade-offs structure sponge communities on Caribbean coral reefs. Proceedings of the National Academy of Sciences of the United States of Amer-ica. 2014; 111(11):4151–6. doi:10.1073/pnas.1321626111WOS:000333027900062. PMID: 24567392
41. McMurray SE, Pawlik JR, Finelli CM. Trait-mediated ecosystem impacts: how morphology and size affect pumping rates of the Caribbean giant barrel sponge. Aquatic Biology. 2014; 23(1):1–13. doi:10. 3354/ab00612WOS:000346420100001.
42. Weisz JB, Lindquist N, Martens CS. Do associated microbial abundances impact marine demosponge pumping rates and tissue densities? Oecologia. 2008; 155(2):367–76. PMID:18030495
44. Montalvo NF, Hill RT. Sponge-Associated Bacteria Are Strictly Maintained in Two Closely Related but Geographically Distant Sponge Hosts. Applied and Environmental Microbiology. 2011; 77(20):7207– 16. doi:10.1128/aem.05285-11WOS:000295836700017. PMID:21856832
45. Montalvo NF, Mohamed NM, Enticknap JJ, Hill RT. Novel actinobacteria from marine sponges. Antonie Van Leeuwenhoek International Journal of General and Molecular Microbiology. 2005; 87(1):29–36. doi:10.1007/s10482-004-6536-xWOS:000227231000005.
46. Lopez-Legentil S, Pawlik JR. Genetic structure of the Caribbean giant barrel sponge Xestospongia muta using the I3-M11 partition of COI. Coral Reefs. 2009; 28(1):157–65. doi: 10.1007/s00338-008-0430-3WOS:000263071800021.
47. Erwin PM, Thacker RW. Incidence and identity of photosynthetic symbionts in Caribbean coral reef sponge assemblages. Journal of the Marine Biological Association of the United Kingdom. 2007; 87 (6):1683–92. WOS:000252475100032.
48. Vicente V. Response of sponges with autotrophic endosymbionts during the coral-bleaching episode in Puerto Rico. Coral reefs. 1990; 8(4):199–202.
49. Cowart JD, Henkel TP, McMurray SE, Pawlik JR. Sponge orange band (SOB): a pathogenic-like condi-tion of the giant barrel sponge, Xestospongia muta. Coral Reefs. 2006; 25(4):513-. doi:10.1007/ s00338-006-0149-yWOS:000242058400002.
50. Lopez-Legentil S, Erwin PM, Pawlik JR, Song B. Effects of Sponge Bleaching on Ammonia-Oxidizing Archaea: Distribution and Relative Expression of Ammonia Monooxygenase Genes Associated with the Barrel Sponge Xestospongia muta. Microbial Ecology. 2010; 60(3):561–71. doi: 10.1007/s00248-010-9662-1WOS:000282971400009. PMID:20390264
51. McMurray SE, Blum JE, Leichter JJ, Pawlik JR. Bleaching of the giant barrel sponge Xestospongia muta in the Florida Keys. Limnology and Oceanography. 2011; 56(6):2243–50. doi:10.4319/lo.2011. 56.6.2243WOS:000299349700024.
52. Angermeier H, Kamke J, Abdelmohsen UR, Krohne G, Pawlik JR, Lindquist NL, et al. The pathology of sponge orange band disease affecting the Caribbean barrel sponge Xestospongia muta. Fems Microbi-ology EcMicrobi-ology. 2011; 75(2):218–30. doi:10.1111/j.1574-6941.2010.01001.xWOS:000285877100004. PMID:21118276
53. Lopez-Legentil S, Song B, McMurray SE, Pawlik JR. Bleaching and stress in coral reef ecosystems: hsp70 expression by the giant barrel sponge Xestospongia muta. Molecular Ecology. 2008; 17 (7):1840–9. doi:10.1111/j.1365-294X.2008.03667.xWOS:000254384700019. PMID:18331247 54. Swierts T, Peijnenburg KTCA, de Leeuw C, Cleary DFR, Hornlein C, Setiawan E, et al. Lock, Stock and
Two Different Barrels: Comparing the Genetic Composition of Morphotypes of the Indo-Pacific Sponge Xestospongia testudinaria. Plos One. 2013; 8(9). doi:10.1371/journal.pone.0074396
WOS:000326240100105.
55. Odorico D, Miller D. Internal and external relationships of the Cnidaria: implications of primary and pre-dicted secondary structure of the 5'–end of the 23S–like rDNA. Proceedings of the Royal Society of London Series B: Biological Sciences. 1997; 264(1378):77–82. PMID:9061962
56. Misof B, Erpenbeck D, Sauer K. Mitochondrial gene fragments suggest paraphyly of the genus Panorpa (Mecoptera, Panorpidae). Molecular phylogenetics and evolution. 2000; 17(1):76–84. PMID:11020306 57. Erpenbeck D, Breeuwer J, van der Velde H, van Soest R. Unravelling host and symbiont phylogenies
of halichondrid sponges (Demospongiae, Porifera) using a mitochondrial marker. Marine Biology. 2002; 141(2):377–86.
58. Nei M. Molecular evolutionary genetics: Columbia university press; 1987.
59. Excoffier L, Lischer HE. Arlequin suite ver 3.5: a new series of programs to perform population genetics analyses under Linux and Windows. Molecular ecology resources. 2010; 10(3):564–7. doi:10.1111/j. 1755-0998.2010.02847.xPMID:21565059
60. Excoffier L, Smouse PE, Quattro JM. Analysis of molecular variance inferred from metric distances among DNA haplotypes: application to human mitochondrial DNA restriction data. Genetics. 1992; 131 (2):479–91. PMID:1644282
61. Tamura K, Stecher G, Peterson D, Filipski A, Kumar S. MEGA6: molecular evolutionary genetics analy-sis version 6.0. Molecular biology and evolution. 2013; 30(12):2725–9. doi:10.1093/molbev/mst197 PMID:24132122
62. Salzburger W, Ewing GB, Von Haeseler A. The performance of phylogenetic algorithms in estimating haplotype genealogies with migration. Molecular ecology. 2011; 20(9):1952–63. doi: 10.1111/j.1365-294X.2011.05066.xPMID:21457168
64. Hey J. Isolation with migration models for more than two populations. Molecular biology and evolution. 2010; 27(4):905–20. doi:10.1093/molbev/msp296PMID:19955477
65. Huang D, Meier R, Todd PA, Chou LM. Slow mitochondrial COI sequence evolution at the base of the metazoan tree and its implications for DNA barcoding. Journal of Molecular Evolution. 2008; 66 (2):167–74. doi:10.1007/s00239-008-9069-5PMID:18259800
66. Müller W, Li J, Schröder H, Qiao L, Wang X. The unique skeleton of siliceous sponges (Porifera; Hexac-tinellida and Demospongiae) that evolved first from the Urmetazoa during the Proterozoic: a review. Biogeosciences Discussions. 2007; 4(1):385–416.
67. Bak R, Engel M. Distribution, abundance and survival of juvenile hermatypic corals (Scleractinia) and the importance of life history strategies in the parent coral community. Marine Biology. 1979; 54 (4):341–52.
68. Miloslavich P, Manuel Diaz J, Klein E, Jose Alvarado J, Diaz C, Gobin J, et al. Marine Biodiversity in the Caribbean: Regional Estimates and Distribution Patterns. Plos One. 2010; 5(8). doi:10.1371/journal. pone.0011916WOS:000280520400012.
69. Cowen RK, Paris CB, Srinivasan A. Scaling of connectivity in marine populations. Science. 2006; 311 (5760):522–7. doi:10.1126/science.1122039WOS:000235071400046. PMID:16357224
70. Maldonado M. The ecology of the sponge larva. Canadian Journal of Zoology-Revue Canadienne De Zoologie. 2006; 84(2):175–94. doi:10.1139/z05-177WOS:000237200100005.
71. Bell JJ, Davy SK, Jones T, Taylor MW, Webster NS. Could some coral reefs become sponge reefs as our climate changes? Global Change Biology. 2013; 19(9):2613–24. doi:10.1111/gcb.12212 WOS:000322758000002. PMID:23553821
72. Bell JJ, Smith D, Hannan D, Haris A, Jompa J, Thomas L. Resilience to Disturbance Despite Limited Dispersal and Self-Recruitment in Tropical Barrel Sponges: Implications for Conservation and Manage-ment. Plos One. 2014; 9(3). doi:10.1371/journal.pone.0091635WOS:000333352800044.
73. de Voogd NJ, Becking LE, Cleary DFR. Sponge community composition in the Derawan Islands, NE Kalimantan, Indonesia. Marine Ecology Progress Series. 2009; 396:169–80. doi:10.3354/meps08349 WOS:000273549400017.
74. Brandt ME. The effect of species and colony size on the bleaching response of reef-building corals in the Florida Keys during the 2005 mass bleaching event. Coral Reefs. 2009; 28(4):911–24. doi:10. 1007/s00338-009-0548-yWOS:000271069900015.
75. Meesters EH, Wesseling I, Bak RPM. Coral colony tissue damage in six species of reef-building corals: Partial mortality in relation with depth and surface area. Journal of Sea Research. 1997; 37(1–2):131– 44. doi:10.1016/s1385-1101(96)00004-4WOS:A1997XE26600011.
76. Meesters EH, Wesseling I, Bak RPM. Partial mortality in three species of reef-building corals and the relation with colony morphology. Bulletin of Marine Science. 1996; 58(3):838–52. WOS:
A1996UP20500017.
77. Humman P. Reef creature identification. New World Pubs Inc Jacksonville, Fla. 1992.
78. Buettner GR, Jurkiewicz BA. Catalytic metals, ascorbate and free radicals: combinations to avoid. Radi-ation research. 1996; 145(5):532–41. PMID:8619018
79. Hentschel U, Usher KM, Taylor MW. Marine sponges as microbial fermenters. FEMS Microbiology Ecology. 2006; 55(2):167–77. PMID:16420625
80. Montalvo NF, Davis J, Vicente J, Pittiglio R, Ravel J, Hill RT. Integration of Culture-Based and Molecu-lar Analysis of a Complex Sponge-Associated Bacterial Community. Plos One. 2014; 9(3). doi:10. 1371/journal.pone.0090517WOS:000332842400020.
81. Duffy JE. HOST USE PATTERNS AND DEMOGRAPHY IN A GUILD OF TROPICAL SPONGE-DWELLING SHRIMPS. Marine Ecology Progress Series. 1992; 90(2):127–38. doi:10.3354/ meps090127WOS:A1992KL43000003.
82. Henkel TP, Pawlik JR. Habitat use by sponge-dwelling brittlestars. Marine Biology. 2005; 146(2):301– 13. doi:10.1007/s00227-004-1448-xWOS:000225905700009.
83. van Duyl FC, Moodley L, Nieuwland G, van Ijzerloo L, van Soest RWM, Houtekamer M, et al. Coral cav-ity sponges depend on reef-derived food resources: stable isotope and fatty acid constraints. Marine Biology. 2011; 158(7):1653–66. doi:10.1007/s00227-011-1681-zWOS:000291922200017. PMID: 24391268
84. Mueller B, de Goeij JM, Vermeij MJA, Mulders Y, van der Ent E, Ribes M, et al. Natural Diet of Coral-Excavating Sponges Consists Mainly of Dissolved Organic Carbon (DOC). Plos One. 2014; 9(2). doi: 10.1371/journal.pone.0090152WOS:000332385900121.
86. Bak RPM, Joenje M, de Jong I, Lambrechts DYM, Nieuwland G. Bacterial suspension feeding by coral reef benthic organisms. Marine Ecology Progress Series. 1998; 175:285–8. doi:10.3354/meps175285 WOS:000077992700025.