Ensaios Econômicos
Escola de
Pós-Graduação
em Economia
da Fundação
Getulio Vargas
N◦ 780 ISSN 0104-8910
Health
Care
Reform
or
More
Affordable
Health Care?
Pedro Cavalcanti Ferreira, Diego B. P. Gomes
Os artigos publicados são de inteira responsabilidade de seus autores. As
opiniões neles emitidas não exprimem, necessariamente, o ponto de vista da
Fundação Getulio Vargas.
ESCOLA DE PÓS-GRADUAÇÃO EM ECONOMIA Diretor Geral: Rubens Penha Cysne
Vice-Diretor: Aloisio Araujo
Diretor de Ensino: Carlos Eugênio da Costa Diretor de Pesquisa: Humberto Moreira
Vice-Diretores de Graduação: André Arruda Villela & Luis Henrique Bertolino Braido
Cavalcanti Ferreira, Pedro
Health Care Reform or More Affordable Health Care?/ Pedro Cavalcanti Ferreira, Diego B. P. Gomes – Rio de Janeiro : FGV,EPGE, 2016
44p. - (Ensaios Econômicos; 780)
Inclui bibliografia.
Health Care Reform or More Affordable Health Care?
Pedro Cavalcanti Ferreira∗
FGV/EPGE
ferreira@fgv.br
Diego B. P. Gomes ∗
FGV/EPGE
diego.gomes@gmail.com
June 17, 2016
Abstract
This article investigates the impact on the U.S. economy of making health care more affordable. We compare health care cost reductions with the Patient Protection and Affordable Care Act (PPACA) using a rich life cycle general equilibrium model with heterogeneous agents. We found that all policies were able to reduce uninsured population, but the PPACA was the most effective: in the long run, less than 5% of Americans would remain uninsured. Cost reductions alleviated the government budget, while tax hikes were needed to finance the reform. Feasible cost reductions are less welfare improving than the PPACA.
Keywords: health care reform, affordable health care, health care costs, health
insurance, general equilibrium, policy evaluation
JEL Codes: D91, E21, E62, H51, I13, I18, I38, E65
∗We would like to thank Carlos E. da Costa, Cezar Santos, Eduardo Zilberman, Felipe Iachan,
1
Introduction
Health care costs in the U.S. are known to be high, especially when compared to other OECD countries. According to the OECD System of Health Accounts (SHA), in 2010, even controlling for income, population size, and cost of living, the U.S. spent 41.7% more on health care than would be predicted by the OECD trend. This amounts to $2,428 per year in excess for every American. At the same time, the share of uninsured population in the U.S. is also high: 13.1% in 2010, according to the Medical Expenditure Panel Survey (MEPS). Medical bills are the biggest cause of U.S. bankruptcies, and accounted for 62.1% of all bankruptcies in 2007 (Himmelstein et al.(2009)). Furthermore, between 2001 and 2007, the share of bankruptcies attributable to medical problems rose by 50%. To address this issue, on March 23, 2010, President Barack Obama signed into law the Patient Protection and Affordable Care Act (PPACA). The primary objective of the bill is to increase health insurance coverage in the U.S. by making health insurance more affordable. To achieve this goal, among many features, the PPACA created a health insurance marketplace where Americans can purchase federally regulated and subsidized health insurance, expanded the Medicaid program, and introduced a mandate where Americans are required to be covered by some health insurance. However, this reform does not directly deal on trying to make health care goods and services more affordable. Instead of increasing public expenditures on health insurance, regulating the private insurance market, and forcing Americans to purchase insurance, the reform could have focused on policies that would reduce health care costs.
In addition, the PPACA is not capturing the important link between high health care costs and high share of uninsured population. After all, higher costs are reflected in higher insurance premiums, leading to a high share of individuals without insurance. By this reasoning, cost reductions could increase the share of covered population, and increasing the share of insured people without dealing with cost reductions may be a way of acting on the consequences of the problem, and not on the cause. Besides, cost reductions can have a potential positive welfare effect by alleviating the budget of individuals.
Therefore, important questions with respect to public policy can be raised. Which would further reduce the uninsured population, the PPACA or more affordable health care? In addition, which would be better in terms of the welfare of individuals? What is the long run impact of these policies on government budget? Which cost reduction would be equivalent to the PPACA regarding the welfare of individuals?
are uncertainties regarding the age of death, health status, medical expenditures, labor productivity, and EHI offer status. Agents choose consumption, labor time, next pe-riod’s asset holdings, and next pepe-riod’s health insurance coverage. Medical expenditures are costly relative to consumption. Five types of health insurance coverage are avail-able: Medicare, Medicaid, employer-sponsored health insurance (EHI), individual health insurance (IHI), and no insurance. Premiums of private insurances are determined en-dogenously. Retirement is exogenous and the income tax is progressive and follows the current law for tax benefits on health insurance and medical expenditures.
The model is calibrated to the U.S. economy before the introduction of the PPACA, and is able to reproduce very closely the health insurance coverage and some key macroe-conomic variables. In particular, the model reproduces the high share of uninsured pop-ulation and the fact that most of the poppop-ulation purchases health insurance through the employer. We then simulated the model considering five changes introduced by the PPACA: premium tax credits, individual mandate, Medicaid expansion, individual health insurance regulation, and the increase in income threshold for claiming deduction of medical expenses in income tax. These changes were simulated individually, to capture the net effect of each one, and then together, to capture the effect of the reform as a whole.
Cost reductions were implemented through exogenous decreases in the relative price of medical expenses to consumption.1 First, to carry out a realistic and politically feasible experiment, we implemented the estimated cost reductions calculated byLiu et al.(2014), which is a Rand Corporation project that identified fourteen ideas for relatively focused changes that would generate health care cost savings at the national level. Second, as a counterfactual benchmark to compare the U.S. with other OECD countries, we applied to the model the reduction in per capita health care expenditures required to bring the U.S. to the OECD trend in 2010. We call these experiments the “Rand Proposal” and “OECD Trend”, respectively. Finally, to assess which cost reduction would be equivalent to the PPACA in terms of welfare, we implemented several reductions in a range limited by both reductions above.
We found that the PPACA as a whole is more effective than cost reductions in reducing uninsured population. It reduced uninsured population by 65.9%, while the Rand Proposal and the OECD Trend decreased it by only 1.4% and 19.7%, respectively. Mainly due to the Medicaid expansion, the PPACA increased public deficit and required an estimated increase of 5.1% in consumption tax rate to rebalance the government budget. In contrast, cost reductions alleviated the fiscal burden of public insurance, reducing public deficit and so tax collection. Regarding welfare effects, the PPACA and cost reductions are welfare improving. The OECD Trend is the most successful, demonstrating the importance of making health care more affordable. On average, we
1
found that a cost reduction of 5% is enough to produce similar welfare effects as those generated by the PPACA.
Our work relates to the literature that uses quantitative models to perform ex ante policy evaluations regarding health care issues.2 Jeske and Kitao(2009) andHuang and
Huffman (2014) study tax subsidies for group health insurance. Attanasio et al. (2010) analyze alternative funding schemes for Medicare. Feng(2010) and Hsu and Lee(2013) investigate public provision for universal health insurance. Pashchenko and Porapakkarm
(2013) and Jung and Tran (2016) study the PPACA. Hansen et al. (2014) evaluate the consequences of expanding the Medicare program. Janicki(2014) accesses the role of asset testing in public health insurance reform. Pashchenko and Porapakkarm(2015) evaluate the importance of reclassification risk in the health insurance market. Our contribution to this literature is that we compare the PPACA with health care cost reductions.
The remainder of the article is organized as follows. Section2presents some stylized facts about health care costs and health insurance coverage. Section3describes our model economy and Section4presents the changes introduced by the PPACA and discusses how they were implemented in the model. Section 5explains the cost reduction experiments, and in the next section the model parameterization is discussed. Section 7 reports the performance of the model in replicating the data, and Section 8 describes the results of the policy analysis. Section9 concludes.
2
Stylized Facts
Countries with higher incomes tend to spend more on health care. However, even taking this relationship into account, the U.S. spends far more on health care than might be predicted. On the left panel of Figure 1, we compare total health care expenditures within the OECD countries. The amount spent by the U.S. is far more than would be expected even adjusting for population size and relative wealth differences. In 2010, the U.S. spent 41.7% more than would be predicted by the OECD trend, which amounts to $2,428 per year in excess for every American.3 The right panel of Figure1 presents the evolution of U.S. health care expenditures as a fraction of GDP. This index has increased substantially, going from 5.68% in 1965 to 17% in 2009, a growth of 200%.
By decomposing the evolution of U.S. health care expenditures, we find that price is the main factor driving its growth. Figure 2 breaks down the evolution of health care expenditures among the growth of three factors: population, prices, and use and intensity. The left panel shows that price is the only factor able to explain the cumulative growth of total expenditures. The right panel shows that the annual growth rates of prices follow
2
There is also a literature that uses quantitative models to study the role of health status, medical expenditures, and/or health insurance over individual decisions. SeePalumbo(1999),French(2005),De Nardi et al.(2010),French and Jones(2011),Hsu(2013),Kopecky and Koreshkova(2014),Zhao(2015), andCapatina(2015).
3
AUS AUT BELCAN CHL CZE DNK EST FIN FRADEU GRC HUN ISL IRL ISR ITAJPN KOR MEX NLD NZL POL PRT SVK SVN ESP SWE CHE TUR GBR USA 2,000 4,000 6,000 8,000
20,000 30,000 40,000 50,000 GDP per Capita
Expenditures per Capita
Health Care Expenditures in 2010
7.5% 10.0% 12.5% 15.0% 17.5%
1970 1980 1990 2000 2010 Year
% of GDP
Expenditures as Fraction of GDP
Figure 1: Facts about health care expenditures. Left: Health care expenditures and GDP per capita across OECD countries in 2010. Right: Evolution of U.S. health care expenditures as a fraction of GDP. Sources: OECD System of Health Accounts (SHA); Authors’ analysis. Notes: Health care expenditures and GDP data are in 2010 dollars and adjusted for purchasing power parity. 0% 1,000% 2,000% 3,000% 4,000%
1970 1980 1990 2000 2010
Year
Gro
wth Rates
Health Care Expenditures
Population
Prices
Use and Intensity
Cumulative Growth
0% 5% 10% 15%
1970 1980 1990 2000 2010
Year
Gro
wth Rates
Annual Growth
Figure 2: Decomposition of U.S. health care expenditures. Left: Cumulative growth rates. Right: Annual growth rates. Sources: National Health Expenditure Accounts (NHEA) andCouncil of Economic Advisers (2013); Authors’ analysis. Notes: Health care expenditures are in nominal terms. Prices are represented by the CPI component for medical care. As a residual, the factor of use and intensity includes any errors in measuring total spending or prices.
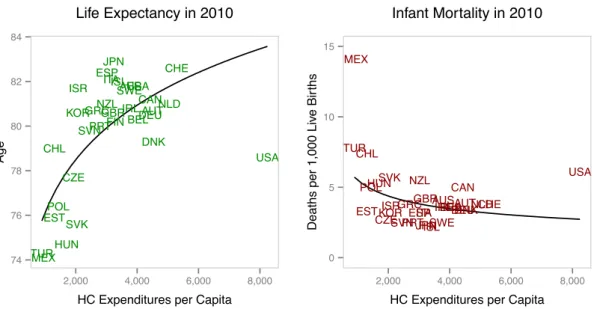
AUS AUT BEL CAN CHL CZE DNK EST FIN FRA DEU GRC HUN ISL IRL ISR ITA JPN KOR MEX NLD NZL POL PRT SVK SVN ESP SWE CHE TUR GBR USA 74 76 78 80 82 84
2,000 4,000 6,000 8,000
HC Expenditures per Capita
Age
Life Expectancy in 2010
AUSAUTBEL CAN CHL CZE DNK EST FIN FRADEU GRC HUN ISL IRL ISR ITA JPN KOR MEX NLD NZL POL PRT SVK
SVNESPSWE CHE TUR GBR USA 0 5 10 15
2,000 4,000 6,000 8,000
HC Expenditures per Capita
Deaths per 1,000 Liv
e Bir
ths
Infant Mortality in 2010
Figure 3: Facts about health outcomes. Left: Life expectancy and health care expenditures per capita across OECD countries in 2010. Right: Infant mortality and health care expenditures per capita across OECD countries in 2010. Sources: OECD System of Health Accounts (SHA); Authors’ analysis. Notes: Health care expenditures data are in 2010 dollars and adjusted for purchasing power parity.
Squires and Anderson (2015) arrive at the same conclusion for hospital, physician, and pharmaceuticals prices across 13 high-income countries in 2013.
This excessive spending cannot be justified by better quality of health services. For instance, the World Health Organization (2000) placed the U.S. health system perfor-mance in the 37th position among 191 countries. In a series of reports from 2004 to
2014, the Commonwealth Fund compared the performance of health care systems among several developed countries regarding quality care, access, efficiency, equity, and healthy lives.4 In every year, the U.S. held the last position in the overall ranking. Looking only at the U.S., McGlynn et al. (2003) identified serious deficits in adherence to rec-ommended processes for basic care, and concluded that adults receive only half of the recommended processes involved in care.
In Figure3, we look at two popular measures of a population’s health among OECD countries: life expectancy and infant mortality. For both measures, in 2010, the U.S. result is worse than what would be expected after adjusting for population size and total health care expenditures. Life expectancy in the U.S. is below the first quartile of the distribution of countries, and Americans live about 5 years less than would be predicted by the OECD trend. Infant mortality in the U.S. is above the third quartile of the distribution of countries, and exhibits about 3.4 more deaths per 1,000 live births than would be predicted by the OECD trend.
In a scenario where medical expenditures are excessive, health insurance becomes essential. In Figure4, we present the evolution of health insurance coverage in the U.S. in
4
The reports areDavis et al.(2004),Davis et al.(2006),Davis et al.(2007),Davis et al.(2010), and
10% 11% 12% 13% 14%
1996 1998 2000 2002 2004 2006 2008 2010
Year
Share of P
opulation
Uninsured
10% 11% 12% 13% 14%
1996 1998 2000 2002 2004 2006 2008 2010
Year
Share of P
opulation
Medicare
10% 12% 14% 16%
1996 1998 2000 2002 2004 2006 2008 2010
Year
Share of P
opulation
Medicaid
55% 60% 65% 70%
1996 1998 2000 2002 2004 2006 2008 2010
Year
Share of P
opulation
Private
Figure 4: Evolution of health insurance coverage in the U.S. over time. Sources: Medical Ex-penditure Panel Survey (MEPS); Authors’ analysis.
3
Model Economy
We built a life cycle general equilibrium model in the tradition of İmrohoroğlu et al.
(1995) and Huggett (1996). We extended these models to consider features of health status, medical expenditures, and health insurance. The benchmark economy consists of a large number of heterogeneous agents, a competitive production sector, a competitive health insurance sector, and a government with a commitment technology. Time is discrete and one model period is a year. All shocks are independent among agents and, as a consequence, there is no uncertainty over the aggregate variables even though there is uncertainty at the individual level.
3.1 Agents
The economy is populated by a large number of heterogeneous agents with age j ∈ {1, . . . , R, . . . , J}, where R is the mandatory retirement age and J is the maximum sur-vival age. The population grows exogenously at a constant rate η. Besides age, agents also differ by education levele, health statush, asset holdingsa, medical expendituresm, labor productivity z, average lifetime earnings x, employer-sponsored health insurance (EHI) offerι, and health insurance coveragei. In each life period, they choose consump-tion cand next period’s asset holdings a′. In addition, workers also choose labor time l
and next period’s health insurance coveragei′. Retirees receive a Social Security benefit
and are covered by Medicare.
Agents face seven sources of individual uncertainty. When entering the economy, they receive an education levele∈ {eL, eH}drawn from the distributionΛ(e), whereeLmeans
low education andeH means high education. The education level is retained throughout
life. They also receive an initial endowment of assets drawn from the distributionΩ(a).5 After this first draw, the evolution of asset holdings is endogenous. In each period of life, health statush∈ {hB, hG}evolves according to a first-order Markov process, where
hB means bad health and hG means good health. Conditional on being at age j, with
education level e, and current health status h, the probability of having next period’s health status h′ is given by Φj,e(h, h′). Survivorship is also uncertain in each period of
life. Conditional on being alive at agej, with education levele, and current health status
h, the probability of surviving to age (j+ 1) is given by Πj,e,h.6 The demographics of
this economy implies that the share of agents of type (j, e, h), denoted by µj,e,h, can be
recursively defined as
µj+1,e,h′ =
Πj,e,hΦj,e(h, h′) 1 +η µj,e,h.
Medical expenditures m ∈ Mj,h are also uncertain throughout life, and its possible
values depend on age and health status. Current expenses are known, but next period’s
5
For other articles that also considered an initial distribution of assets in a life cycle model, see
Hendricks(2007),Kaplan and Violante(2010), andHintermaier and Koeniger(2011).
6
Since all agents enter alive in the economy with agej= 1, we must assume thatΠ0,e,h= 1for all
expenses are uncertain and drawn from the distribution Ψj,h(·), which depends on age
and health status. Therefore, conditional on being at age j, with education level e, and current health statush, the probability of incurring in next period’s medical expenditures
m′, with next period’s health status h′, is given by Φj,e(h, h′)Ψj+1,h′(m′). The relative price of medical expenditures to consumption is denoted by π, implying that the final value paid by agents is πm. Labor productivity z ∈ Z and EHI offer status ι∈ {0,1} jointly evolve over time according to a first-order Markov process, where ι = 0 means that the agent did not receive the offer andι= 1means that the agent received the offer. Conditional on being at agej, with education levele, and current productivity-offer pair (z, ι), the probability of having next period’s productivity-offer pair (z′, ι′) is given by Γj,e(z, ι, z′, ι′).
Asset holdingsa∈ Aare composed by a one-period riskless asset that pays a rate of returnr. Total resources used to acquire these assets are exogenously divided between the productive sector, in the form of capital, and the government, in the form of public debt. Borrowing is not allowed, so that the choice of next period’s asset holdings is such that
a′ ≥0. All assets left by the deceased are collected by the government and distributed to the live agents as a lump-sum bequest transferB. Agents are endowed withℓunits of time. Workers can split this endowment among leisure and labor l∈ 0, lP, lF , where
lP is the time needed for a part-time job, lF is the time needed for a full-time job, and 0 < lP < lF < ℓ. They receive a wage rate
e
w measured in efficiency units, so that the labor income of a worker that suppliesl to the labor market is given byy=wzle .
Agents enjoy utility over consumption, leisure, and health status, and maximize the discounted expected utility throughout life. The intertemporal discount factor is given byβ. The effect of health status on utility is modeled as a fixed time cost.7 In addition, there is a cost of work treated as a loss of leisure. The period utility function is given by
u(c, l, h) =
cγℓ−l−φ
11{l >0}−φ21{h=hB}
1−γ1−σ
1−σ ,
where γ is the share of consumption in utility, σ is the risk aversion parameter, φ1 is
the time cost of work,φ2 is the time cost associated with bad health status, and 1{·} is
an indicator function that maps to one if its argument is true. The term in parentheses represents leisure time.
3.2 Health Insurance
Agents can protect themselves against medical expenditures shocks by acquiring a health insurance i ∈ i0, iM C, iM A, iE, iI , where i0 is no coverage, iM C is Medicare, iM A is
Medicaid, iE is employer-sponsored health insurance (EHI), and iI is individual health 7
insurance (IHI). Medicare and Medicaid are provided by the government, while EHI and IHI are provided by health insurance firms. Health insurance is a one-period contract where the insured commits to pay a premium today and the insurer commits to cover a fraction of medical expenditures in the next period. Thus, the type of insurance coverage that an agent has today was subscribed the period before, and the premium that an agent pays today is for the next period’s coverage. The coinsurance rate of a particular coverage is denoted by q(i, m), which depends on current health insurance type and realized medical expenditures. The premium paid for an insurance coverage is denoted by p(i′, j, h), which depends on the choice of next period’s coverage, age, and current health status. Naturally, we assume that q i0, m= 0 for allm and p i0, j, h = 0 for all (j, h). For ease of notation, we denote net medical expenditures paid by
e
m= [1−q(i, m)]πm.
The government provides health insurance for the elderly through Medicare. Once reaching the retirement ageR, agents are automatically enrolled in this program, meaning that agents aged (R−1) and older cannot choose any other type of health insurance. A fixed premium is charged, so that p iM C, j, h = pM C for all (j, h). Moreover, the
government incurs in administrative costs ϕ per unit of medical expenditures covered by this program. Non retired agents can obtain insurance coverage from Medicaid for free, so that p iM A, j, h = 0 for all (j, h). There are two pathways to qualify for this
program. First, agents are eligible if labor income plus asset income is less than or equal the threshold yM A. Second, agents can become eligible through the Medically Needy program. This happens if labor income plus asset income, minus net medical expenditures, is less than or equal to the threshold yM N, and if assets are less than or
equal to the limitaM N. Thus, the eligibility criteria for Medicaid can be represented by
1M A =
1 if y+ra≤yM A,
1 if y+ra−me ≤yM N and a≤aM N,
0 otherwise.
We assume that there is a representative and competitive health insurance firm op-erating each type of private health insurance contract. Premiums are priced as the expected present value of insured medical expenses. These firms can observe all vari-ables that drive future medical expenditures of insured agents. Revenues collected from premiums today are invested in the asset market and used in the following period to cover possible realized expenditures. They incur in administrative costs κ per unit of medical expenditures covered. There is also a fixed cost κ for providing IHI. This fixed
cost captures the difference in overhead costs between IHI and EHI.8
8
Non retired agents may receive an exogenous offer of an EHI contract, which can only be accepted if they choose to work. The eligibility criteria for an EHI coverage is represented by
1E =
1 if ι= 1 and l >0,
0 otherwise.
As required by law, screening is not allowed when pricing the EHI contract, which means that all participants of the employer-based poll are charged the same fixed premium. Moreover, an employer offering EHI must pay a fraction ω of the premium. Thus, the premium that agents pay for this type of coverage is given byp iE, j, h= (1−ω)pE for all (j, h). IHI coverage is always available for non retired agents. Screening is allowed for this type of health insurance, which means that there is a contract for each type of age-health pair. Thus, the premium charged for this coverage is given by p iI, j, h=pI(j, h).
As seen above, the set of possible coverages available for non retired agents is not static, and may change according to the options that an agent is eligible to choose. Since Medicaid is free, we assume that Medicaid-eligible agents cannot stay uninsured. Therefore, the set of choices for next period’s health insurance must satisfy
i′∈
i0, iI if
1M A= 0 and 1E = 0,
i0, iE, iI if 1M A= 0 and 1E = 1,
iM A, iI if
1M A= 1 and 1E = 0,
iM A, iE, iI if
1M A= 1 and 1E = 1.
(1)
3.3 Production Sector
We assume that there are two representative firms which act competitively and produce a single consumption good. Both firms maximize profits using capital and labor as inputs. Their production functions are the same and take the form of a Cobb-Douglas specification, given byF(K, L) =AKαL1−α, whereK and L are aggregate capital and
labor inputs, A is total factor productivity, and α is the share of capital in the output. Capital depreciates at a rate δ each period. The difference between the two firms lies in the fact that one offers EHI to its workers and the other not. The firm that offers the insurance must pay a fraction of the premiums for the agents who have accepted the offer. This cost is passed on to all its employees through a wage rate reduction. In specifying this reduction, we follow Jeske and Kitao (2009) and assume that this firm subtract the amountχfrom the wage rate of all its workers. This amount is just enough to cover the firm’s total premium cost.
Indexing by0 the firm that does not offer EHI and by1 the firm that offers EHI, we can write the problems of both firms as
max K0,L0
and
max K1,L1
F(K1, L1)−(r1+δ)K1−(w1+χ)L1.
Assuming that capital is freely allocated between both firms, by no arbitrage we have thatr0 =r1≡r. From the first order conditions for capital, this implies that the
capital-labor ratio of both firms are equal, that is, K0/L0 =K1/L1. Therefore, from the first
order conditions for labor, we must have that w1 = w0 −χ ≡ w−χ. Thus, from the
agents’ point of view, we can summarize the wage rate received by a worker as being
e
w=
w if ι= 0,
w−χ if ι= 1.
3.4 Government
The government taxes agents in order to finance its public programs: Medicare, Medicaid, Social Security, and Social Insurance. In addition to taxes, its revenue is also composed by Medicare premiums and issuance of a one-period riskless debtD, which by no arbitrage must carry the same return in equilibrium as claims to capital. These revenues finance Medicare and Medicaid coverages, Social Security benefits, Social Insurance transfers, government expenditures G, and the servicing and repayment of the debt.
All agents are charged income tax according to a progressive functionτY yT, which
is levied on taxable income yT. Taxable income is based on labor and asset income.
According to the current law for tax benefits, the amount of EHI premium can be de-ducted from taxable income in the calculation of income tax. Moreover, agents can also deduct net medical expenditures paid that exceed a fractionξ of labor income plus asset income.9 Therefore, taxable income can be formalized by
yT = maxny+ra−(1−ω)pE1{i′=iE}−max{me −ξ(y+ra),0},0 o
.
The progressive income tax function follows the rules of the Internal Revenue Service (IRS), and can be recursively defined as
τY yT=τY (yn) +τn+1 yT −yn
if yn< yT ≤yn+1,
where {τn} are the marginal income tax rates, {yn} are the income brackets, and n ∈
{0, . . . ,6}. It also must satisfyτY (0) = 0.10
9
SeeMulvey(2012) for references on the current law for tax benefits on health insurance and medical expenses.
10
Agents also pay a consumption tax τC, which is proportional and levied directly on
consumption. Workers must pay a Social Security tax τSS, which is proportional and
levied on the minimum between labor income and the Social Security wage base ySS.
They also have to pay a Medicare tax τM C, which is proportional and levied on labor income. The EHI premium is also tax deductible in calculating taxes from Social Security and Medicare. We can formalize the Social Security and Medicare taxes, respectively, by
TSS =τSSminnmaxny−(1−ω)pE1{i′=iE},0 o
, ySSo
and
TM C=τM Cmaxny−(1−ω)pE1{i′=iE},0 o
.
For ease of notation, we define total taxes paid, excluding consumption tax, by
T =τY yT+TSS+TM C.
The government pays Social Security benefits to agents that reach the retirement age R. This benefit depends on average lifetime earningsx∈ X, which is calculated by taking into account individual earnings up to age(R−1).11 It can be recursively defined as
x′ =
x(j−1) + miny, ySS
j if j < R,
x if j≥R.
The benefit function b(x) corresponds to thePrimary Insurance Amount (PIA).12 It is calculated as a piecewise linear function, which in accordance with the rules of the U.S. Social Security system is given by
b(x) =
θ1x if x≤x1,
θ1x1+θ2(x−x1) if x1 < x≤x2,
θ1x1+θ2(x2−x1) +θ3(x−x2) if x2 < x≤ySS,
where{x1, x2}are the bend points of the function and the parameters{θ1, θ2, θ3}satisfy
0≤θ3< θ2 < θ1.
The government also commits to a Social Insurance transfer that works as a means-tested program that guarantees a minimum level of consumption c to every agent by supplementing income with a lump-sum transferTSI.13 We followHubbard et al.(1995)
11
According to the Social Security legislation, the average lifetime earnings should be calculated by taking into account the 35 highest individual earnings up to theEarliest Retirement Age. For simplicity, we consider the whole history of earnings, since it is hard to identify the 35 highest earnings when solving the model.
12
This is the benefit that individuals are entitled to at theFull Retirement Age. Its value is neither reduced for early retirement nor increased for delayed retirement.
13
and assume that this transfer occurs ifc is greater than total resources minus necessary expenditures. Total resources are defined as the sum of labor income (or Social Security benefit), total assets, and bequest transfer. Necessary expenditures are defined as the sum of taxes and net medical expenditures paid. If the agent is insured by Medicare, we consider the Medicare premium as a necessary expenditure. Therefore, we can formalize the Social Insurance transfer by
TSI =
max 1 +τCc+T + e
m−y−(1 +r)a−B, 0 if j≤R−2,
max 1 +τCc+T +me +pM C−y−(1 +r)a−B,0 if j=R−1, max 1 +τCc+T +
e
m+pM C−b(x)−(1 +r)a−B,0 if R≤j < J, max 1 +τCc+T +
e
m−b(x)−(1 +r)a−B,0 if j=J.
3.5 Agents’ Problem
There are two groups of heterogeneous agents: workers and retirees. Workers are those aged (R−1) and younger, while retirees are those aged R and older. The state vector of a worker is given by (j, e, h, a, m, z, x, ι, i), and its value function is given by VW.
Similarly, the state vector of a retiree is given by (j, e, h, a, m, x), and its value function is given byVR. The problem of agents must be solved separately for specific age groups. For j ∈ {1, . . . , R−2}, agents are workers in the current period and will remain workers in the next period. They choose consumption, labor supply, next period’s asset holdings, and next period’s health insurance coverage. Their problem can be recursively defined as
VW(j, e, h, a, m, z, x, ι, i) = max
(c,l,a′,i′)
u(c, l, h)+βΠj,e,hEVW j+ 1, e, h′, a′, m′, z′, x′, ι′, i′
subject to
1 +τCc+a′+me +p i′, j, h+T =y+ (1 +r)a+TSI+B,
c≥0, l∈0, lP, lF , a′ ≥0,
with i′ satisfying equation (1). For j = (R−1), there are two differences in relation
to the above problem. First, because these agents will be retirees in the next period, they take into account the expected value function of retirees in the next period rather than the expected value function of workers. Second, as they will automatically have Medicare in the next period, they pay the fixed Medicare premium and no longer choose next period’s health insurance coverage.
For j ∈ {R, . . . , J−1}, agents are retirees in the current period and will remain retirees in the next period, no longer choosing labor supply. They choose consumption and next period’s asset holdings, and receive Social Security benefit in the current period.
Their problem can be recursively defined as
VR(j, e, h, a, m, x) = max
(c,a′)
u(c,0, h) +βΠj,e,hEVR j+ 1, e, h′, a′, m′, x′
subject to
1 +τCc+a′+me +pM C+T =b(x) + (1 +r)a+TSI+B,
c≥0, a′≥0.
For j = J, there are two differences in relation to the above problem. First, because these agents will be dead next period, they no longer take into account the expected value function of retirees in the next period. Second, because they will no longer use the Medicare coverage next period, they do not pay the fixed Medicare premium.
We present the formal equilibrium definition in the online appendix that accompanies this article.
4
Health Care Reform
In this section we describe the changes implemented by the PPACA and show how they were implemented in the model. An important concept created by the reform is affordable health insurance. This concept is important to determine who will receive premium tax credits and who will be exempt from paying penalties for being uninsured. If an agent is not eligible to choose an EHI coverage, then the IHI contract will be considered affordable if its premium costs less than or equal to a fraction dI of the agent’s labor income plus
asset income. On the other hand, if an agent is eligible to choose an EHI coverage, then the EHI contract will be considered affordable if the part of the premium that should be paid by the agent costs less than or equal to a fraction dE of the agent’s labor income
plus asset income. The affordable health insurance criteria can be formalized as
1A=
1 if 1E = 0 and pI(j, h)≤dI(y+ra), 1 if 1E = 1 and (1−ω)pE ≤dE(y+ra), 0 otherwise.
lower the premium will cost. The premium tax credit can be formalized as
TP =pI(j, h)−εn(y+ra) if 1A= 0 and i′ =iI and gnf ≤(y+ra)< gn+1f,
and equals zero otherwise, where{εn}are the fractions of income spent on insurance,{gn}
are the fractions of the FPL that determine the income categories, and n ∈ {1, . . . ,7}. In order to reflect the premium tax credit in the model, we need to add the credit as a source of funds in the budget of the agents, and also add the aggregate credit as an expense in the government budget.
The reform creates an individual mandate where uninsured agents must pay a penalty to the government unless they are qualified for an exemption. The penalty is equal to the maximum between the value υand a fraction ν of taxable income. Additionally, the maximum value of the penalty is equal to ρ. Uninsured individuals are exempt from the penalty if they cannot afford a health insurance coverage. The penalty can be formalized as
TM =
minmaxυ, νyT , ρ if 1A= 1 and i′ =i0,
0 otherwise.
In order to reflect the individual mandate in the model, we need to add the penalty as an expense in the budget of agents, and also add the aggregated penalty as a revenue in the government budget.
Medicaid eligibility is expanded to all non retired agents with income below a fraction
ζ of the FPL. There are no changes in the Medically Needy Program. In order to reflect the Medicaid expansion in the model, we just need to change the value of the parameter
yM A to ζf. The reform imposes a severe regulation on the IHI market. This regulation limits the ability of insurers to do the screening when pricing IHI contracts. Health insurance firms can no longer condition IHI premiums on health status. The only factor that can affect these premiums is age. Thus, the regulated IHI premiums are given by
p iI, j, h = pR(j) for all h. This regulation is reflected in the model by adjusting the
equilibrium expression of IHI premiums. The reform also increases the income threshold for claiming deduction for medical expenditures, making it much more difficult to qualify for deductions. To reflect this in the model, we just need to change the value of the parameter ξ to the new threshold.
5
Cost Reductions
growth over time.14 Furthermore, we modeled medical expenses as exogenous shocks, abstracting from the fact that individuals have some degree of control over their medical expenses, creating no room for endogenous health care prices. We did so because medical expenses to a significant extent represent exogenous shocks. Preventive medicine, the portion that people really choose, have a low rate of use.15 Besides, costs are not the only or main reason for this low usage.16 Our goal here is to quantify the effects of more affordable health care using the relief in the budgets of individuals and government as the main mechanism.
The “Rand Proposal”, detailed in Liu et al. (2014), is a Rand Corporation project that identified fourteen ideas for relatively focused changes that would generate health care cost savings. As argued by the authors, these ideas are quite feasible to implement and are only moderately politically sensitive.17 Savings were estimated at the national level in 2012 dollars. Considering the national health expenditures of 2012 reported by the Centers for Medicare & Medicaid Services (CMS), this amounts to an annual cost reduction of 0.64%. The proposal was reflected in the model by applying this reduction to the relative price of medical expenditures π.
In the “OECD Trend” experiment, we applied to the model the same percentage reduction in per capita health care expenditures required to bring the U.S. to the OECD trend in 2010, as shown on the left panel of Figure 1. The trend was calculated as a power fit with the GDP per capita as the independent variable and the health care expenditures per capita as the dependent variable. Data is from the OECD System of Health Accounts (SHA), and all values are in 2010 dollars and adjusted for purchasing power parity. Given the U.S. GDP per capita, the U.S. health care expenditures per capita predicted by the trend should be 29.5% lower. We applied this reduction to the relative price of medical expenditures π. We do not know which public policies would be able to generate such a reduction, and we believe that policies capable of that must be difficult to be approved and implemented. However, this reduction makes the U.S. comparable in terms of per capita health care spending with the OECD countries, and serves as a benchmark.
Finally, we performed some cost reductions in a range limited by both reductions above. The main goal of this analysis is to assess which cost reduction would be equivalent
14
In a similar analysis,Keehan et al.(2008) andMoses et al.(2013) also found that prices account for the majority of total health care cost increase. Aaron and Ginsburg(2009) also argue that much of the excess of U.S. spending is attributable to the fact that the unit prices of various services are higher in the United States than elsewhere.
15
Using MEPS data, and controlling for income quintiles, Tables 1 and 12 ofOzkan(2014) show that the average number of years since respondents’ last usage of some forms of preventive care is high. For additional references, seePartnership for Prevention(2007),Maciosek et al.(2010), andAmerica’s Health Rankings(2016).
16
According toPartnership for Prevention(2007), other important factors are the failure of providers to manage their patients regarding preventive medicine, limited investment in developing a prevention-oriented health care workforce, limited training for doctors and other health care providers in delivering preventive care, and lack of information from the public about what preventive services are recommended.
17
to the PPACA in terms of welfare of individuals. The percentage reductions that were evaluated are 5%, 10%, 15%, 20%, and 25%.
6
Model Parametrization
We parameterized the model using several different data sources. Three sources of micro data were used: the Medical Expenditure Panel Survey (MEPS), the Health and Retire-ment Study (HRS), and the Survey of Consumer Finances (SCF). Our main source of macro data is theCouncil of Economic Advisers(2013). Other sources of data were used and will be appropriately cited.
6.1 Education Level
High education level eH corresponds to at least a college degree, and low education leveleL corresponds to at most an incomplete college. To calculate the probabilities of
education level, we used the data fromBarro and Lee(2012). We used data for the years 1990, 1995, 2000, 2005, and 2010, and considered the age groups of individuals aged 20 and over. For each year-age pair, this data set provides the estimated population and the share of population that completed the tertiary education. All data were pooled in order to calculate the average across years and age groups. Using the estimated population as weights, we calculated the weighted average of the share of the population that completed the tertiary education. We assigned this value to Λ eH. The final values obtained are Λ eH= 28.28% and Λ eL= 71.72%.
6.2 Health Status
We used the MEPS database to estimate the transition probabilities of health status. To establish the health status of each individual, we used a perceived health status measure. During a year, individuals are interviewed three times and report their health status on a scale from 1 to 5, where 1 means “excellent” and 5 means “poor”.18 We then calculated the average of the three responses. If this average was greater than 3, we assigned a bad health (hB) to the individual in that year. Otherwise, we assigned a good health (hG).
We used data of the two-year panels from 1996–1997 up to 2009–2010. For each panel, we considered only individuals who answered all three questions about health status in both years.19 We estimated the health transition probabilities using the logit method. We regressed next period’s health status on a constant, age, age squared, age
18
The exact wording of the survey question is: “In general, compared to other people of (PERSON)’s age, would you say that (PERSON)’s health is excellent (1), very good (2), good (3), fair (4), or poor (5)?”.
19
20% 40% 60% 80% 100%
20 40 60 80 100
Age
T
ransition Probability
High Education
Low Education From Bad to Bad
0% 20% 40% 60% 80%
20 40 60 80 100
Age
T
ransition Probability
High Education Low Education From Bad to Good
0% 10% 20% 30%
20 40 60 80 100
Age
T
ransition Probability
High Education
Low Education From Good to Bad
70% 80% 90% 100%
20 40 60 80 100
Age
T
ransition Probability
High Education Low Education From Good to Good
Figure 5: Transition probabilities of health status by age and education level. Top left: From bad health to bad health. Top right: From bad health to good health. Bottom left: From good health to bad health. Bottom right: From good health to good health.
cubic, education level, current health status, and age times current health status.20 The probabilities for ages greater than or equal to 85 were predicted out of the sample using the estimated equation. To deal with the complexity of the sample design of MEPS, our estimation took into account the longitudinal sample weights, the primary sampling unit (PSU), and the stratum of the PSU.21The estimated probabilities are presented in Figure5.
20
We also estimated the same equation using the probit method. The resulting probabilities are very similar.
21
6.3 Demography
In this economy, a period corresponds to one year. We assumed that agents enter the economy at age 20 (j = 1) and can survive to a maximum age of 100 (J = 81). We set the population growth rateη so that the fraction of agents aged 65 and over equaled 12.55% in equilibrium. This target was calculated using population data from Table B–34 ofCouncil of Economic Advisers(2013). We used the average of the fractions from 1996 to 2010. The final value ofη is 2.75%.
We used the HRS database to estimate the survival probabilities. This database focuses on a sample of older individuals and follows them over a long period of time, providing the ideal sample to estimate survival probabilities and how they relate to other variables. Similar to MEPS, the HRS also contains a question on subjective health status, which is important as we want to estimate survival probabilities by health status and want the health status of the two databases to be consistent.22 We used data of all the six cohorts and all the ten waves available in the HRS database.23 We only considered individuals who were age-eligible in each cohort, that is, individuals aged 50 and over at the time of each wave. The survival probabilities were estimated using the population-averaged logit method. We regressed next period’s survival status on a constant, age, age squared, age cubic, education level, health status, and age times health status.24 We assumed that the time-series correlation for observations of each individual are the same regardless of how many years apart the observations are.25
Because HRS observations are two years apart, these estimates are interpreted as the probability of surviving in the next two years given age, education level, and health status observed in the current interview period. We need to transform these estimates into annual survival probabilities. Moreover, we also need to extrapolate the estimates to individuals aged 20 to 49. We describe the details of these adjustments in the online appendix that accompanies this article. The estimated probabilities are presented in Figure6.
22
Despite the similarity, there is a subtle difference between the questions of perceived health status in both databases. MEPS is concerned about the health status relative to others in the same age group, while HRS is concerned about the perception of individuals in relation to themselves. In order to check their comparability, Attanasio et al. (2010) applied the same definition of health status we used to compare the transition probabilities of health status by age and education level in both data sets. They found that the similarity across both samples is considerable.
23
The data used are the HRS cohort from 1992 to 2010, the AHEAD cohort from 1993 to 2010, the CODA cohort from 1998 to 2010, the WB cohort from 1998 to 2010, and the EBB cohort from 2004 to 2010. To keep the two-year interval between responses, we disregarded the responses of the AHEAD cohort in 1995 and the responses in 1992 of the individuals who were in the HRS cohort in 1992 but moved to the AHEAD cohort in 1993.
24
We also estimated, with the same equation, using the population-averaged probit method, the random-effects logit method, and the random-effects probit method. The resulting probabilities are very similar using any of these methods.
25
60% 70% 80% 90% 100%
20 40 60 80 100
Age
Sur
viv
al Probability
Bad Health
Good Health Low Education
60% 70% 80% 90% 100%
20 40 60 80 100
Age
Sur
viv
al Probability
Bad Health
Good Health High Education
Figure 6: Survival probabilities by age, education level, and health status.
6.4 Medical Expenditures
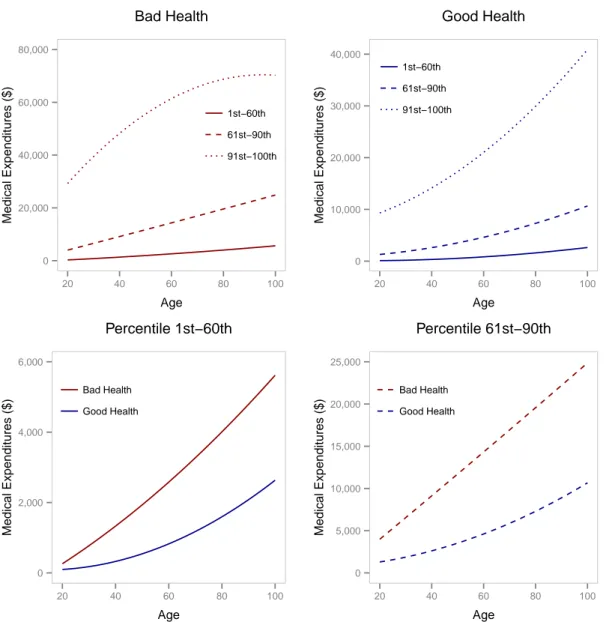
We used the MEPS database to estimate the sets of medical expenditures and their distribution. We used the cross-sectional data from 1996 to 2010. For each cross-section, we considered only individuals aged 20 and over, with strictly positive sample weights, who answered all the three questions about perceived health status in a given year.26 To establish the medical expenditures of each individual, we considered the variable that accounts for total expenditures on health care, which includes out-of-pocket expenditures plus what is covered by insurance, but do not includes insurance premiums. All values were converted to 2010 dollars using the CPI for medical care.27
In order to keep the sample size large enough, we divided our sample into five age groups: 20–29, 30–39, 40–49, 50–64, and 65 or over. We assigned the representative age of each age group to the mid-point of a corresponding interval. For each age group and health status, we approximated the distribution of medical expenditures by a histogram with bins corresponding to the percentiles 1st
–60th
, 61st
–90th
, and 91st
–100th
.28
Within each bin, we calculated the weighted average of medical expenditures using the sample weights. Then, for each bin and health status, we fitted a second order polynomial over these estimates in order to extrapolate the estimated medical expenditures to all ages. Finally, for each age and health status, we used the estimates of each bin to form the three-point set of medical expendituresMj,h. The probabilities are given by the size of
the bins. The estimated medical expenditures are presented in Table 1and Figure 7. We set the relative price of medical expenditures π so that medical expenditures per
26
Unlike health status, we considered the regular sample weights, not the longitudinal ones, since now we made a cross-sectional estimation.
27
We used the CPI for medical care instead of the CPI for all items because of the fact that inflation for medical care has been higher than general inflation.
28
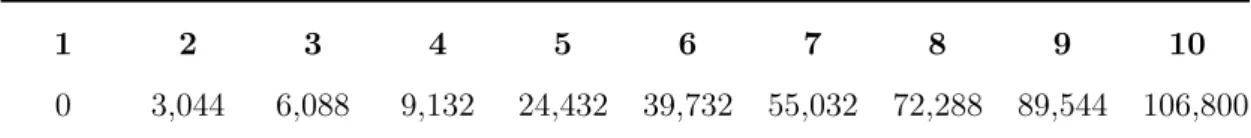
Table 1: Estimated medical expenditures in 2010 dollars by health status and age group
Health Status Age Group 1st –60th
61st –90th
91st –100th
Bad Health 20–29 573.05 5,381.29 35,919.26
30–39 927.97 7,443.46 41,469.40
40–49 1,456.87 9,936.09 49,010.30
50–64 2,562.88 14,015.86 63,508.13
65+ 4,163.66 20,127.19 68,482.20
Good Health 20–29 143.57 1,619.63 10,418.35
30–39 231.42 2,168.09 12,829.43
40–49 356.23 2,680.07 14,235.42
50–64 790.52 4,573.39 20,881.18
65+ 1,699.26 7,626.15 30,999.27
Probabilities 60% 30% 10%
capita of our model was equal to $7,800 in equilibrium. This target was calculated using health expenditures data from the National Health Expenditure Accounts (NHEA) and population data from the Council of Economic Advisers (2013).29 We converted health expenditures to 2010 dollars using the CPI for medical care and took the average of health expenditures per capita from 1996 to 2010. The final value of π is 2.0855.
6.5 Labor Productivity
We used the MEPS database to estimate the set of labor productivities. We used the cross-sectional data from 1996 to 2010. For each cross-section, we considered only indi-viduals aged between 20 and 64, with strictly positive sample weights, and with strictly positive wage income. All wages were converted to 2010 dollars using the CPI for all items. We first calculated the weighted average of wages from the whole sample, which turns out to be $40,396 in 2010 dollars. Next, we approximated the distribution of wages by a histogram with bins corresponding to the percentiles 1st–25th, 26th–50th, 51st–75th,
76th–95th, and 96th–100th.30 Within each bin, we calculated the weighted average of wages using the sample weights. Our labor productivities are then calculated as the ratio of these averages to the average of the whole sample. The final five-point set of labor productivities isZ ={0.2453, 0.6198, 1.0309, 1.7342, 3.5826}.
29
It is well known that MEPS significantly underestimates medical expenditures at the aggregate level compared to those reported in the NHEA (Selden et al. (2001), Sing et al. (2006), and Bernard et al.(2012)). The NHEA relies on surveys of providers, while MEPS statistics are based on surveys of households, which tend to underreport the spending and utilization of medical services. Therefore, it is important to adjust our medical expenditures estimates to be consistent with data at the national level.
30
0 20,000 40,000 60,000 80,000
20 40 60 80 100
Age
Medical Expenditures ($)
1st−60th 61st−90th
91st−100th Bad Health
0 10,000 20,000 30,000 40,000
20 40 60 80 100
Age
Medical Expenditures ($)
1st−60th
61st−90th 91st−100th
Good Health
0 2,000 4,000 6,000
20 40 60 80 100
Age
Medical Expenditures ($)
Bad Health
Good Health
Percentile 1st−60th
0 5,000 10,000 15,000 20,000 25,000
20 40 60 80 100
Age
Medical Expenditures ($)
Bad Health
Good Health
Percentile 61st−90th
Figure 7: Estimated medical expenditures by age and health status. Top left: Fixed bad health status, varying age and percentiles. Top right: Fixed good health status, varying age and percentiles. Bottom left: Fixed percentile 1st
–60th
, varying age and health status. Bottom right: Fixed percentile 61st
–90th
, varying age and health status.
6.6 Stochastic Process for Labor Productivity and EHI Offer
We used the MEPS database to estimate the joint transition probabilities of labor pro-ductivity and EHI offer status. During a year, individuals are interviewed three times and report whether they were offered health insurance at the workplace. We assumed that individuals have received an EHI offer in a given year if they reported receiving an offer in at least one interview. We used data of the two-year panels from 1996–1997 up to 2009–2010. For each panel, we considered only individuals aged between 20 and 64, with strictly positive wage income in both years, and who answered all three EHI offer questions in both years.
the sample size large enough, we divided our sample into five age groups: 20–29, 30–39, 40–49, 50–64, and 65 or over. Because we have five values for labor productivities and two values for EHI offer statuses, the joint Markov process was defined over ten states. Then, for each age group and education level, constructing the transition matrix is simply calculating the weighted fractions of individuals who made the transition from a state (z, ι)in the first year to a state(z′, ι′)in the second year.31 The joint transition matrices can be obtained upon request from the authors.
6.7 Assets
We used the SCF database to estimate the set of assets and the initial distribution of assets. We pooled all the cross-sectional data from 1989, 1992, 1995, 1998, 2001, 2004, 2007, and 2010. We considered only the records of household heads aged 20 and over. Assets were identified from this database as the net worth, and these values were converted to 2010 dollars using the CPI for all items. In the model, assets can only take positive values, so we converted negative net worth values to zero. We first sorted the sample in ascending order by net worth. Then, we divided the ordered sample into 51 groups with the same amount of total net worth, and one specific group containing all zero net worth. The set of assets is formed by the average net worth of each group. The initial distribution of assets are the fractions of individuals aged 20 in each group. These fractions were calculated using the sample weights.
6.8 Preferences
The time endowmentℓwas set to 8,760 hours, which is the total hours in a year consid-ering 365 days per year and 24 hours per day. The time of part-time job lP was set to
1,008, which is the total hours of a part-time job in a year considering 252 workdays per year and 4 hours of work per day. Similarly, considering 8 hours of work per day, we set the time of full-time joblF to 2,016. We set the intertemporal discount factor β so that
the capital-output ratio of our model was equal to 3.02 in equilibrium. This target was calculated using output data from theCouncil of Economic Advisers (2013) and capital data fromFeenstra et al. (2013). We took the average of the ratios from 1996 to 2010. The final value of β is 0.9855. The parameters of the utility function were taken from
French(2005), which structurally estimated the parameters of the same functional form using a model with several features similar to ours. The share of consumption in utility
γ was set to 0.615, the risk aversion parameterσ was set to 7.69, the time cost of work
φ1 was set to 240, and the time cost associated with bad health statusφ2 was set to 202.
6.9 Health Insurance
We used the MEPS database to estimate the coinsurance rates. We used the cross-sectional data from 1996 to 2010. For each cross-section, we considered only individuals
31
30% 40% 50% 60% 70% 80%
0 50,000 100,000 150,000 200,000
Medical Expenditures ($)
Rates
Medicare
Medicaid
EHI
IHI
Coinsurance Rates
Figure 8: Coinsurance rates by type of coverage and medical expenditures.
with strictly positive sample weights and who have incurred strictly positive medical ex-penditures. In our model, agents aged 65 and over are automatic enrolled into Medicare, and cannot have another type of health insurance. Besides, agents aged between 20 and 64 may have Medicaid, EHI, and IHI. Therefore, we only considered individuals aged 65 and over when estimating the coinsurance rates of Medicare, and only considered indi-viduals aged between 20 and 64 when estimating the coinsurance rates of Medicaid, EHI, and IHI.
In MEPS, the questions about the source of health insurance coverage are asked retrospectively for each month of the year. There are specific questions about Medicare, Medicaid, and EHI. We considered individuals as having Medicare, Medicaid, or EHI if they reported having it for all months. Unfortunately, there is no specific question about IHI coverage. To determine if an individual has IHI coverage, we used the questions about nongroup insurance, self-employed insurance, and “source unknown” private insurance. We considered individuals as having IHI coverage if they reported having at least one of these three insurances for all months.
medical expenditures.32 To deal with the complexity of the sample design of MEPS, our estimation took into account the sample weights, the primary sampling unit (PSU), and the stratum of the PSU. To obtain the final coinsurance rates, we applied the estimated equation to the medical expenditures estimated in Section6.4. The estimated coinsurance rates are presented in Figure8.
The Medicare premium pM C refers to the Part B premium, and we set its value to
$1,326, which is the annualized monthly value of 2010 according to Table A-I of Davis et al. (2014). The Medicare’s administrative cost ϕ was set to 1.6083%, which is the average from 1995 to 2010 of the costs reported by the Medicare Boards of Trustees found in Table 1 ofSullivan (2013).
The Medicaid and Medically Needy income thresholds were set to fractions of the Federal Poverty Level (FPL). To determine the FPL, we used data of the poverty guide-lines for the 48 contiguous states and the district of Columbia from 1996 to 2010. These data were collected from the website of the U.S. Department of Health & Human Ser-vices.33 Because the FPL varies with household size, for each year, we calculated the average FPL weighted by the household size distribution. We used household size data from Table 62 of U.S. Census Bureau (2012a). For each year, we divided the average FPL by the corresponding output per capita. We took the average of these ratios and set the FPL f to 36.27% of the output per capita generated by the model.
The Medicaid income threshold yM A was determined using data from Table 3 of
Kaiser Family Foundation(2013a). This table presents the thresholds as a percent of the FPL for jobless and working parents by state. Because the threshold of our model does not depend either on employment status or the state, we calculated the average threshold weighted by the employment status distribution and by the population of each state. The employment status distribution was calculated using data from Table B36 of theCouncil of Economic Advisers (2013). We only considered the labor force aged 20 years or more and took the average of the distribution from 1996 to 2010. The population by state was collected from Table 1 of U.S. Census Bureau (2012b) and we used the values of 2010. The final value ofyM A was set to 85.64% of the FPL.
The Medically Needy income and asset thresholds were determined using data from Table 1 of Kaiser Family Foundation (2012). This table presents both thresholds for singles and couples by state. The income threshold is presented as a percent of the FPL. We assumed that singles are households of size one and couples are households of size greater than one. We calculated the average thresholds weighted by the household size distribution and by the population of each state. Because the table values are for 2009, we used the population values of 2009 and converted the asset threshold values to 2010 dollars using the CPI for all items. The final value ofyM N was set to 53.15% of the FPL
and the final value ofaM N was set to $3,416. 32
We used the logarithm because the scale of medical expenditures is much greater than the scale of coinsurance rates.
33
The private insurance administrative cost κ was set to 12%, which is the value re-ported by the Congressional Budget Office (2008) and Cutler and Ly (2011). The IHI fixed cost κ was set to $30.87. This is the same value calculated by Pashchenko and
Porapakkarm (2013) but converted to 2010 dollars using the CPI for all items. The fraction of the EHI premium paid by the employer ω was calculated using data from Exhibit 6.22 of Kaiser Family Foundation (2013b), which provides data of the average percentage of premiums paid by covered workers for single and family coverage from 1999 to 2013. Because data is of the fraction paid by employees, not employers, we calculated the complement of these fractions. We took the average of the complements from 1999 to 2010 and set the final value of ω to 78.46%.
6.10 Production Sector
We set the total factor productivity A so that the output per capita of our model was equal to $44,855 in equilibrium. This target was calculated using output and population data from the Council of Economic Advisers(2013). We converted the output values to 2010 dollars using the GDP implicit price deflator provided by the same source. We took the average of the outputs per capita from 1996 to 2010. The final value ofA is 5.4475. The share of capital in the output α was set to 0.3358 and the depreciation rate δ was set to 0.0713. These are averages of the values used by related articles in the literature.
6.11 Government
We set the government debtDso that the debt-to-capital ratio of our model was equal to 13.62% in equilibrium. This target was calculated using debt-to-output ratio data from Table B–79 of the Council of Economic Advisers(2013) and the capital-output ratio as explained in Section 6.8. The debt data used was the federal debt held by the public. We took the average of the debt-to-output ratios from 1996 to 2010. Then, we divided the final to-output ratio by the final capital-output ratio to obtain the final debt-to-capital ratio. The government expendituresGwere set so that they represent 18.77% of the output in equilibrium. This target was calculated using output and government expenditures data from Table B–1 of theCouncil of Economic Advisers(2013). We took the average of the ratios from 1996 to 2010.
The fraction ξ used as limit to deduct medical expenditures was taken from the
Internal Revenue Service (2010), and its official value in 2010 was 7.5%. The marginal income tax rates and the income brackets were collected from theTax Foundation(2013). The official values for the marginal income tax rates in 2010 were{τ1, τ2, τ3, τ4, τ5, τ6}=
{10%,15%,25%,28%,33%,35%}. For the income brackets, we took the average of the values corresponding to singles, married filing jointly or qualified widow(er), mar-ried filing separately, and head of household. The final values are {y1, y2, y3, y4, y5} =
{$11,362,$45,387,$101,500,$169,068,$326,943}. We set y0 equals to zero and y6
Table 2: Set of average lifetime earnings
1 2 3 4 5 6 7 8 9 10
0 3,044 6,088 9,132 24,432 39,732 55,032 72,288 89,544 106,800
collected from theSocial Security Administration (2014). For both rates, we added the contributions of the employee and the employer. The final value for τSS is 12.4% and
the final value forτM C is 2.9%.
The retirement age R was set to 46, which represents an age of 65 in the real world. The other parameters were collected from the Official Social Security Website. The Social Security Wage Base ySS was set to $106,800, which is the official value of 2010.34 The bend points of the benefit function{x1, x2}were set to $9,132 and $55,032, respectively,
which are the official annualized values of 2010.35 The parameters
{θ1, θ2, θ3} were set
to their official values, which are 90%, 32%, and 15%, respectively.36 To estimate the set of average lifetime earnings X, we first formed a set containing the value zero, the two bend points of the benefit function, and the Social Security Wage Base. Between each of these points, we added two more points equally spaced to form a final set with 10 elements. The final values are presented in Table2.
We set the minimum level of consumption c so that the share of uninsured in our model was equal to 12.34% in equilibrium. This target was calculated using the MEPS database, and we took the average of the shares from 1996 to 2010. The final value of c
is $6,784.
6.12 Health Care Reform
All parameters of the reform were taken from the two laws that established it: the
Patient Protection and Affordable Care Act (H.R. 3590) and the Health Care and Ed-ucation Reconciliation Act of 2010 (H.R. 4872). The fractions of income of the af-fordable health insurance criteria dI and dE were set to 8% and 9.5%, respectively.
The fractions of the FPL that determine the income categories of the premium tax credit were set to {g1, . . . , g7} = {100%,133%,150%,200%,250%,300%,400%}. For
each income category, the law specifies the interval of maximum premium spending as a percentage of income. We set the fractions of income spent on insurance to be the average of the intervals specified by the law. The final values are {ε1, . . . , ε6} =
{2%,3.5%,5.15%,7.175%,8.775%,9.5%}.
The parameters of the individual mandate were set to the values from 2016 onwards, which represents the end of the transition period. The value υ was set to $695, the fraction of taxable income ν was set to 2.5%, and the maximum penalty ρ was set to
34
Seehttp://www.ssa.gov/oact/cola/cbb.html.
35
Seehttp://www.ssa.gov/oact/cola/bendpoints.html.
36