PONTIFÍCIA UNIVERSIDADE CATÓLICA DO RIO GRANDE DO SUL
FACULDADE DE BIOCIÊNCIAS
PROGRAMA DE PÓS-GRADUAÇÃO EM ZOOLOGIA
DIVERSIDADE GENÉTICA E ESTRUTURA POPULACIONAL DO LOBO-MARINHO SUL-AMERICANO (ARCTOCEPHALUS AUSTRALIS, MAMMALIA, CARNIVORA, OTARIIDE) AO LONGO DA COSTA ATLÂNTICA DA AMÉRICA DO
SUL
Aline Rodrigues de Abreu
Orientador: Prof. Dr. Sandro Luis Bonatto
Co-orientadora: Dra. Tatiane Campos Trigo
DISSERTAÇÃO DE MESTRADO
PORTO ALEGRE – RS – BRASIL
SUMÁRIO
AGRADECIMENTOS ... iii
RESUMO ... iv
ABSTRACT ... v
APRESENTAÇÃO ... vi
ARTIGO: "Genetic diversity and population structure of the South American fur Seal, Arctocephalus australis, along the South American Atlantic coast" ... 1
Abstract ... 2
Introduction ... 2
Materials and Methods ... 4
Results ... 8
Discussion ... 18
References ... 21
Supplementary Material ... 29
CONCLUSÃO ... ix
AGRADECIMENTOS
Agradeço à minha mãe, Vasthi, e ao meu tio, Delmar, pelo apoio e
compreensão nessa “aventura biológica” a qual quis fazer parte.
Ao meu amor, Eric, que sempre esteve ao meu lado. Obrigada pelo apoio, pela ajuda, pelo amor e pelas conversas.
Ao Alemão, meu cachorro vira-latas, pela super companhia e pelas muitas risadas.
Aos demais familiares e amigos pelo apoio e pela diversão.
Agradeço especialmente ao Prof. Sandro Luis Bonatto, pela oportunidade e confiança depositados em mim.
À Prof. Larissa Rosa de Oliveira pela paciência e ensinamentos ao longo do trabalho.
Agradeço à todos os colegas do Genoma, pela amizade e pela ajuda nos trabalhos de bancada e das disciplinas. Obrigada à Tati pela super ajuda nas análises. Obrigada a todos por sempre me ajudarem quando tive dúvidas.
RESUMO
ABSTRACT
APRESENTAÇÃO
O lobo-marinho sul-americano, Arctocephalus australis, é um dos otarídeos mais amplamente distribuídos ao longo do Hemisfério Sul, possuindo colônias reprodutivas tanto na costa Atlântica quanto Pacífica da América do Sul (Vaz-Ferreira, 1982). As principais colônias reprodutivas ocorrem no Uruguai (Cabo Polônio, 34°24 ‟S, 53°46‟W; e Isla de Lobos, 35°00‟S, 54°52‟W), Argentina (Província do Chubut, entre os paralelos 42° e 46° de latitude sul) e ilhas vizinhas (Ilhas dos
Estados, 54°50‟S, 64°35‟W; e Ilhas Falkland 51°41‟S, 60°02‟W), Peru (até Ilha Foca - 5°12´S, 81°12´W) e Chile. Neste último país a distribuição da espécie é interrompida entre a ilha de Chiloé (42°40‟S, 73°59‟W, litoral sul) e a região de Mejillones
(23°06‟S, 70°27‟W, litoral norte) (Guerra & Portflitt,1991).
No Brasil (Ilha dos Lobos, Torres (29°20‟S, 49°42‟W)) bem como no norte da
Argentina ( e.g. Mar del Plata (38°06‟S, 57°33‟W)), não existem colônias reprodutivas da espécie, contudo, dezenas de exemplares de lobos-marinhos, possivelmente oriundos das colônias reprodutivas do Uruguai, chegam entre os meses de outono e primavera, favorecidos em seus deslocamentos pós-reprodutivos principalmente pela corrente fria das Malvinas (Pinedo et al., 1992; Simões-Lopes et al., 1995; Oliveira, 1999; Dassis et al., 2007).
Wynen et al. (2001) propôs que os otarídeos se originaram na região nordeste do Oceano Pacífico sob um clima temperado e que subsequentes dispersões resultaram na grande distribuição geográfica das diversas espécies atuais. Conforme Túnez et al. (2007), a distribuição das populações de A. australis não é contínua, podendo estar separadas por milhares de quilômetros uma da outra. Contudo, isto não quer dizer que estas populações estejam isoladas, pois os lobos-marinhos possuem uma grande capacidade de dispersão. No entanto, a descontinuidade na distribuição - mais de 2.000km na costa sul do Chile – implicou em diferenças evolutivas significativas entre as populações do Pacífico e Atlântico (Oliveira et al. 2008).
Enquanto no Pacífico era observado o sistema de lekking (Majluf et al., 1996), onde os machos se encontram em pequenos territórios que são visitados por fêmeas receptivas (Boness, 1991); no Atlântico o sistema tradicional era o de harém, onde os machos defendem territórios fixos importantes para a termorregulação das fêmeas (Cappozzo et al., 1996). O terceiro estudo compara o tempo de permanência dos adultos nas colônias assim como do filhote com a mãe (Majluf, 1992). Nas colônias do Pacífico, os animais são encontrados nas praias durante todo o ano e os filhotes permanecem aproximadamente de 1-2 anos com a mãe. Já no Atlântico, os indivíduos deixam suas colônias após o período reprodutivo para forrageio, e os filhotes desmamam com menos de um ano (Majluf, 1992). Outros estudos utilizando dados osteológicos e/ou moleculares podem ser citados (Orr et al., 1970; Brunner, 2002; Túnez et al., 2007), em especial o de Oliveira et al. (2008), onde os autores sugeriram que dentre todas as populações de A. australis existentes na América do Sul, as populações do Pacífico e Atlântico apresentam diferenças significativas nas frequências alélicas e na morfologia craniana, o que indicaria que estas populações estariam isoladas geograficamente e seriam consideradas unidades evolutivamente significativas (UES) (do inglês ESUs - evolutionarily significant units). As UES identificam subdivisões populacionais que necessitam de priorização para proteção onde os recursos são limitados (Ryder 1986; Moritz 1994). O mesmo resultado foi observado em linhagens mitocondriais por Túnez et al. (2007) que encontraram monofilia recíproca entre as mesmas populações estudadas. Apesar de todas as informações existentes sobre as UES de A. australis, pouca ou nenhuma informação está disponível com relação a existência de estruturação dentro destas unidades.
Para a realização deste estudo foram feitas análises de sequências da região controladora do DNA mitocondrial e de 11 loci de microssatélites, ambos marcadores altamente variáveis, seletivamente neutros e amplamente utilizados em estudos populacionais (Avise, 1994; Schlötterer, 2004; Oliveira, et al. 2006). É importante salientar também que este é um dos primeiros estudos realizados abrangendo uma ampla distribuição da espécie na Bacia do Oceano Atlântico além de analisar dois marcadores altamente informativos.
Genetic diversity and population structure of the South American fur Seal,
Arctocephalus australis, along the South American Atlantic coast
Aline Rodrigues de Abreu¹; Larissa Rosa de Oliveira²,3, Tatiane Campos Trigo¹, Enrique Alberto Crespo4, Diego Rodriguez5 , Valentina Franco Trecu6 e Sandro L. Bonatto¹
¹ Faculdade de Biociências, Pontifícia Universidade Católica do Rio Grande do Sul (PUCRS), RS,
Brasil
² Laboratório de Ecologia de Mamíferos da Universidade do Vale do Rio dos Sinos (UNISINOS), RS,
Brasil
3
Grupo de Estudos de Mamíferos Aquáticos do Rio Grande do Sul (GEMARS), RS, Brasil
4
Laboratorio de Mamíferos Marinos, Centro Nacional Patagónico (CONICET), Prov. Chubut,
Argentina
5
Facultad de Ciencias Exactas y Naturales, Universidad de Mar del Plata, Prov. Buenos Aires,
Argentina
6 Proyecto Pinnípedos Cetáceos Uruguay, Facultad de Ciencias, Uruguay
Address for correspondence: Dr. Sandro L. Bonatto, Laboratório de Biologia Genômica e Molecular, Faculdade de Biociências, PUCRS, Av. Ipiranga 6681, 90619-900 Porto Alegre, RS, Brazil, Phone: (55 51) 3320.3500 Ext. 4717, Fax: (55 51) 3320.3612, Email: slbonatto@pucrs.br
Abstract
The South American fur Seal, Arctocephalus australis, is distributed along Southern Hemisphere coast with breeding colonies located since Peru until Uruguay. This work focuses on the Atlantic ESU and covers most of the colonies of the Atlantic coast. In recent past, several colonies underwent strong size reduction with hunting and El Niño events. Most studies have focused on investigate the Pacific ESU, little being known about the Atlantic populations. The population structure and genetic variability in this area were assayed with mitochondrial DNA control region and eleven microsatellite loci. The results found high levels of genetic diversity in the region, without evidence of recent genetic bottleneck but with evidence of a population expansion around 200-100 thousand years ago. A sign of genetic structure were found between colonies from Uruguay and Chubut when evaluated by the mtDNA. This is likely due to their strong female philopatry. However, microsatellite analysis did not revealed any existing structure, even between distant areas, supporting that most gene flow is mediated by males. For conservation purposes, these results shows that the South American fur seal Atlantic ESU is a single population and because of that, conservation measures should be aligned among the countries of its distribution.
Introduction
so that these populations should be considered Evolutionarily Significant Units (ESU).
For the Northern South Pacific population, which is the most studied, recently, Oliveira et al. (2009) demonstrated that this ESU suffered with the El Niño Southern Oscillation (ENSO) phenomenon occurred between 1997 and 1998. Due to limited food availability, the population declined from 23,481 to 8,223 individuals and lost genetic variability linked to the reduction of its effective population size. Majluf (1992) also reported that this same population previously suffered a bottleneck in the ENSO of 1982-1983. The importance of these phenomena and their relationship to the fur seal population viability lies in the fact that, according to meteorological models, the ENSOs will become stronger and more frequent due to global warming. Interestingly, Oliveira et al. (2009) found no genetic bottleneck in the Atlantic population studied, reflecting different demographic histories between these two units. However, they analyzed a single Atlantic population, representing the Uruguayan breeding colony.
Hunting was also an important factor in the reduction of the species population size. Records indicate that the beginning of South American fur seal exploitation was about 6,000 years ago along the Atlantic coast by the aborigines (Schiavini, 1987). Commercial exploitation in the Uruguayan coast begun in 1515 and was banned only in 1991 (Ximenez & Langguth, 2002). The same happened on the Pacific coast, where the population was almost exterminated between 1900 and 1946 (Majluf, 1987b; Bonavia, 1982). Although hunting of South American fur seals is no longer allowed in all its distribution, its impact on the genetic diversity of the species was evaluated only for seven nuclear microsatellites and for a single population in the Atlantic coast (Oliveira et al., 2009), having no information for mitochondrial DNA (mtDNA).
This study analyzed the genetic variability, population structure, gene flow and the demographic history of the South American fur seal populations along the Atlantic coast through the use of mtDNA and 11 microsatellite loci.
Materials and Methods
Samples
Biological samples were obtained from 96 South American fur Seals collected along approximately 2,200 km between the southern coast of Brazil (city of Torres -
29°20‟S, 49°42‟W) and the Chubut Province (between parallels 42° e 46° south
latitude). Samples were collected from six areas: Rio Grande do Sul, southern Brazil;
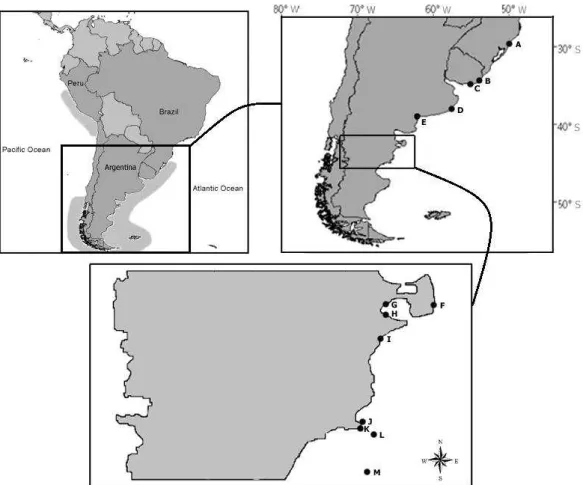
Cabo Polonio (34°24 ‟S, 53°46‟W) and Isla de Lobos (35°00‟S, 54°52‟W), Uruguay; and Mar del Plata (38°06‟S, 57°33‟W), Northern Chubut and Southern Chubut, Argentina (Figure 1, Table S1, Supporting information). Since there is no breeding site in the Brazilian coast, the individuals sampled are mainly from the Uruguayan breeding colonies and stay in Brazil only because of their winter post reproductive displacement (Pinedo et al., 1992; Dassis et al., 2007; Oliveira et al., 2008). All samples were stored individually and kept in 70% ethanol or DMSO, according to the protocol established by Amos and Hoezel (1991).
Figure 1:Map of the species distribution (in light gray) and collecting areas along the Atlantic coast: A: Rio Grande do Sul (Brazil; N=31); B: Cabo Polonio (Uruguay; N=3); C: Isla de Lobos (Uruguay; N=5); D: Mar del Plata (Buenos Aires; N=10); E: Las Grutas (Rio Negro; N=1); F: Punta Delgada (Chubut; N=1); G: El Doradillo (Chubut; N=1); H: Muelle Almirante Storni (Chubut; N=1); I: Rawson (Chubut; N= 1); J: Islote Moreno (Chubut; N=2); K: Isla Rasa (Chubut; N=50); L: Isla Arce (Chubut; N=3); M: 46° 00´S; 64° 00´W (Chubut; N=1).
DNA extraction and amplification
Genomic DNA extractions were carried out following standard phenol-chloroform protocol (Sambrook et al., 2001) or by the use of the kit DNeasy Tissue Kit (Quiagen). Extraction verification was performed in 1% agarose gel and
quantified by comparison with the molecular weight marker “DNA low mass”
Wynen et al. (2000) with modifications, consisting of an initial denaturing period of 90 s at 94°C, 39 cicles of 30 s at 94°C, 45 s at 56°C and 70 s at 72°C, followed by a final extension period of 10 min at 72°C and cooling at 4°C. Amplified products were purified by incubation with alkaline phosphatase and exonuclease I enzymes.
For microsatellite amplification, previously developed loci for pinnipeds were used: Hg8.10, Hg6.3 and Hg4.2, described for Halichoerus grypus; PvcE, Pv9 and Pv11 for Phoca vitulina; M11a for Mirounga sp.; and ZcwE12, ZcwF07, ZcwA12, ZcwG04 e ZcwB07 for Zalophus californianus (Allen et al. 1995; Coltman et al. 1996; Gemmel et al. 1997; Hoffman et al. 2007). The final volume for each amplification reaction was 10 l consisted of: 10 ng of genomic DNA, 1,5 mM of MgCl2, 1X PCR buffer, 0,1 mM of all dNTPs, 0,05 U of Taq DNA polymerase enzyme, 0,016 M of Forward primer marked with M13 tail, 0,25 M of Reverse primer and 0,2mM of M13 fluorescent-labeled primer (Boutin-Ganache et al. 2001). The amplification conditions were the same for all primers, varying only the annealing temperature (Hg8.10,Hg4.2, ZcwE04 and ZcwA12 = 56°C; Hg6.3, Pv11 and ZcwB07 = 58°C; M11a, ZcwG04 and ZcwE12 = 52°C; Pv9, ZcwF07 and Hg1.3 = 54°C). The general amplification conditions consisted of an initial denaturing period of 3 min at 94°C, 29 cycles of 45 s at 94°C, 45 s at <temperature of the primer being amplified>, 90 s at 72°C, followed by a final extension period of 3 min at 72°C and cooling at 4°C. The sequences of the mtDNA control region were generated and the eleven microsatellite loci were genotyped in the automated DNA sequencer MegaBACE 1000.
Mithocondrial DNA analysis
The chromatograms were analyzed and assembled by the Phred-Phrap-Consed package (Ewing et al. 1998, Gordon et al. 1998). The resulting consensus sequences were aligned automatically using ClustalX (Thompson et al., 1997) and manually edited in BioEdit (Hall, 1999).
divergence times and the time to most recent common ancestor (TMRCA) of the species using BEAST 1.6 (Drummond and Rambaut, 2007). BEAST was run with 50 million iterations sampling each 5,000 chains and the first 10% iterations were discarded as burn-in. The runs were visually inspected using TRACER 1.5, summarized in TreeAnnotator 1.6.1, and the inferred tree visualized in FigTree 1.3.1 (http://beast.bio.ed.ac.uk/Tracer).
Measures of genetic variability like haplotype diversity, nucleotide diversity and
mean number of differences among haplotypes, as well as Fu‟s Fs (Fu, 1997) and
Tajima‟s D (Tajima, 1989) neutrality tests were performed using Arlequin 3.11 (Excoffier et al., 2005). Levels of genetic differentiation among the studied populations were evaluated in Arlequin by pairwise fixation index (FST) and the
Analysis of Molecular Variance (AMOVA), the latter using the haplotype frequency (FST) and the proportional distance (ST) approaches. Two different scenarios of
population subdivisions were tested on the Atlantic coast. In the first scenario four populations were considered, one composed of specimens collected in Rio Grande do Sul (Brazil), Cabo Polonio and Isla de Lobos (Uruguay), and the other three remaining populations in Argentina: Mar del Plata, Northern Chubut and Southern Chubut. The second scenario considered two populations, one composed of specimens collected in Rio Grande do Sul, Cabo Polonio, Isla de Lobos and Mar del Plata (Atlantic I), and another represented by specimens from Northern Chubut and Southern Chubut (Atlantic II).
Population genetic parameters such as population growth rate and migration rates were estimated using Lamarc 2.0 (Kuhner, 2006) considering a single population. To that end, a chain of 500,000 genealogies was performed and the genealogies were recorded at an interval range of 100 items and burn-in of 50,000 samples discarded. The substitution rate used was 3.68E-8 site/year (μ) (Tchaika et al., 2007). Fluctuations in population size over time were also evaluated by BEAST with a Bayesian Skyline plot tree prior using the parameters described above.
Microsatellite analysis
(He) and observed heterozygosity (Ho) under Hardy-Weinberg equilibrium (HWE) established using Genepop 3.1 (Rousset & Raymond, 1995). Linkage equilibrium among loci, HWE deviation and estimates of fixation index FST and RST were also
performed by Genepop and Arlequin. Pairwise FST and AMOVA did not include
Northern Chubut population due to the reduced number of individuals genotyped. Genetic structure was also evaluated by the approach implemented in Structure 2.2 (Pritchard et al. 2000) with 1.000.000 iterations and burn-in of 500.000 discarded samples and assuming the admixture and the correlated allele frequencies models. Independent runs were performed with K raging from 1 to 8, each value of K repeated 10 times to evaluate the consistency of the data.
Evidence for recent genetic bottleneck on these populations were evaluated by Bottleneck 1.2.02 (Cornuet and Luikart 1996) using two methods: Stepwise Mutation Model (SMM) and Infinite Allele Model (IAM). Population genetic parameters were estimated similarly to that used above with mtDNA. In this case, the microsatellite mutation rate used was 10-4 and 10-5 per generation (Hongyan,
Chakraborty and Fu, 2005).
Results
Mitochondrial DNA
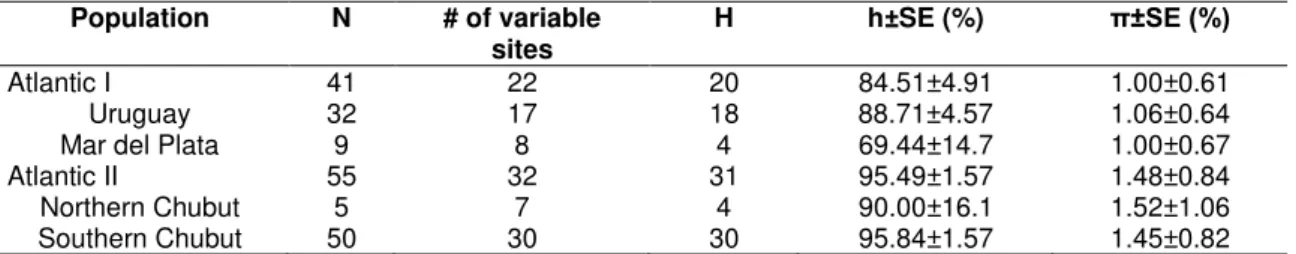
The 96 mtDNA sequences (267bp) obtained were grouped in 43 distinct haplotypes that present 39 polimorphic sites. The haplotipic (h) and nucleotide () diversities (%) observed for the species as a whole were h=91.69±2 and
Table 1: Arctocephalus australis mtDNA basic statistics.
Population N # of variable
sites H h±SE (%) π±SE (%)
Atlantic I 41 22 20 84.51±4.91 1.00±0.61
Uruguay 32 17 18 88.71±4.57 1.06±0.64
Mar del Plata 9 8 4 69.44±14.7 1.00±0.67
Atlantic II 55 32 31 95.49±1.57 1.48±0.84
Northern Chubut 5 7 4 90.00±16.1 1.52±1.06
Southern Chubut 50 30 30 95.84±1.57 1.45±0.82
Uruguay = Rio Grande do Sul + Cabo Polonio + Isla de Lobos.
Atlantic I (Grande do Sul + Cabo Polonio + Isla de Lobos + Mar del Plata), Atlantic II (Northern Chubut + Southern Chubut).
N = number of individuals analyzed, H = number of haplotypes, h = haplotype diversity, π = nucleotide diversity
The haplotype network (Figure 2) show that the central haplotypes are the most frequent and shared between sampling sites, the two most frequent are shared by all six populations sampled. On the contrary, the tip (external) haplotypes present low frequency and are restricted to a single population. Also there is no clear geographic structure in the relationship between the haplotypes. Most haplotypes are very similar, with few mutations between them, some parts of the network show a
clear „‟star” pattern, suggesting an event of population expansion in the evolutionary
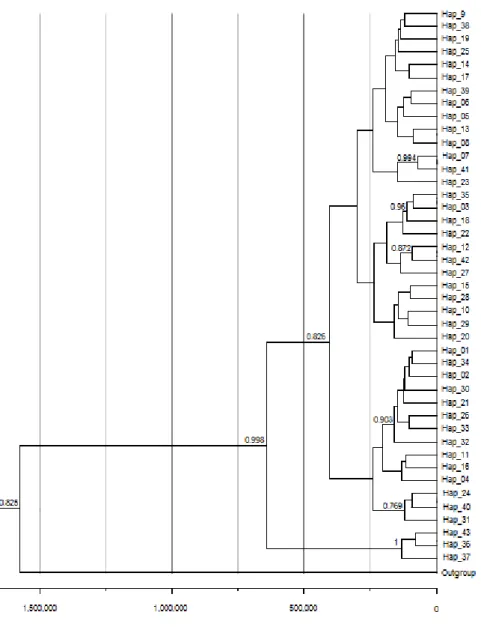
Figure 3: Bayesian haplotype tree with divergence time estimates in years. Branch numbers are posterior probabilities shown only for values above 0.7.
The mtDNA AMOVA analysis showed that more than 95% of the variation occurs within the populations in the two subdivision scenarios, suggesting the existence of a single population along the study area (Table 2). However, some pairwise FST and ΦST indices were significant (Table 3), suggesting some restriction
to gene flow among some of these populations. Significant values were found in the first scenario between Atlantic I and Atlantic II populations (ΦST) and in the second
between Mar del Plata and Southern Chubut (FST) and between Uruguay and
Northern Chubut (ΦST). The Bayesian analysis performed by Lamarc showed
sufficient to genetically homogenize different subpopulations (Lacy 1987; Mills & Allendorf, 1996).
Table 2 - AMOVA analysis based on FST and ΦST for the mtDNA control region for different scenarios of population subdivision of A. australis.
Scenario Percentage of variation
Within populations Among populations Fixation Index
4 populationsa FST 98.58 1.42 0.01420
Φst 97.16 2.84 0.02837*
2 populationsb FST 98.10 1.9 0.01903*
Φst 98.72 1.28 0.01279
*p<0.05
a = Uruguay(Rio Grande do Sul + Cabo Polonio + Isla de Lobos), Mar del Plata, Northern Chubut, Southern Chubut.
b = Atlantic I (Grande do Sul + Cabo Polonio + Isla de Lobos + Mar del Plata), Atlantic II (Northern Chubut + Southern Chubut).
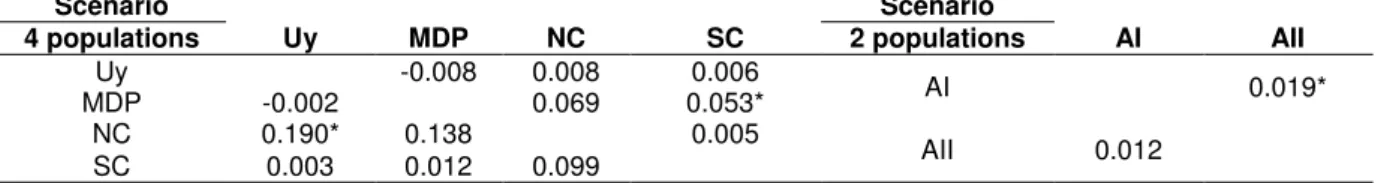
Table 3 – Pairwise values for FST (above diagonal) and ΦST (below diagonal) between populations for each scenario. Figures based on p-distance method for the mtDNA control region.
Scenario Scenario
4 populations Uy MDP NC SC 2 populations AI AII
Uy -0.008 0.008 0.006 AI 0.019*
MDP -0.002 0.069 0.053*
NC 0.190* 0.138 0.005 AII 0.012
SC 0.003 0.012 0.099 *p<0.05
Uy (N=32) = Uruguay (Rio Grande do Sul + Cabo Polonio + Isla de Lobos); MDP (N=9) = Mar Del Plata; NC (N=5) = Northern Chubut; SC (N=50) = Southern Chubut. AI (N=41) = Atlantic I (Grande do Sul + Cabo Polonio + Isla de Lobos + Mar del Plata); AII (N=55) = Atlantic II (Northern Chubut + Southern Chubut). N = number of samples
Figure 4: Bayesian Skyline plot. Y axis: female effective population size.
Table 4: Estimates of A. australis migration produced by Lamarc mtDNA analysis
From To
Uruguay Mar del Plata Northern Chubut Southern Chubut
4 populations
Uruguay - 0.00008 (2.94) 4.22 0.0001 (4.24) 6.53 6.42 (17.6) 41.1
Mar del Plata 0.0004 (2.24) 16.41 - 0.0001 (2.36) 5.8 0.0007 (2.79) 14.68
Northern Chubut 0.0003 (2.5) 9.68 0.00004 (2.47) 4.03 - 0.0007 (2.81) 9.59
Southern Chubut 5.84 (19.06) 19.91 0.00007 (2.63) 4.34 0.0001 (4.11) 6.32 -
From To
Atlantic I Atlantic II
2 populations
Atlantic I - 8.28 (19.71) 40.97
Atlantic II 5.87 (19.03) 19.91 -
Most probable estimates (MPE) of Nm (=number of migrant individuals per generation) are shown in bold flanked by upper and lower 95% confidence values in regular text.
Microsatellite loci
Samples from populations of Rio Grande do Sul (N=12), Isla de lobos (N=5), Cabo Polonio (n=1), Mar del Plata (N=4) and Southern Chubut (N=44) were
100 1000 10000 100000 1000000 10000000 100000000
0 100
200 300
400
kya
Median
Upper
genotyped for eleven autosomal microsatellite loci. All of them were polymorphic with high levels of genetic variability (Table 5, Figure 5). The entire sample had an average of 11.7 allele per locus and an observed (Ho) and expected (He) mean heterozygosity of 0.78 and 0.8, respectively (Table 5). The analysis performed by Micro-Checker revealed that M11a locus presents homozygote excess, possibly caused by the existence of null alleles. However, no deviation of HWE was detected for the entire population after Bonferroni correction. Only one evidence of significant linkage disequilibrium was found between Hg6.3 and ZcwG04 loci (significance level adjusted with a Bonferroni correction for 55 comparisions).
Table 5– Genetic diversity of each locus for each one of the three populations considered and for the entire sample. A = number of alleles, E = number of exclusive alleles,Ho = observed heterozygozity, He = expected heterozygozity. * Loci that deviated from H-W equilibrium after Bonferroni correction.
Locus Allele size
Interval (bp) A E UruguayHo He A Mar del PlataE Ho He A E ChubutHo He A OverallHo He
Pv11 175-205 7 0 0.88 0.84 5 0 1.0 0.85 12 3 0.9 0.85 13 0.9 0.85
Hg8.10 180-208 4 0 0.76 0.73 3 0 1.0 0.75 7 2 0.86 0.75 8 0.84 0.74
M11a 163-203 4 0 0.55* 0.76 5 1 1.0 0.93 9 2 0.48* 0.78 11 0.53 0.79
E12 188-218 7 0 0.94 0.76 4 0 0.75 0.78 13 3 0.81 0.79 13 0.84 0.78
Hg6.3 236-268 6 0 0.72 0.8 7 0 1.0 0.96 11 2 0.75 0.84 12 0.75 0.84
Hg4.2 162-206 8 0 0.94 0.9 6 0 1.0 1.0 14 3 0.9 0.85 15 0.91 0.88
F07 158-172 5 0 0.81 0.8 4 0 0.75 0.82 8 2 0.82 0.81 8 0.81 0.81
A12 191-237 7 1 0.7 0.83 4 0 0.66 0.8 17 6 0.83 0.81 18 0.78 0.81
G04 179-209 6 0 0.88 0.87 6 0 0.75 0.89 11 1 0.92 0.87 12 0.9 0.87
Pv9 106-202 7 0 0.82 0.79 4 0 0.75 0.75 7 1 0.76* 0.8 8 0.78 0.79
B07 183-209 5 0 0.42 0.64 5 0 1.0 0.93 10 5 0.62 0.66 11 0.59 0.68
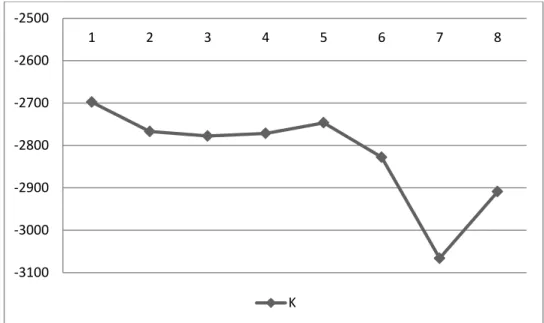
Regarding the genetic structure of the Atlantic ESU, Structure analysis conducted to assess the number of genetically distinct populations (k) contained in our total sample showed the highest mean probability of the data for K = 1, indicating the existence of a single population (Figure 6). Both AMOVA (Tables 6) and pairwise FST and RST values (Table 7) obtained in the two scenarios tested were all
non-significant and extremely low, also indicating the absence of geographic differentiation in the bi-parental markers.
With respect to the demographic history of this ESU (given the results above, the following analyses considered a single population), the genetic bottleneck analysis showed no evidence of recent population decline, with allele frequency presenting a normal L-shaped distribution (as expected under mutation drift equilibrium). The growth rate, calculated from g parameter estimated by Lamarc (g = 0.06 [0.05;0.23]), also indicated a growing population, but recently in a lower rate, in agreement with the Bayesian Skyline plot for mtDNA.
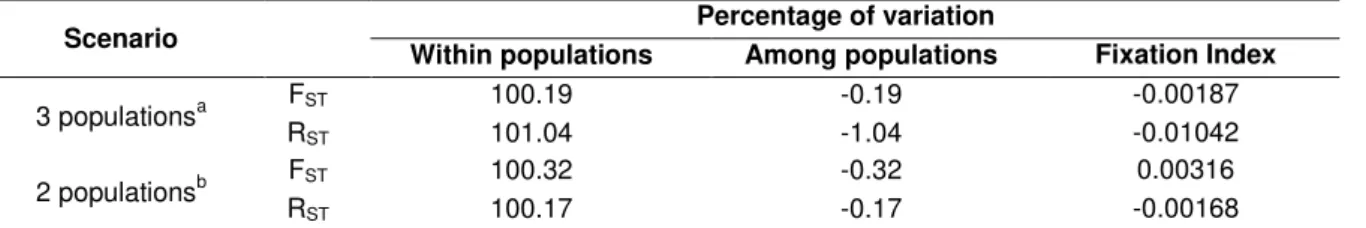
Table 6– AMOVA analysis based on FST and RST for microsatellites for different scenarios of population subdivision of Arctocephalus australis.
Scenario Within populations Percentage of variation Among populations Fixation Index
3 populationsa RFST 100.19 -0.19 -0.00187
ST 101.04 -1.04 -0.01042
2 populationsb RFST 100.32 -0.32 0.00316
ST 100.17 -0.17 -0.00168
None of the values obtained were significant. a
= Uruguay(Rio Grande do Sul + Cabo Polonio + Isla de Lobos), Mar Del Plata, Chubut. b
= Atlantic I (Grande do Sul + Cabo Polonio + Isla de Lobos + Mar del Plata), Atlantic II (Northern Chubut + Southern Chubut).
Table 7– Pairwise values for FST (above diagonal) and RST (below diagonal) between populations for each scenario for microsatellites.
Scenario Scenario
3 populations Uy MDP C 2 populations AI AII
Uy 0.00474 -0.00043 AI -0.00316
MDP -0.04818 -0.01123
C -0.00367 -0.02581 AII -0.00168
None of the values obtained were significant.
Figure 6– Results of the Bayesian analysis conducted in program Structure to assess the number of genetically distinct populations (K) contained in our total sample. Y axis = Estimated Ln probability of data.
Discussion
The matrilineal and bi-parental markers evaluated here presented relatively high levels of genetic diversity for the Atlantic ESU as for other marine mammals (González-Suárez et al., 2009; Quéroil et al., 2007), as found for the Brazilian sample by Oliveira et al. (2009) for seven microsatellite loci. Besides, no evidence of recent genetic bottleneck was found in our more comprehensive study of the Atlantic ESU, in accordance with Oliveira et al. (2009). These suggest that although its history shows a strong exploitation suffered in recent centuries and only recently being banned, hunting does not seem to have significantly affected this population genetic diversity.
The large distribution of the Atlantic ESU does not seem to prevent a high gene flow between some populations in the area. According to microsatellite data, the FST and RST indices and the Bayesian analysis performed by Structure indicated
high levels of gene flow between all populations sampled with no suggestion of an expressive geographic structure. Wright (1969) estimated that a single migrant per generation would be sufficient to prevent the complete differentiation. Recent studies suggest that this number should vary from 5 to more than 10 migrants to compensate population size fluctuations (Lacy 1987; Mills & Allendorf, 1996; Vucetich & Waite,
-3100 -3000 -2900 -2800 -2700 -2600 -2500
1 2 3 4 5 6 7 8
2000). In this study, when the existence of two populations is considered, the migration rate for the bi-parental markers is sufficiently high (mean of 19.37 migrants per generation) to maintain the genetic equilibrium among the populations.
Considering mtDNA results, the migration analysis performed in Lamarc had also found high levels of gene flow among all populations in agreement with microsatellite results. However, pairwise FST and ΦST values evidenced same level of
structure between some pairs of populations. Significant and relatively high levels of these differentiation indexes were found between Mar del Plata vs Southern Chubut and Uruguay vs Northern Chubut populations. A possible explanation for the conflicting signals between the matrilineal mtDNA and the bi-parental microsatellites is the strong female philopatry in the species (Burg et al. 1999; Hoffman et al. 2006). This difference in gene flow estimates between mtDNA and microsatellite data is found in several species and indicates a dispersal pattern and migration mediated by males (Petit & Mayer 1999; Ruedi & Castella 2003; Weyandt et al. 2005). However, we cannot discard that some bias could have occurred due to sampling size difference among some localities and there are important colonies not studied here. Future research should explore the Argentinean colonies that were not sampled in this work like Ushuaia, Falkland Islands and Estados Island (54° 49' S, 64° 29' W) and the southern coast of Chile in order to test if the results of this study is valid to its entire distribution.
The TMRCA indicated that much of the current genetic diversity of the Atlantic ESU emerged relatively recent, around 200 kya, and both the tree and the haplotype network showed a suggestive pattern of past population expansion in the history of this population. Past population expansion is corroborated by results of the neutrality indices for mtDNA data and the growth rate estimated by Lamarc for both mitochondrial and microsatellite data. According the Bayesian Skyline analysis this population expansion started around 200 - 100 kya.
and that actual maternal gene flow between these colonies is much reduced. This recent isolation might be mainly due to an increment in the geographic distance between new populations in new colonized areas, affecting mainly the genetic structure of the females which exhibit lower dispersion rates and higher rates of philopatry. This extensive ancient haplotype sharing may also explain the weak signals of geographic structure detected in our results based on mtDNA data in spite of this well known philopatry.
Conservation implications
Based on the results described above and taking in consideration the prohibition of hunting along all the distribution of the species and the El Niño events, it is possible to conclude that this population has great viability, because its high genetic variability provided adaptation to these strong selective pressures. The maintenance of this genetic diversity and habitat protection must be the focus of conservation efforts.
This work shows that the Atlantic ESU of South American fur seal maintain high gene flow by males along all its distribution, has high genetic diversity and large population size, and then, it is a single population in the Atlantic. However, the genetic corroboration that the females are highly philopatric means that any breeding colony that goes extinct is unlikely to be naturally recovered since males alone could not establish new breeding colonies. At the same time, the conservation measures for this population as a whole should be aligned among the countries of the distribution regardless of cultural, political and geopolitical borders differences, since any regional threat can impact the population as a whole.
populations; and the correct strategy planning for captive breeding (O‟brien & Mayr,
1991).
References
Alter SE, Rynes E, Palumbi SR (2007) DNA evidence for historic population size and past ecosystem impacts of gray whales. PNAS. Vol. 104. No.38.
Allen PJ, Amos W, Pomeroy PP, Twiss SD (1995) Microsatellite variation in grey seals (Halichoerus grypus) shows evidence of genetic differentiation between 2 British breeding colonies. Molecular Ecology, 4, 653–662.
Amos W and Hoelzel AR (1991) Long-term preservation of whale skin for DNA analysis, p. 99-103. In: A.R. Hoelzel (Ed.). Genetic ecology of whales and dolphins. International Whaling Commission (special issue 13), Cambrige, 311p.
Avise JC (1987) Identification and interpretation of mitochondrial DNA stocks in marine species. In: H. Kumpf & E. L. Nakamura (Eds.). Proceedings of Stock Identification Workshop. Publ. National Oceanographic and Atmospheric Administration, Panama, Fl.
Avise JC (1994) Molecular Markers, Natural History and Evolution. New York: Chapman & Hall pp. 511.
Bandelt HJ, Forster P, Röhl A (1999) Median-joining networks for inferring intraspecific phylogenies. Molecular Biology and Evolution, 16, 37–48.
Bastida R, Rodríguez D, Secchi E, da Silva V (2007) Mamiferos Acuáticos de Sudamérica y Antartida. Vazquez Mazzini Editores, Argentina.
Bonavia D (1982) Los gavilánes (préceramico peruano), mar; desierto y oasis en la historia del hombre. Lima: Editorial Ausonia. In: South American fur seal, Arctocephalus australis, in Peru. Majluf, P. 1987. In: Status, Biology, and
Boness DJ (1991) Determinants of mating systems in the Otariidae (Pinnipedia). Pages 1-44 in Renouf, D. (Ed) The behaviour of pinnipeds. Chapman and Hall, London, United Kingdom.
Boutin-Ganache I, Raposo M, Raymond M, Deschepper CF (2001) M13-Tailed primers improve the readability and usability of microsatellite analyses performed with two different allele sizing methods. BioTechniques 31, 26-28.
Brunner S (2002) Cranial morphometrics of fur seals and sea lions (Family: Otariidae) - systematics, geographic variation and growth. Ph. Doctor thesis, University of Sidney, xv + 254p.
Cappozzo HL, Perez F, Batalles LM (1996) Reproductive behavior of South American fur seals in Uruguay. Paper presented at the International Symposium and workshop on Otariid reproductive strategies and conservation, Smithsonian Institution, Washington, 12-16 April 1996, p37.
Coltman DW, Bowen WD, Wright JM (1996) PCR primers for harbour seal (Phoca vitulina concolour) microsatellites amplify polymorphic loci in other species. Molecular Ecology,5, 161–163.
Cornuet J.M. and Luikart G. (1996) Description and power analysis of two tests for detecting recent population bottlenecks from allele frequency data. Genetics 144, 2001-2014.
Dassis M, Farenga M, Rodríguez D (2007) Utilizacion del habitat costero de Mar Del Plata por lobos marinos de dos pelos (Arctocephalus australis) : su analisis a partir de um sistema de informacion geográfica. XII Congresso Latino-Americano de Ciências do Mar.
Drummond AJ & Rambaut A (2007) "BEAST: Bayesian evolutionary analysis by sampling trees." BMC Evolutionary Biology 7, 214
Excoffier L, Laval G, Schneider S (2005) Arlequin ver. 3.0: An integrated software package for population genetics data analysis. Evolutionary Bioinformatics Online, 1, 47-50.
Fabiani A, Hoelzel AR, Galimberti F, Muelbert MMC (2003) Long-range paternal gene flow in 64 southern elephant seals. Science, 299, 676.
Ferguson SH and Higdon JW (2006) How seals divide up the world: environment, life history, and conservation. Oecologia, 150, 318-329.
Fu XY (1997) Statistical tests of neutrality of mutations against population growth, hitchhiking and background selection. Genetics 147,915–925.
Garnier-Gere P and Dillmann C (1992) A computer program for testing pairwise linkage disequilibria in subdivided populations. J. Hered. 83 (3): 239.
Gemmel NJ, Allen PJ, Goodman SJ, Reed JZ (1997) Interspecific microsatellite markers for the study of pinniped populations. Molecular Ecology, 6, 661–666.
Gliesh R (1925) A fauna de Torres. Revista de Engenharia de Porto Alegre (EGATEA), Porto Alegre, 10(5): 253-354.
González-Suárez M, Flatz R, Aurioles-Gamboa D, Hedrick PW, Gerber LR (2009) Isolation by distance among California sea Lion populations in Mexico: redefining management stocks. Molecular Ecology, 18, 1088-1099.
Gordon D, Abajian C, Green P (1998) Consed: a graphical tool for sequence finishing. Genome Research, 8, 195-202.
Guerra CG and Portflitt GK (1991) El Niño on pinnipeds in Northern Chile. In Trillmich F and Ono KA (eds) Pinniped and El Niño, responses to environmental stress. Springer-Verlag Press, Berlin, pp 47-54.
Hall TA (1999) BioEdit: a user-friendly biological sequence alignment editor and analysis program for Windows 95/98/NT. Nucleic Acids Symposium Series.
Hoffman JI, Matson CW, Amos W, Loughlin TR, Bickham JW (2006) Deep genetic subdivision within a continuously distributed and highly vagile matine mammal,
the Steller‟s sea lion (Eumetopias jubatus). Mol Ecol, 15, 2821-2832.
Hoffman JI, Steinfartz S, Wolf JBW (2007) Ten novel dinucleotide microsatellite loci cloned from the Galápagos sea lion (Zalophus californianus wollebaeki) are polymorphic in other pinniped species. Molecular Ecology Notes, 7, 103-105.
Hongyan X, Chakraborty R and Fu Yun-Xin (2005) Mutation rate variation at human dinucleotide microsatellites. Genetics, 170, 305-312.
Kingman JFC (1982a). On the genealogy of large populations. pp. 27-43 in Essays in Statistical Science, ed. J. Gani and E. J. Hannan. Applied Probability Trust, London. (Also as Journal of Applied Probability 19A: 27-43.)
Kingman JFC (1982b) The coalescent. Stochastic Processes and Their Applications
13: 235-248.
Kocher TD, Thomas WK, Meyer A, Edwards SV, Paabo S, Villablanca FX, Wilson AC (1989) Dynamics of mitochondrial DNA evolution in animals: Amplification and sequencing with conserved primers. Proceedings of the National Academy Science, 86, 6196-6200.
Kuhner MK (2006) LAMARC 2.0: maximum likelihood and Bayesian estimation of population parameters. Bioinformatics, 22, 768-770.
Lacy RC (1987) Loss of genetic diversity from managed populations: interacting effecta of drifit, mutation, immigration, selection and population subdivision. Conservation Biology, 1, 143-158.
Lima M, Páez E (1995) Growth and reproductive patterns in the South American fur seal. J Mamm, 76, 1249-1255.
Majluf P, Trillmich F (1981) Distribution and abundance of sea lions (Otaria byronia) and fur seal (Arctocephalus australis) in Peru. Z.f.Säugetierkunde, 46, 384-393.
Majluf P (1987a) Reproductive ecology of female South American fur seals at Punta San Juan. Ph.D. thesis M-22, University of Cambridge, 127p.
Majluf P (1987b) South American fur seal, Arctocephalus australis, in Peru. In: Croxall, JP and Gentry R L (eds), Status, Biology and Ecology of Fur Seals, Proceedings of an International Symposium and Workshop. Cambridge, United Kingdom, 23-27 April 1984, pp: 23-27.
Majluf P (1992) Timing of births and juvenile mortality in the South American fur seal in Peru. J Zool Lond, 227, 367-383.
Majluf P, Riveros JC and Parlane S (1996) Cool spots as “hot spots”: the evolution of
lekking in the South American fur seal. In Croxall JP and Gentry RL (eds) International Symposium and workshop on Otariid reproductive strategies and conservation. Washington, EUA. p.26. 12-16 April 1996.
Meyer A, Kocher TD, Basasiwaki P, Wilson AC (1990) Monophyletic origin of Lake Victoria cichlid fishes suggested by mitochondrial DNA sequences. Nature,
347, 550-553.
Mills LS and Allendorf FW (1996) The one-migrant-per-generation rule in conservation and management. Conservation Biology, 6,1509-1518.
O‟brien SJ and Mayr E (1991) Bureaucratic mischief: recognizing endangered species and subspecies: Science, 251, 1187-1188.
Oliveira LR (1999) Caracterização dos padrões de ocorrência dos pinídepes (Carnivora: Pinnipedia) ocorrentes no Litoral do Rio Grande do Sul, Brasil, entre 1993 e 1999. Dissertação de Mestrado em Biociências (Zoologia). Pontifícia Universidade Católica do Rio Grande do Sul, PUCRS, Porto Alegre, Brasil.xi+154pp.
Oliveira LR, Hingst-Zaher E and Morgante JS (2005) Size and shape sexual dimorphism in the skull of the South American fur seal, Arctocephalus australis (Zimmermann, 1783) Carnivora: Otariidae. LAJAM 4: 27-40.
Oliveira LR, Arias-Schreiber M, Meyer D and Morgante JS (2006) Effective population size in a bottlenecked fur seal population. Biol Cons, 131, 505-509.
Oliveira LR, Hoffman JI, Hingst-Zaher E, Majluf P, Muelbert MMC, Morgante JS, Amos W (2008) Morphological and genetic evidence for two evolutionarily significant units (ESUS) in the South American fur seal, Arctocephalus australis. Conservation Genetics, 9, 1451-1466.
Oliveira LR, Meyer D, Hoffman J, Majluf P, Morgante JS (2009) Evidence of a genetic bottleneck in an El Niño affected population of South American fur seals, Arctocephalus australis. Journal of the Marine Biological Association of the United Kingdom 1-9.
Orr RT, Schonewald J and Kenyon KW (1970) The California sea lion: skull growth and a comparision of two populations. Proceedings of the California Academy of Sciences, 37(11), 381-94.
Petit E, Mayer F (1999) Male dispersal in the noctule bat (Nyctalus noctula): where are the limits? Proceedings of the Royal Society of London Series B-Biological Sciences, 266, 1717–1722.
Pinedo MC, Rosas FCW, Marmontel M (1992) Cetáceos e Pinipedes do Brasil. Uma revisão dos registros e guia de identificação das espécies. United Nations Environment Programme (UNEP)/FUA, Manaus, 213p. il.
Pritchard JK, Stephens M, Donnely P (2000) Inference of a population structure using multilocus genotype data. Genetics, 155, 945-959.
Quéroiul S, Silva MA, Freitas L, Prieto R, Magalhães S, Dinis A, Alves F, Matos JA, Mendonça D, Hammond OS, Santos, RS (2007) High gene flow in oceanic bottlenose dolphins (Tursiops truncatus) of the North Atlantic. Conserv Genet,
Raymond M and Rousset F (1995) Genepop (version 1.2): Population genetics software for exact tests and ecumenicism. J Her, 86, 248 –249.
Riedman ML (1990) The Pinnipeds. Seals, sea lions and walruses. Berkeley, California: University of California Press.
Rosas FCW, Pinedo MC, Marmontel M, Haimovici M (1994) Seasonal movements of the South American sea lion (Otaria flavescens, Shaw) off the Rio Grande do Sul coast, Brazil, Mammalia, 58: 51-59.
Ruedi M, Castella V (2003) Genetic consequences of the ice ages on nurseries of the bat Myotis myotis: a mitochondrial and nuclear survey. Molecular Ecology,
12, 1527-1540.
Sambrook J, Russell DW (2001) Molecular Cloning. Cold Spring Harbor Laboratory Press, New York.
Schiavini ACM (1987) Una aproximación a la predación de los aborígenes prehistóricos del Canal de Beagle sobre los pinípedos. Anais da 2ª. Reunião de Trabalho de Especialistas em Mamíferos Aquáticos da América do Sul, 81-82. Rio de Janeiro, Brasil.
Schlötterer C, Amos B, Tautz D (1991) Conservation of polymorphic simple sequence loci in cetacean species. Nature, 354, 63-65.
Schlötterer C (2004) The evolution of molecular markers – just a matter of fashion? Nature, London, 5, 63-69.
Schramm Y, Mesnick SL, Rosa J de La, Palacios DM, Lowry MS, Aurioles-Gamboa D, Snell HM, Escorza-Treviño S (2009) Phylogeography of California and Galápagos sea lions and population structure within the California sea Lion. Mar Biol, 156, 1375-1387.
Simões-Lopes PC, Drehmer CJ, Ott PH (1995) Nota sobre os Otariidae e Phocidae (Mammalia: Carnivora) da costa norte do Rio Grande do Sul e Santa Catarina, Brasil. Biociências, 3, 173-181.
Tamura K and Nei M (1993) Estimation of the number of nucleotide substitutions in the control region of mitochondrial DNA in humans and chimpanzees. Mol. Biol. Evol. 10, 512-526.
Tchaika L, Eizirik E, Oliveira TG, Cândido JF, Freitas TRO (2007) Phylogeography and population history of the crab-eating fox (Cerdocyon thous). Molecular Ecology, 16, 819– 838.
Thompson JD, Gibson TJ, Plewniak F, Jeanmougin F (1997) The clustal windows interface: flexible strategies for multiple sequence alignment aided by quality analysis tools. Nucleic Acids Research, 25, 4876–4882.
Túnez JI, Centrón D, Cappozzo HL, Cassini MH (2007) Geographic distribution and diversity of mitochondrial DNA haplotypes in South American sea lions (Otaria flavescens) and fur seals (Arctocephalus australis). Mamm Biol, 72,193–203.
Van Oosterhout C, Hutchinson WF, Wills DPM, Shipley P (2004) MICRO-CHECKER: software for identifying and correcting genotyping erros in microsatelite data. Mol. Ecol.Notes, 4, 535-538.
Vaz-Ferreira R (1981) South American sea lion, Otaria flavescens (Shaw,1800). pp.
39-66. In: S.H. Ridgway & R.J. Harrison (Eds.). Handbook of Marine Mammals, Academic Press, vol.1, London, 235p.
Vaz-Ferreira R (1982) Arctocephalus australis Zimmerman, South American fur seal.
Mammals in the seas, FAO Fisheries series, Small cetaceans, seals, sirenians and otters, 4, 497-508.
Vucetich JA, Waite TA (2000) Is one migrant per generation sufficient for the genetic management of fluctuating populations? Animal Conservation, 3, 261-266.
Weir BS and Cockerham CC (1984) Estimating F-statistics for the analysis of population structure, Evolution, 38, 1358-1370.
Wright (1969) Evolution and the Genetics of Populations, vol. 2. A scholarly treatment of the genetics of population fragmentation, including F statistics , wich the author devised. Relatively advanced.
Wynen LP, Goldsworthy SD, Guinet C (2000) Postsealing genetic variation and population structure of two species of fur seal (Arctocephalus gazella and A. tropicalis). Molecular Ecology, 9, 299–314.
Wynen LP, Goldsworthy SD, Insley SJ, Adams M, Bickham JW, Francis J, Gallo JP, Hoelzel AR, Majluf P, White RWG, Slade R (2001) Phylogenetic Relationships within the Eared Seals (Otariidae: Carnivora): Implications for the Historical Biogeography of the Family. Mol Phyl Evol, 21, 270–284.
Ximenez IM and Langguth E (2002) Isla de Lobos. Graphis ed., 227pp.
Supplementary Material
Table S1. Samples analyzed.
Locality (site) Samples Institution/contact
46° 00´S; 64° 00´W (Chubut
Province) Aa05* Laboratório de Mamíferos Marinos, Centro Nacional Patagónico (CONICET) e Universidad Nacional de la Patagonia - Enrique Alberto Crespo Muelle Alte. Storni, Pto. Madryn
(Província do Chubut) Aa25* Laboratório de Mamíferos Marinos, Centro Nacional Patagónico (CONICET) e Universidad Nacional de la Patagonia - Enrique Alberto Crespo Islote Moreno (Chubut Province) Aa29*, Aa125* Laboratório de Mamíferos Marinos,
Centro Nacional Patagónico
(CONICET) e Universidad Nacional de la Patagonia - Enrique Alberto Crespo Rawson (Chubut Province) Aa34* Laboratório de Mamíferos Marinos,
Centro Nacional Patagónico
(CONICET) e Universidad Nacional de la Patagonia - Enrique Alberto Crespo P. Delgada (Chubut Province) Aa38* Laboratório de Mamíferos Marinos,
Centro Nacional Patagónico
(CONICET) e Universidad Nacional de la Patagonia - Enrique Alberto Crespo Playa El Doradillo (Chubut
Province) Aa47* Laboratório de Mamíferos Marinos, Centro Nacional Patagónico (CONICET) e Universidad Nacional de La Patagonia - Enrique Alberto Crespo Las Grutas (Chubut Province) Aa130* Laboratório de Mamíferos Marinos,
Centro Nacional Patagónico
(CONICET) e Universidad Nacional de La Patagonia - Enrique Alberto Crespo Isla Rasa (Chubut Province) Aa101*, Aa102*, Aa106*†,
Aa107*†, Aa108*†,
Aa109*†, Aa117*†, Aa118*,
Laboratório de Mamíferos Marinos, Centro Nacional Patagónico
Aa124*, Aa160*†, Aa170*†, Aa181*†, Aa183*†,
Aa188*†, Aa189*†,
Aa190†, Aa191*†, Aa192†, Aa193*†, Aa194*, Aa195*†, Aa197*†, Aa199*†,
Aa200*†, Aa2101*†, Aa2106*†, Aa2107*†, Aa1_22*, Aa2_22*†, Aa3_22*†, Aa5_22*, Aa6_22†, Aa7_22*†, Aa9_22†, Aa10_22*†, Aa11_22*†, Aa12_22*†, Aa13_22*†, Aa14_22*†, Aa15_22*†, Aa16_22*†, Aa17_22*†, Aa18_22*†, Aa19_22*†, Aa20_22*†, Aa21_22*†, Aa22_22*†, Aa23_22†*, cria1†, cria2†
la Patagonia - Enrique Alberto Crespo
Isla Arce (Chubut Province) Aa103*, Aa104*†, Aa105* Laboratório de Mamíferos Marinos, Centro Nacional Patagónico
(CONICET) e Universidad Nacional de la Patagonia - Enrique Alberto Crespo North Argentina (Mar del Plata) 24-99*, 86-00*,
AF01-2001*, BV*†, 71-00*†, 78 -00*†, 85-00*, 87-00*, 110-00*, 69-00†
Departamento de Ciencias Marinas, Facultad de Ciencias Exactas y Naturales, Universidad de Mar del Plata - Diego Rodríguez
Uruguay (Cabo Polonio) CP1*†, CP2*, CP3* Sección Zoología Vertebrados, Facultad de Ciencias - Diana Szteren Uruguay (Isla de Lobos) 1uy†, 2uy*†, 3uy†, 4uy*†,
5uy*† Proyecto Pinnípedos Cetáceos Uruguay, Facultad de Ciencias, Uruguay - Valentina Franco Trecu Brazil (Rio Grande do Sul) 556*, 586*, 591*, 656*†,
657*†, 660*, 662*†, 664*, 665†, 668*, 671*, 676*†, 683*, 687*, 689*, 691*†, 692†, 693†, 694*, 696*, 705*, 708*, 712*†, 714*, 722*, 728*, 729*, 730*†, 731†, 959†, Parna*
Grupo de Estudos de Mamíferos Aquáticos do Rio Grande do Sul - Larissa Rosa de Oliveira
CONCLUSÃO
Os resultados do presente trabalho mostram que a UES do Atlântico é uma única população genética, com grande distribuição e alto fluxo gênico de machos entre as diversas colônias. A rede de haplótipos mostra um compartilhamento antigo de haplótipos, além de indicar um sinal de expansão. Os índices de fixação apontaram uma provável estruturação entre as colônias do Uruguai e do Chubut em relação ao DNA mitocondrial. Já os dados de microssatélite não mostraram essa tendência. O comportamento filopátrico por parte das fêmeas já foi identificado como uma característica da espécie, sendo os machos, então, os mediadores do fluxo gênico.
Uma forte ameaça sofrida por esta espécie foi a caça, que apenas em 1990 foi proibida no Uruguai. Esta exploração vem acontecendo há cerca de 6.000 anos, primeiros pelos aborígenes, depois fortemente pela caça comercial. Apesar disso, nenhum sinal de gargalo genético foi detectado a partir dos dados. Os eventos de El Niño recentes também parecem não ter influenciado na diversidade genética da espécie. Tanto os dados do DNA mitocondrial quanto os de microssatélite apontaram expansão populacional que começou entre 200.000 e 100.000 anos atrás.
REFERÊNCIAS BIBLIOGRÁFICAS
Avise JC (1994) Molecular Markers, Natural History and Evolution. New York: Chapman & Hall pp. 511.
Boness DJ (1991) Determinants of mating systems in the Otariidae (Pinnipedia). Pages 1-44 in Renouf, D. (Ed) The behaviour of pinnipeds. Chapman and Hall, London, United Kingdom.
Brunner S (2002) Cranial morphometrics of fur seals and sea lions (Family: Otariidae) - systematics, geographic variation and growth. Ph. Doctor thesis, University of Sidney, xv + 254p.
Cappozzo HL, Perez F, Batalles LM (1996) Reproductive behavior of South American fur seals in Uruguay. Paper presented at the International Symposium and workshop on Otariid reproductive strategies and conservation, Smithsonian Institution, Washington, 12-16 April 1996, p37.
Dassis M, Farenga M, Rodríguez D (2007) Utilizacion del habitat costero de Mar Del Plata por lobos marinos de dos pelos (Arctocephalus australis) : su analisis a partir de um sistema de informacion geográfica. XII Congresso Latino-Americano de Ciências do Mar.
Guerra CG and Portflitt GK (1991) El Niño on pinnipeds in Northern Chile. In Trillmich F and Ono KA (eds) Pinniped and El Niño, responses to environmental stress. Springer-Verlag Press, Berlin, pp 47-54.
Lima M, Páez E (1995) Growth and reproductive patterns in the South American fur seal. J Mamm, 76, 1249-1255.
Majluf P (1992) Timing of births and juvenile mortality in the South American fur seal in Peru. J Zool Lond, 227, 367-383.
Majluf P, Riveros JC and Parlane S (1996) Cool spots as “hot spots”: the evolution of
Moritz C (1994) Defining evolutionary significant units for conservation. TREE 9 ,373-375.
Oliveira LR (1999) Caracterização dos padrões de ocorrência dos pinídepes (Carnivora: Pinnipedia) ocorrentes no Litoral do Rio Grande do Sul, Brasil, entre 1993 e 1999. Dissertação de Mestrado em Biociências (Zoologia). Pontifícia Universidade Católica do Rio Grande do Sul, PUCRS, Porto Alegre, Brasil.xi+154pp.
Oliveira LR, Arias-Schreiber M, Meyer D and Morgante JS (2006) Effective population size in a bottlenecked fur seal population. Biol Cons, 131, 505-509.
Oliveira LR, Hoffman JI, Hingst-Zaher E, Majluf P, Muelbert MMC, Morgante JS, Amos W (2008) Morphological and genetic evidence for two evolutionarily significant units (ESUS) in the South American fur seal, Arctocephalus australis. Conservation Genetics, 9, 1451-1466.
Orr RT, Schonewald J, Kenyon KW (1970) The California sea lion: skull growth and a comparision of two populations. Proceedings of the California Academy of Sciences, 37(11), 381-94.
Pinedo MC, Rosas FCW, Marmontel M (1992) Cetáceos e Pinipedes do Brasil. Uma revisão dos registros e guia de identificação das espécies. United Nations Environment Programme (UNEP)/FUA, Manaus, 213p. il.
Ryder OA (1986) Species conservation and systematics: the dilemma of subspecies. TREE 1, 9-10.
Schlötterer C (2004) The evolution of molecular markers – just a matter of fashion? Nature, London, 5, 63-69, 2004.
Simões-Lopes PC, Drehmer CJ, Ott PH (1995) Nota sobre os Otariidae e Phocidae (Mammalia:Carnivora) da costa norte do Rio Grande do Sul e Santa Catarina, Brasil. Biociências, 3,173-181.
Wynen LP, Goldsworthy SD, Insley SJ, Adams M, Bickham J.W, Francis J, Gallo JP, Hoelzel AR, Majluf P, White RWG, Slade R (2001) Phylogenetic Relationships within the Eared Seals (Otariidae: Carnivora): Implications for the Historical Biogeography of the Family. Mol Phyl Evol, 21, 270–284.
Vaz-Ferreira R (1982) Arctocephalus australis Zimmerman, South American fur seal. Mammals in the seas, FAO Fisheries series, Small cetaceans, seals, sirenians