Genetic structure and gene flow of
Eugenia dysenterica
natural populations
Maria Imaculada Zucchi(1), José Baldin Pinheiro(2), Lázaro José Chaves(3), Alexandre Siqueira Guedes Coelho(4), Mansuêmia Alves Couto(3), Lizz Kezzy de Morais(1) and Roland Vencovsky(2)
(1)Instituto Agronômico, Av. Theodureto Almeida Camargo 1500, CEP 13001-970 Campinas, SP, Brazil. E-mail: mizucchi@iac.sp.gov.br,
lizz@iac.sp.gov.br (2)Escola Superior de Agricultura Luiz de Queiroz, Dep. de Genética, Av. Pádua Dias 11, CEP 13400-970 Piracicaba, SP,
Brazil. E-mail: baldin@esalq.usp.br, rvencovs@esalq.usp.br (3)Universidade Federal de Goiás (UFG), Escola de Agronomia, Caixa Postal 131,
CEP 74001-970 Goiânia, GO, Brazil. E-mail: lchaves@agro.ufg.br (4)UFG, Inst. de Ciências Biológicas. E-mail: acoelho@icb.ufg.br
Abstract – This study was carried out to assess the genetic variability of ten “cagaita” tree (Eugenia dysenterica) populations in Southeastern Goiás. Fifty-four randomly amplified polymorphic DNA (RAPD) loci were used to characterize the population genetic variability, using the analysis of molecular variance (AMOVA). A φST value of 0.2703 was obtained, showing that 27.03% and 72.97% of the genetic variability is present among and within populations, respectively. The Pearson correlation coefficient (r) among the genetic distances matrix (1 – Jaccard similarity index) and the geographic distances were estimated, and a strong positive correlation was detected. Results suggest that these populations are differentiating through a stochastic process, with restricted and geographic distribution dependent gene flow.
Index terms: Myrtaceae, Cerrado, tropical species, genetic diversity.
Estrutura genética e fluxo gênico em populações naturais de cagaita
Resumo – Este trabalho teve por objetivo o estudo da variabilidade genética em 10 populações de cagaiteiras (Eugenia dysenterica), da região Sudeste do Estado de Goiás. Foram identificados 54 locos marcadores RAPD, para a caracterização da variabilidade genética, avaliada por meio da análise da variância molecular (AMOVA). Foi verificado que 27,03% da variabilidade genética está entre populações, e 72,97% dentro de populações, índices obtidos a partir do valor de φST igual a 0,2703. Foi estimado o coeficiente de correlação de Pearson (r) entre a matriz de distâncias genéticas (1 – índice de similaridade de Jaccard) e de distâncias geográficas, tendo sido encontrada forte correlação positiva. Os resultados sugerem que essas populações estão se diferenciando por um processo estocástico havendo fluxo restrito dependente da distribuição geográfica.
Termos para indexação: Myrtaceae, Cerrado, espécies tropicais, diversidade genética, Eugenia dysenterica.
Introduction
The “cagaita”, Eugenia dysenterica DC, is a small fruit tree native to the Cerrado region, with potential for agriculture exploitation due to the large social and economic qualities of its subproducts. In addition to being an ornamental and honey bearing species, its wood, leaves and fruits are used in house building, in diabetes treatment and as laxative, respectively, and also antifungal and antimicrobial activities have been reported because of its essential leaf oils (Costa et al., 2000).
The fruit species native to the Cerrado belongs to different genera and families. Although there is a potential and growing market for fruits of regional interest, “cagaita” has been little farming exploited, fruits being utilized only in an extractive and predatory manner (Telles, 2000).
Genetic studies of native species involve knowledge on the diversity, gene flow and other genetic parameters of populations. Molecular markers have been frequently used in studies on genetic diversity and structure of population. Literature reports describe the use of this technique in conservation studies of Cerrado species, as those by Collevatti et al. (2001) and Zucchi et al. (2002, 2003). Among the various types of currently available markers, RAPD are important because they are simple, can be applied to many species, and allow analysis of many loci. Main disadvantage of using this marker is its dominant nature.
RAPD markers were used in three populations of Eugenia dysenterica of Northeastern Goiás by Trin-dade (2001); a value of φST = 0.086 was obtained,
populations and 91.4% within the populations. Similarly “cagaita” populations from Southeastern Goiás studied by Telles (2000), using isozymes, had θp = 0.156, and a
variation among populations of 15.6%.
The aim of this work was to characterize Eugenia dysenterica populations in studies of genetic variability, population structure and gene flow, using RAPD markers.
Material and Methods
Ten population areas with Eugenia dysenterica in Southeastern Goiás were sampled. Part of samples were obtained from six plants from population area 7, and part from 12 plants of other population areas (Table 1). These areas were selected, after prospecting expeditions carried out in August and September 1996. Populations 1 to 8 were sampled in October 1996, and populations 9 and 10 in November 1999.
The samples consisted of young leaves which were placed on ice, and later stored in a freezer at -20oC, until
DNA extraction for analysis.
Shortest distance among the sampled populations was 13.12 km between populations 1 and 3, and the farthest distance was 234.72 km between populations 4 and 9. A total of 114 plants was sampled in ten populations.
The DNA was extracted by the CTAB (cetyltrime thylammonium bromide) method described by Murray & Thompson (1980) and Rogers & Bendich (1985).
The quantification was performed in 0.8% (w/v) agarose gels submitted to electrophoresis. Aliquots of each DNA were placed in the gel wells with a series of known DNA concentrations of the λ phage (20 to 400 ng). The sample concentration was estimated visually, comparing the fluorescent intensity of the DNA λ phage bands. The gels were visualized after staining with
10 µL ethidium bromide (10 mg nL-1), diluted in 100 mL
TEB 1X buffer.
After quantifying the DNA, amplification reactions were performed in a MJ thermocycler model PTC 100, at a volume of 25 µL, containing: 10 mM Tris-HCl, pH 8.3; 50 mM KCl; 2.0 mM MgCl2; 0.2 mM dNTPs;
0.25 µM primer (Operon Technologies), 5 ng DNA pattern, 1 unit Taq polymerase and H2O. Reactions were
submitted to 48 amplification cycles, after initial denaturation at 94°C for 5 min. Each cycle consisted of 30 sec at 92°C, 1 min and 30 sec at 37°C, and 1 min and 30 sec at 72°C. At the end of 48 cycles, there was a final extension of 5 min at 72°C.
The amplification products were submitted to electrophoresis (3 V cm-1) in 1.4% agarose gels (w/v),
using the run TEB 1X buffer. The 100 bp ladder was used as molecular weight marker. The gels were stained with ethidium bromide and photographed under UV light. Eighty primers from the A, C, G and H Operon Technologies series were tested. Four plants were used to ascertain the amplification profile of each primer.
A binary matrix was constructed from the gel readings, where the individuals were genotypically characterized for presence (1) and absence (0) of bands. The percentage of polymorphism obtained with each primer was calculated from this matrix.
The analysis of variance of the molecular data (AMOVA) was performed by partitioning the total variation of the among and within population components, using the squared distances as described by Excoffier et al. (1992), and the Arlequim program (Schneider et al., 2000). The significance of variation sources was obtained by the bootstrap method using 1,000 resamplings.
An approximate mean number of migrants per generation (Nm) was calculated through the expression: Nm = 0.25(1/FST -1) (Wright, 1951), in which FST was
substituted by its analog φST (Lacerda et al., 2001), which
means the proportion of molecular variability among populations.In this expression, N is the populational size, and m is the proportion of migrants per generation.
The binary data matrix was used to calculate the Jaccard similarity coefficient among all individuals, given by: Sij = a/(a + b + c), in which a is the number of
cases, where a band occurs simultaneously in both individuals; b is the number of cases, when a band occurs only in the ith individual; c is the number of cases, where the band occurs in the jth individual.
The similarity among pairs of populations was estimated by the mean of the similarity index among
Areas County Number of
sampled trees Altitude
(m)
Latitude Longitude
1 Catalão 12 880 18 07 35 S' " 47 54 20 W' "
2 Catalão 12 860 18 02 0,3 S' " 48 02 31 W' "
3 Catalão 12 800 18 13 39 S' " 47 58 12 W' "
4 Três Ranchos 12 820 18 17 15 S' " 47 48 41 W' "
5 Campo Alegre de Goiás 12 930 17 39 11 S' " 47 46 37 W' " 6 Campo Alegre de Goiás 12 780 17 34 24 S' " 47 42 12 W' "
7 Cristalina 6 890 17 10 47 S' " 47 31 07 W' "
8 Luziânia 12 900 16 28 48 S' " 47 48 40 W' "
9 Goiânia 12 740 16 40 30 S' " 49 14 42 W' "
10 Senador Canedo 12 840 16 37 13 S' " 49 04 29 W' "
pairs of individuals of the analyzed population. Dendrograms were constructed from these similarity indexes among populations, following the methodology described by Sneath & Sokal (1973). The stability of the clusters was also tested by a resampling procedure with 10,000 bootstraps, using the BoodP program (Coelho, 2002).
To analyze the patterns of spatial variation, the Pearson correlation coefficient (r) was estimated, between the genetic distance matrixes, calculated from the Jaccard similarity index (1– Jaccard similarity index) and the geographic distances among populations. The significance of this matrix correlation was tested by the Mantel Z statistic, using 9,999 random permutations with the NTSYS program (Rohlf, 1989).
Results and Discussion
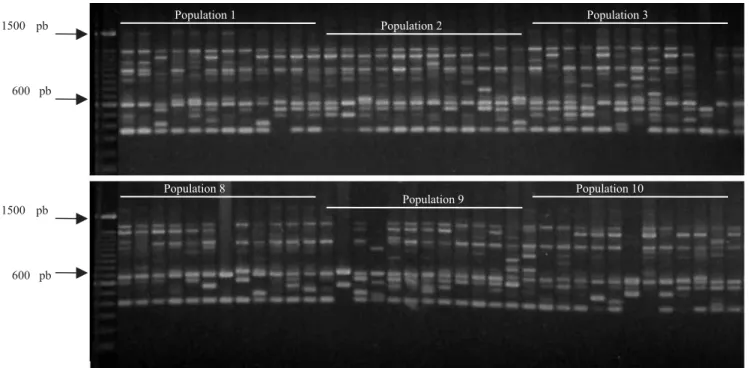
Primers that generated the largest number of polymorphic bands were selected, namely, OPA-01, OPA-02, OPA-03, OPA-11 (Figure 1), OPA-13, OPA-19, OPH-04, OPH-08. Table 2 shows the sequence of selected primers and the polymorphism pattern of each one.
Genetic variability was detected among ten populations using 54 RAPD polymorphic loci (Table 3).
Mean genetic distances obtained from the Jaccard similarity index, calculated among populations, varied from 0.455 to 0.653 (Figure 2). The cophenetic correlation of the UPGMA clustering of this matrix was high (0.915). Clustering analysis indicates similarities between populations 9 and 10. They are located in the extreme West of the sampled region, and form a group different from the other populations. Populations 9 and 10 form another group, which is located in the East side of the sampled area. It is worth mentioning that population 9 and 10 are geographically separated from the other populations by the Corumbá River Basin, and the species does not occur frequently in lower altitude areas, corresponding to the depression formed by the river and its tributaries (Telles, 2000). The other populations (1 to 8) are located along the watershed of the Corumbá and São Marcos river basins. Although a discontinuity among these populations presently exists, it may have been accentuated by recent human action, because this is a large scale agricultural region. The clustering pattern in the dendrogram shows a clinal variation pattern for these populations (Figure 2), whose structuring is in line with data obtained by Telles (2000), who used isoenzymes to assess the same populations.
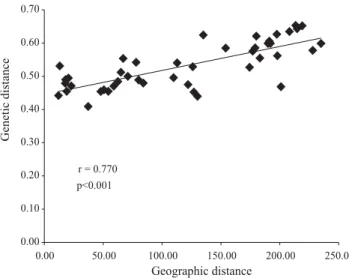
The high value detected for the correlation between geographic and genetic matrices of distances (r = 0.770)
suggests a spatial pattern of genetic variability among populations, that are, therefore, structured in space (Fi-gure 3). It is likely that this structure was derived from a stochastic differentiation process, which included small distance gene flow among populations, associated to drift in the populations.
The greater distance of populations 9 and 10, compared to the others suggests a differentiation over a longer evolutionary period, with great restriction in gene flow due to spatial discontinuity. Similarly, these results were found by Telles (2000).
Knowledge of the genetic variability distribution, among and within natural populations of Eugenia dysenterica, is essential to adopt efficient strategies for germplasm conservation in ex situ and in situ conditions. RAPD markers are widely used in genetic variability studies of natural populations.
Araujo (2001) studied Caryocar brasiliense, a tree species widely distributed in the Cerrado, analyzing 23 populations from the Southeastern and Southwestern Goiás State. A variation among population of φST = 0.260
and GST = 0.304 was detected with 46 loci RAPD
markers, assuming Hardy-Weinberg equilibrium. These RAPD estimated parameters were high, when compared with data obtained by Collevati et al. (2001), who analyzed the same species, and obtained θp = 0.05 using
microsatellite markers. Data obtained in the present study showed a high variability among populations (φST = 0.2703), greater than that obtained with isoenzyme
markers (θp= 0.156) by Telles (2000). These results,
however, are in agreement with pointing to high structuring of the genetic variability of the species in the region.
This comparison should be made with caution, as data obtained with isoenzyme markers, or with any other type of marker, are not directly comparable. This is due to the nature of the marker itself, since enzymes are markers that probably are not neutral, and generally are related to adaptive traits. The RAPD (about 95% of the bands) are noncoding regions of the genome and part of the repetitive DNA, and, therefore, are evolutionarily neutral. Another important fact is related to the genome sampling. RAPD markers are a comparatively simple technique, which allows sampling a much greater number of loci than isoenzyme markers (Zucchi, 2003). It is
Table 3. Results of the analysis of molecular variance (AMOVA), and estimation of apparent gene flow (Nem) based on in φST value, in 10 populations of Eugenia dysenterica
100%
92% 58%
99% 29%
62%
38%
32%
69% 21
3 4 5 6 7 8 9 10
0.36 0.42 0.48 0.54 0.60
Figure 2. Genetic similarity pattern obtained for ten “cagaita” tree populations. UPGMA clustering criteria, based on the Jaccard similarity index.
r = 0.770 p<0.001
0.00 0.10 0.20 0.30 0.40 0.50 0.60 0.70
0.00 50.00 100.00 150.00 200.00 250.00
Geographic distance
Genetic
distance
Figure 3. Correlation between geographic and genetic distances, obtained with RAPD markers: r (correlation) and P values (associated probability, obtained from 9,999 permutations with the Mantel tests).
Primer 5´-3´sequence Number of
loci obtained
Number of polymorphic loci
Polymorphism percentage
OPA-01 CAGGCCCTTC 9 5 55.5
OPA-02 TGCCGAGCTG 6 6 100.0
OPA-03 AGTCAGCCAC 9 5 55.5
OPA-11 CAATCGCCGT 11 11 100.0
OPA-13 CAGCACCCAC 9 3 33.3
OPA-19 CAAACGTCGG 9 5 55.5
OPH-04 GGAAGTCGCC 10 9 90.0
OPH-08 GAAACACCCC 11 10 90.9
Total 74 54 73.0
important to emphasize that dominance is a characteristic of the RAPD technique that can cause bias estimates of homologous parameters (φST versus
FST). This bias does not occur with codominant markers
(as is the case for isoenzymes) (Lynch & Milligan, 1994). In several tropical tree species, the variation within populations is greater than the among populations. Similarly, in Cerrado species φST = 0.086 was found
using RAPD markers in Eugenia dysenterica (Trindade, 2001), and θp = 0.156 was found using isoenzymes
(Telles, 2000). Thus, variation found within population is bigger than among population.
Although Eugenia dysenterica is a species that shows cross pollination (Telles, 2000), the gene flow among the populations is restricted, due to human settlement in the Cerrado region. The restriction to gene flow allied to genetic drift may account for the differentiation among populations (Telles, 2000).
The apparent mean number of migrants per generation, which is an indicator of the gene flow among populations, was 0.675 in this study. This value is considered low (less than 1), and is not in agreement with the data flow estimates obtained by Telles (2000) with isoenzyme markers. According to Slatkin (1985), genetic drift causes population differentiation, if flow value is less than one migrant per generation. As pointed out by Telles et al. (2003), when gene flow is restricted, the population tends to have smaller effective size and greater inbreeding and, as a result, a greater probability of differentiation. A high rate of gene flow homogenizes the genetic differences among populations, even in the presence of intense selection.
Trindade (2001) studied 35 RAPD markers, in three “cagaita” tree populations, in Northeastern Goiás State, and reported a φST = 0.086, much lower than that
detected in the present study. This was due to the geographic proximity among the three populations studied.
Mariot (2000) analyzed the genetic structure of natu-ral Piper cernuum populations, and observed that the genetic differentiation among four Atlantic Forest populations was high (FST = 0.29), with strong spatial
structuring. The author attributed the differentiation to the founding effect of the population as it is a pioneer species that colonizes the forest glades.
Wadt (2001) studied long pepper in settled areas in the State of Acre, and assessed the genetic structure among 13 natural P. hispidinervum populations using 44 RAPD loci, and reported that the variability among
populations was high. Two regions, with two distinct groups representing upper and lower Acre led to
φST = 0.2061.
Buso et al. (1998) studied the genetic structure of wild rice populations, using isoenzymatic and RAPD markers to estimate the diversity level, in four South American wild rice populations (Oryza glumaepatula), collected in the Amazon forest and rivers in Western Brazil. The pattern of the genetic diversity among and within populations was calculated for both types of markers. The authors detected FST = 0.31 with 156 RAPD loci,
and FST = 0.64 with four isoenzymatic loci.
The knowledge of the variation among populations has direct implications for conservation purposes, meaning that a greater number of populations have to be sampled, when the FST is high. If the FST value is
low, a greater number of individuals by population must be sampled.
Conclusions
1. There is a spatial pattern of genetic variability existing among populations of Eugenia dysenterica.
2. These populations are differentiating by an stocastic process, with flow dependent on geographic distribution, compatible with the isolation by distance model.
3. The high φST value reported indicates great
divergence among populations, and restricted gene flow which signifies damage to the metapopulation structure.
References
ARAUJO, T.C.C. Estrutura da variabilidade genética e estrutura populacional de Caryocar brasiliense Camb. no Estado de Goiás utilizando marcadores RAPD. 2001. 129p. Dissertação (Mestrado) - Universidade Federal de Goiás, Goiânia.
BUSO, G.S.; RANGEL, P.H.; FERREIRA, M.E. Analysis of genetic variability of South American wild rice populations (Oryza glumaepatula) with isozymes and RAPD markers. Molecular Ecology, v.7, p.107-117, 1998.
COELHO, A.S.G. BoodP:avaliação dos erros associados a estimativas de distâncias/similaridades genéticas através do procedimento de bootstrap com número variável de marcadores (software). Goiânia: UFG; Instituto de Ciências Biológicas; Laboratório de Genética Vegetal, 2002.
COLLEVATTI, R.G.; GRATTAPAGLIA, D.; HAY, J.D. Population genetic structure of the endangered tropical tree species Caryocar brasiliense, based on variability at microsatellite loci. Molecular Ecology, v.10, p.349-356, 2001.
H.D.; SALES, B.H.N.; SILVA, M.R.R. Antifungal activity of volatile constituents of Eugenia dysenterica leaf oil. Journal of Ethnopharmacology, v.72, p.111-117, 2000.
EXCOFFIER, L.; SMOUSES, P.E.; QUATTRO, J.M. Analysis of molecular variance inferred from metric distances among DNA haplotypes: application to human mitochondrial DNA restriction data. Genetics, v.131, p.479-491, 1992.
LACERDA, D.R.; ACEDO, M.D.P.; LEMOS-FILHO, J.P.; LOVATO, M.B. Genetic diversity and structure of natural populations of Plathymenia reticulata (Mimosoideae), a tropical
tree from the Brazilian cerrado. Molecular Ecology, v.10, p.1143-1152, 2001.
LYNCH, M.; MILLIGAN, B.G. Analysis of population genetic struture with RAPD markers. Molecular Ecology, v.3, p.91-99, 1994.
MARIOT, A. Distribuição da diversidade genética e aspecto na fenologia e dispersão de sementes de pariparoba (Piper cernuum). 2000. 110p. Dissertação (Mestrado) - Universidade Federal de Santa Catarina, Florianópolis.
MURRAY, M.G.; THOMPSON, W.F. Rapid isolation of high molecular weight plant DNA. Nucleic Acids Research, v.8, p.1134-1137, 1980.
ROGERS, S.O.; BENDICH, A.J. Extraction of DNA from milligram amounts of fresh, herbarium and mummified plants tissues. Plant Molecular Biology, v.5, p.69-76, 1985.
ROHLF, F.J. NTSYSpc: numerical taxonomy and multivariate analysis system. New York: Exeter, 1989.
SCHNEIDER, S.; ROESSLI, D.; EXCOFFIER, L. Arlequim ver. 2000: a software for population data analysis. Switzerland: University of Geneva; Genetic and Biometry Laboratory, 2000. SLATKIN, M. Gene flow in natural population. Annual Review of Ecology and Systematics, v.16, p.393-430, 1985.
SNEATH, P.H.; SOKAL, R.R. Numerical taxonomy: the principles and pratice ofnumerical classification. San Francisco, W.H. Freeman, 1973. 573p.
TELLES, M. Diversidade genética e estrutura genética populacional de cagaiteira (Eugenia dysenterica DC.) do sudeste de Goiás. 2000. 129p. Dissertação (Mestrado) - Universidade Federal de Goiás, Goiânia.
TELLES, M.P.C.; COELHO, A.S.G.; CHAVES, L.J.; DINIZ-FILHO, J.A.F.; D’AYALA VALVA, F.Genetic diversity and population structure of Eugenia dysenterica DC. (cagaiteira - Myrtaceae) in Central Brazil: spatial analysis and implications for conservation and management. Conservation Genetics, v.4, p.685-695, 2003. TRINDADE, M.G. Estrutura genética de populações naturais de cagaiteira (Eugenia dysenterica DC.) do nordeste de Goiás. 2001. 99p. Dissertação (Mestrado) - Universidade Federal de Goiás, Goiânia.
WADT, L.H.O. Estrutura genética de populações naturais de pimenta longa (Piper hispidinervum C. DC.). São Paulo: ESALQ/ USP-Departamento de Genética, 2001. 95p.
WRIGHT, S. The genetical structure of populations. Annals of Eugenics, v.15, p.395-420, 1951.
ZUCCHI, M.I. Análise da estrutura genética de Eugenia dysenterica DC. utilizando marcadores de RAPD e SSR. 2003. 130p. Tese (Doutorado) - Escola Superior de Agricultura “Luiz de Queiroz”, Piracicaba.
ZUCCHI, M.I.; BRONDANI, R.V.; PINHEIRO, J.B.; COELHO, A.S.G.; CHAVES, L.J.; VENCOVSKY, R. Genetic structure and gene flow in Eugenia dysenterica DC. in the Brazilian Cerrado utilizing
SSR markers. Genetics and Molecular Biology, v.26, p.449-458, 2003.
ZUCCHI, M.I.; BRONDANI, R.V.; PINHEIRO, J.B.; BRONDANI, C.; VENCOVSKY, R. Transferability of microsatellite markers from Eucalyptus spp. to Eugenia dysenterica (Myrtaceae family). Molecular Ecology Notes, v.2, p.512-514, 2002.